Bois-d'Arcy Airbnb Market Analysis 2025: Short Term Rental Data & Vacation Rental Statistics in Ile-de-France, France
Is Airbnb profitable in Bois-d'Arcy in 2025? Explore comprehensive Airbnb analytics for Bois-d'Arcy, Ile-de-France, France to uncover income potential. This 2025 STR market report for Bois-d'Arcy, based on AirROI data from April 2024 to March 2025, reveals key trends in the niche market of 52 active listings.
Whether you're considering an Airbnb investment in Bois-d'Arcy, optimizing your existing vacation rental, or exploring rental arbitrage opportunities, understanding the Bois-d'Arcy Airbnb data is crucial. Leveraging the low regulation environment is key to maximizing your short term rental income potential. Let's dive into the specifics.
Key Bois-d'Arcy Airbnb Performance Metrics Overview
Monthly Airbnb Revenue Variations & Income Potential in Bois-d'Arcy (2025)
Understanding the monthly revenue variations for Airbnb listings in Bois-d'Arcy is key to maximizing your short term rental income potential. Seasonality significantly impacts earnings. Our analysis, based on data from the past 12 months, shows that the peak revenue month for STRs in Bois-d'Arcy is typically July, while January often presents the lowest earnings, highlighting opportunities for strategic pricing adjustments during shoulder and low seasons. Explore the typical Airbnb income in Bois-d'Arcy across different performance tiers:
- Best-in-class properties (Top 10%) achieve $4,794+ monthly, often utilizing dynamic pricing and superior guest experiences.
- Strong performing properties (Top 25%) earn $2,317 or more, indicating effective management and desirable locations/amenities.
- Typical properties (Median) generate around $1,425 per month, representing the average market performance.
- Entry-level properties (Bottom 25%) see earnings around $713, often with potential for optimization.
Average Monthly Airbnb Earnings Trend in Bois-d'Arcy
Bois-d'Arcy Airbnb Occupancy Rate Trends (2025)
Maximize your bookings by understanding the Bois-d'Arcy STR occupancy trends. Seasonal demand shifts significantly influence how often properties are booked. Typically, Junesees the highest demand (peak season occupancy), while March experiences the lowest (low season). Effective strategies, like adjusting minimum stays or offering promotions, can boost occupancy during slower periods. Here's how different property tiers perform in Bois-d'Arcy:
- Best-in-class properties (Top 10%) achieve 80%+ occupancy, indicating high desirability and potentially optimized availability.
- Strong performing properties (Top 25%) maintain 65% or higher occupancy, suggesting good market fit and guest satisfaction.
- Typical properties (Median) have an occupancy rate around 39%.
- Entry-level properties (Bottom 25%) average 19% occupancy, potentially facing higher vacancy.
Average Monthly Occupancy Rate Trend in Bois-d'Arcy
Average Daily Rate (ADR) Airbnb Trends in Bois-d'Arcy (2025)
Effective short term rental pricing strategy in Bois-d'Arcy involves understanding monthly ADR fluctuations. The Average Daily Rate (ADR) for Airbnb in Bois-d'Arcy typically peaks in November and dips lowest during September. Leveraging Airbnb dynamic pricing tools or strategies based on this seasonality can significantly boost revenue. Here's a look at the typical nightly rates achieved:
- Best-in-class properties (Top 10%) command rates of $337+ per night, often due to premium features or locations.
- Strong performing properties (Top 25%) achieve nightly rates of $194 or more.
- Typical properties (Median) charge around $103 per night.
- Entry-level properties (Bottom 25%) earn around $63 per night.
Average Daily Rate (ADR) Trend by Month in Bois-d'Arcy
Get Live Bois-d'Arcy Market Intelligence 👇

Explore Real-time Analytics
Airbnb Seasonality Analysis & Trends in Bois-d'Arcy (2025)
Peak Season (July, May, June)
- Revenue averages $2,728 per month
- Occupancy rates average 47.6%
- Daily rates average $148
Shoulder Season
- Revenue averages $2,008 per month
- Occupancy maintains around 43.5%
- Daily rates hold near $157
Low Season (January, March, December)
- Revenue drops to average $1,672 per month
- Occupancy decreases to average 34.9%
- Daily rates adjust to average $178
Seasonality Insights for Bois-d'Arcy
- The Airbnb seasonality in Bois-d'Arcy shows moderate seasonality with distinct peak and low periods. While the sections above show seasonal averages, it's also insightful to look at the extremes:
- During the high season, the absolute peak month showcases Bois-d'Arcy's highest earning potential, with monthly revenues capable of climbing to $2,776, occupancy reaching a high of 51.2%, and ADRs peaking at $183.
- Conversely, the slowest single month of the year, typically falling within the low season, marks the market's lowest point. In this month, revenue might dip to $1,663, occupancy could drop to 30.5%, and ADRs may adjust down to $143.
- Understanding both the seasonal averages and these monthly peaks and troughs in revenue, occupancy, and ADR is crucial for maximizing your Airbnb profit potential in Bois-d'Arcy.
Seasonal Strategies for Maximizing Profit
- Peak Season: Maximize revenue through premium pricing and potentially longer minimum stays. Ensure high availability.
- Low Season: Offer competitive pricing, special promotions (e.g., extended stay discounts), and flexible cancellation policies. Target off-season travelers like remote workers or budget-conscious guests.
- Shoulder Seasons: Implement dynamic pricing that balances peak and low rates. Target weekend travelers or specific events. Offer slightly more flexible terms than peak season.
- Regularly analyze your own performance against these Bois-d'Arcy seasonality benchmarks and adjust your pricing and availability strategy accordingly.
Best Areas for Airbnb Investment in Bois-d'Arcy (2025)
Exploring the top neighborhoods for short-term rentals in Bois-d'Arcy? This section highlights key areas, outlining why they are attractive for hosts and guests, along with notable local attractions. Consider these locations based on your target guest profile and investment strategy.
| Neighborhood / Area | Why Host Here? (Target Guests & Appeal) | Key Attractions & Landmarks |
|---|---|---|
| Bois-d'Arcy Center | The heart of Bois-d'Arcy with easy access to shops, restaurants, and public transport. A prime area for those looking for convenience and local charm. | Bois-d'Arcy Town Hall, Local markets, Parks and greenspaces, Cafes, Shops |
| Parc de la Basse Riviere | A beautiful park area that offers a serene environment and outdoor activities. Attractive location for families and those looking to enjoy nature. | Walking trails, Fishing spots, Picnic areas, Wildlife sighting, Ornamental gardens |
| Near Versailles | Proximity to the historic Palace of Versailles, making it a prime attraction for tourists looking to explore French history and architecture. | Palace of Versailles, Gardens of Versailles, Grand Trianon, Petit Trianon, Versailles Market |
| Tech Area | An emerging area with tech firms and innovation hubs, appealing to business travelers and professionals. | Business centers, Coworking spaces, Local eateries, Innovation events, Tech meetups |
| Bois d'Arcy Train Station Area | Convenient access to public transport, providing easy travel to Paris and beyond. Ideal for commuters and tourists alike. | Train station, Cafes nearby, Bus connections, Local shops, Easy access to Paris |
| Local Wine District | Known for its proximity to wine regions, this area offers unique wine-tasting experiences and an authentic French lifestyle. | Vineyards, Wine tasting tours, Culinary experiences, Local food festivals, Historical wineries |
| Cultural District | Rich in culture with local galleries, theaters, and creative spaces. A hub for artists and those seeking cultural experiences. | Art galleries, Theaters, Cultural festivals, Community events, Local artisans |
| Historical Sites Area | Featuring several historical landmarks, this area attracts history buffs and tourists interested in the local heritage. | Historical buildings, Museums, guided tours, Monuments, Cultural heritage sites |
Understanding Airbnb License Requirements & STR Laws in Bois-d'Arcy (2025)
While Bois-d'Arcy, Ile-de-France, France currently shows low STR regulations, specific Airbnb license requirements might still exist or change. Always verify the latest short term rental regulations and Airbnb license requirements directly with local government authorities for Bois-d'Arcy to ensure full compliance before hosting.
(Source: AirROI data, 2025, based on 4% licensed listings)
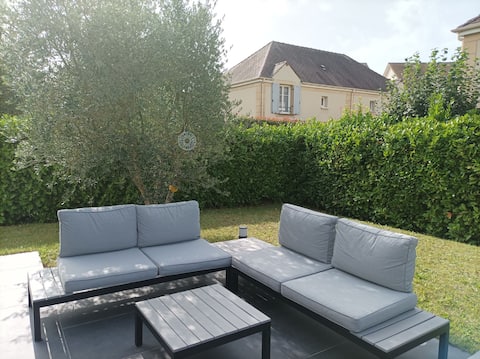
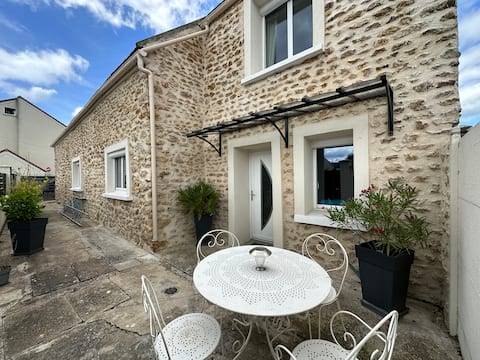
Top Performing Airbnb Properties in Bois-d'Arcy (2025)
Benchmark your potential! Explore examples of top-performing Airbnb properties in Bois-d'Arcybased on Trailing Twelve Month (TTM) revenue. Analyze their characteristics, revenue, occupancy rate, and ADR to understand what drives success in this market.
Olympics games 2024 paris
Entire Place • 4 bedrooms

Villa Chic and Cosy near Versailles
Entire Place • 5 bedrooms
Longère, private space for 4 people
Private Room • 2 bedrooms

Family home, 10’ Versailles & 30’ Paris
Entire Place • 4 bedrooms
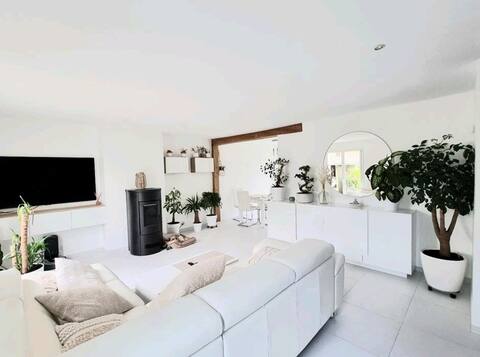
Maison individuelle 115m2
Entire Place • 4 bedrooms
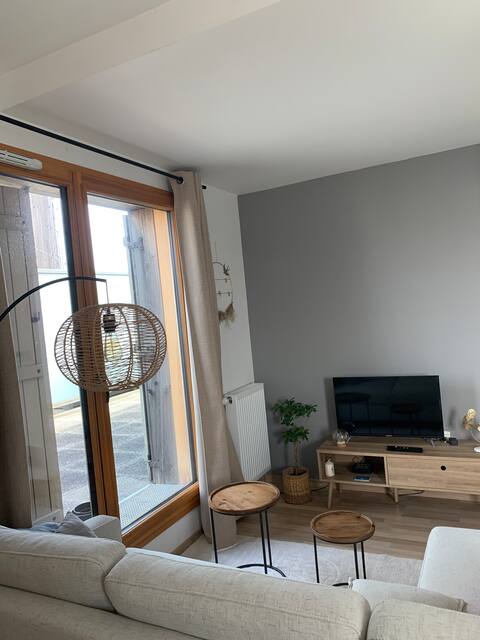
Pleasant T2 - Bois d 'Arcy
Entire Place • 1 bedroom
Note: Performance varies based on location, size, amenities, seasonality, and management quality. Data reflects the past 12 months.
Top Performing Airbnb Hosts in Bois-d'Arcy (2025)
Learn from the best! This table showcases top-performing Airbnb hosts in Bois-d'Arcy based on the number of properties managed and estimated total revenue over the past year. Analyze their scale and performance metrics.
| Host Name | Properties | Grossing Revenue | Stay Reviews | Avg Rating |
|---|---|---|---|---|
| Host #395788673 | 1 | $78,390 | 0 | 0.00/5.0 |
| Laurent | 1 | $61,935 | 12 | 4.83/5.0 |
| Patrick | 2 | $30,477 | 16 | 2.46/5.0 |
| De Seroux | 1 | $25,556 | 3 | 5.00/5.0 |
| Host #232251969 | 1 | $24,884 | 0 | 0.00/5.0 |
| Estelle | 1 | $23,412 | 8 | 5.00/5.0 |
| Host #43517602 | 1 | $21,514 | 0 | 0.00/5.0 |
| Afi | 1 | $21,172 | 43 | 4.77/5.0 |
| Néli | 1 | $20,072 | 47 | 4.68/5.0 |
| Charline | 1 | $19,676 | 389 | 4.88/5.0 |
Analyzing the strategies of top hosts, such as their property selection, pricing, and guest communication, can offer valuable lessons for optimizing your own Airbnb operations in Bois-d'Arcy.
Dive Deeper: Advanced Bois-d'Arcy STR Market Data (2025)
Ready to unlock more insights? AirROI provides access to advanced metrics and comprehensive Airbnb data for Bois-d'Arcy. Explore detailed analytics beyond this report to refine your investment strategy, optimize pricing, and maximize your vacation rental profits.
Explore Advanced MetricsBois-d'Arcy Short-Term Rental Market Composition (2025): Property & Room Types
Room Type Distribution
Property Type Distribution
Market Composition Insights for Bois-d'Arcy
- The Bois-d'Arcy Airbnb market composition is heavily skewed towards Entire Home/Apt listings, which make up 65.4% of the 52 active rentals. This indicates strong guest preference for privacy and space.
- However, a notable 34.6% share for Private Rooms suggests opportunities for budget-conscious travelers or hosts renting out spare rooms.
- Looking at the property type distribution in Bois-d'Arcy, Apartment/Condo properties are the most common (53.8%), reflecting the local real estate landscape.
- Houses represent a significant 36.5% portion, catering likely to families or larger groups.
- The presence of 9.6% Hotel/Boutique listings indicates integration with traditional hospitality.
Bois-d'Arcy Airbnb Room Capacity Analysis (2025): Bedroom Distribution
Distribution of Listings by Number of Bedrooms
Room Capacity Insights for Bois-d'Arcy
- The dominant room capacity in Bois-d'Arcy is 1 bedroom listings, making up 46.2% of the market. This suggests a strong demand for properties suitable for couples or solo travelers.
- Together, 1 bedroom and 2 bedrooms properties represent 69.3% of the active Airbnb listings in Bois-d'Arcy, indicating a high concentration in these sizes.
Bois-d'Arcy Vacation Rental Guest Capacity Trends (2025)
Distribution of Listings by Guest Capacity
Guest Capacity Insights for Bois-d'Arcy
- The most common guest capacity trend in Bois-d'Arcy vacation rentals is listings accommodating 4 guests (26.9%). This suggests the primary traveler segment is likely small families or groups.
- Properties designed for 4 guests and 2 guests dominate the Bois-d'Arcy STR market, accounting for 53.8% of listings.
- 21.2% of properties accommodate 6+ guests, serving the market segment for larger families or group travel in Bois-d'Arcy.
- On average, properties in Bois-d'Arcy are equipped to host 3.7 guests.
Bois-d'Arcy Airbnb Booking Patterns (2025): Available vs. Booked Days
Available Days Distribution
Booked Days Distribution
Booking Pattern Insights for Bois-d'Arcy
- The most common availability pattern in Bois-d'Arcy falls within the 271-366 days range, representing 67.3% of listings. This suggests many properties have significant open periods on their calendars.
- Approximately 86.5% of listings show high availability (181+ days open annually), indicating potential for increased bookings or specific owner usage patterns.
- For booked days, the 1-30 days range is most frequent in Bois-d'Arcy (38.5%), reflecting common guest stay durations or potential owner blocking patterns.
- A notable 15.3% of properties secure long booking periods (181+ days booked per year), highlighting successful long-term rental strategies or significant owner usage.
Bois-d'Arcy Airbnb Minimum Stay Requirements Analysis
Distribution of Listings by Minimum Night Requirement
1 Night
24 listings
53.3% of total
2 Nights
7 listings
15.6% of total
3 Nights
5 listings
11.1% of total
4-6 Nights
5 listings
11.1% of total
7-29 Nights
2 listings
4.4% of total
30+ Nights
2 listings
4.4% of total
Key Insights
- The most prevalent minimum stay requirement in Bois-d'Arcy is 1 Night, adopted by 53.3% of listings. This highlights the market's preference for shorter, flexible bookings.
- A strong majority (68.9%) of the Bois-d'Arcy Airbnb data shows acceptance of very short stays (1-2 nights), indicating a dynamic, high-turnover market.
Recommendations
- Align with the market by considering a 1 Night minimum stay, as 53.3% of Bois-d'Arcy hosts use this setting.
- Adjust minimum nights based on seasonality – potentially shorter during low season and longer during peak demand periods in Bois-d'Arcy.
Bois-d'Arcy Airbnb Cancellation Policy Trends Analysis (2025)
Flexible
15 listings
57.7% of total
Moderate
6 listings
23.1% of total
Firm
3 listings
11.5% of total
Strict
2 listings
7.7% of total
Cancellation Policy Insights for Bois-d'Arcy
- The prevailing Airbnb cancellation policy trend in Bois-d'Arcy is Flexible, used by 57.7% of listings.
- The market strongly favors guest-friendly terms, with 80.8% of listings offering Flexible or Moderate policies. This suggests guests in Bois-d'Arcy may expect booking flexibility.
- Strict cancellation policies are quite rare (7.7%), potentially making listings with this policy less competitive unless justified by high demand or property type.
Recommendations for Hosts
- Consider adopting a Flexible policy to align with the 57.7% market standard in Bois-d'Arcy.
- Given the high prevalence of Flexible policies (57.7%), offering this can enhance booking appeal, especially during shoulder seasons.
- Using a Strict policy might deter some guests, as only 7.7% of listings use it. Evaluate if potential revenue protection outweighs possible lower booking rates.
- Regularly review your cancellation policy against competitors and market demand shifts in Bois-d'Arcy.
Bois-d'Arcy STR Booking Lead Time Analysis (2025)
Average Booking Lead Time by Month
Booking Lead Time Insights for Bois-d'Arcy
- The overall average booking lead time for vacation rentals in Bois-d'Arcy is 33 days.
- Guests book furthest in advance for stays during July (average 107 days), likely coinciding with peak travel demand or local events.
- The shortest booking windows occur for stays in March (average 15 days), indicating more last-minute travel plans during this time.
- Seasonally, Summer (78 days avg.) sees the longest lead times, while Fall (29 days avg.) has the shortest, reflecting typical travel planning cycles.
Recommendations for Hosts
- Use the overall average lead time (33 days) as a baseline for your pricing and availability strategy in Bois-d'Arcy.
- For July stays, consider implementing length-of-stay discounts or slightly higher rates for bookings made less than 107 days out to capitalize on advance planning.
- Target marketing efforts for the Summer season well in advance (at least 78 days) to capture early planners.
- Monitor your own booking lead times against these Bois-d'Arcy averages to identify opportunities for dynamic pricing adjustments.
Popular & Essential Airbnb Amenities in Bois-d'Arcy (2025)
Amenity Prevalence
Amenity Insights for Bois-d'Arcy
- Essential amenities in Bois-d'Arcy that guests expect include: Wifi, Hot water, Smoke alarm, Heating. Lacking these (any) could significantly impact bookings.
- Popular amenities like Kitchen, Washer, TV are common but not universal. Offering these can provide a competitive edge.
Recommendations for Hosts
- Ensure your listing includes all essential amenities for Bois-d'Arcy: Wifi, Hot water, Smoke alarm, Heating.
- Prioritize adding missing essentials: Wifi, Hot water, Smoke alarm, Heating.
- Consider adding popular differentiators like Kitchen or Washer to increase appeal.
- Highlight unique or less common amenities you offer (e.g., hot tub, dedicated workspace, EV charger) in your listing description and photos.
- Regularly check competitor amenities in Bois-d'Arcy to stay competitive.
Bois-d'Arcy Airbnb Guest Demographics & Profile Analysis (2025)
Guest Profile Summary for Bois-d'Arcy
- The typical guest profile for Airbnb in Bois-d'Arcy consists of primarily domestic travelers (76%), often arriving from nearby Paris, typically belonging to the Post-2000s (Gen Z/Alpha) group (50%), primarily speaking French or English.
- Domestic travelers account for 75.9% of guests.
- Key international markets include France (75.9%) and United Kingdom (6.9%).
- Top languages spoken are French (40.8%) followed by English (31.9%).
- A significant demographic segment is the Post-2000s (Gen Z/Alpha) group, representing 50% of guests.
Recommendations for Hosts
- Target domestic marketing efforts towards travelers from Paris and Pau.
- Tailor amenities and listing descriptions to appeal to the dominant Post-2000s (Gen Z/Alpha) demographic (e.g., highlight fast WiFi, smart home features, local guides).
- Highlight unique local experiences or amenities relevant to the primary guest profile.
- Consider seasonal promotions aligned with peak travel times for key origin markets.
Nearby Short-Term Rental Market Comparison
How does the Bois-d'Arcy Airbnb market stack up against its neighbors? Compare key performance metrics like average monthly revenue, ADR, and occupancy rates in surrounding areas to understand the broader regional STR landscape.
| Market | Active Properties | Monthly Revenue | Daily Rate | Avg. Occupancy |
|---|---|---|---|---|
| Morienval | 10 | $5,794 | $400.84 | 32% |
| Verdelot | 13 | $3,885 | $300.79 | 46% |
| Trigny | 10 | $3,775 | $248.19 | 46% |
| La Couture-Boussey | 12 | $3,620 | $378.08 | 28% |
| Dourdan | 15 | $3,576 | $223.06 | 52% |
| Rosoy-en-Multien | 15 | $3,558 | $367.61 | 51% |
| Millançay | 11 | $3,476 | $370.42 | 39% |
| Chaintreaux | 11 | $3,136 | $278.28 | 34% |
| Langon-sur-Cher | 12 | $3,127 | $400.27 | 35% |
| Mesnils-sur-Iton | 22 | $3,028 | $309.05 | 40% |