Nkolafamba Airbnb Market Analysis 2025: Short Term Rental Data & Vacation Rental Statistics in Centre, Cameroon
Is Airbnb profitable in Nkolafamba in 2025? Explore comprehensive Airbnb analytics for Nkolafamba, Centre, Cameroon to uncover income potential. This 2025 STR market report for Nkolafamba, based on AirROI data from May 2024 to April 2025, reveals key trends in the niche market of 19 active listings.
Whether you're considering an Airbnb investment in Nkolafamba, optimizing your existing vacation rental, or exploring rental arbitrage opportunities, understanding the Nkolafamba Airbnb data is crucial. Leveraging the low regulation environment is key to maximizing your short term rental income potential. Let's dive into the specifics.
Key Nkolafamba Airbnb Performance Metrics Overview
Monthly Airbnb Revenue Variations & Income Potential in Nkolafamba (2025)
Understanding the monthly revenue variations for Airbnb listings in Nkolafamba is key to maximizing your short term rental income potential. Seasonality significantly impacts earnings. Our analysis, based on data from the past 12 months, shows that the peak revenue month for STRs in Nkolafamba is typically November, while February often presents the lowest earnings, highlighting opportunities for strategic pricing adjustments during shoulder and low seasons. Explore the typical Airbnb income in Nkolafamba across different performance tiers:
- Best-in-class properties (Top 10%) achieve $1,935+ monthly, often utilizing dynamic pricing and superior guest experiences.
- Strong performing properties (Top 25%) earn $1,207 or more, indicating effective management and desirable locations/amenities.
- Typical properties (Median) generate around $616 per month, representing the average market performance.
- Entry-level properties (Bottom 25%) see earnings around $359, often with potential for optimization.
Average Monthly Airbnb Earnings Trend in Nkolafamba
Nkolafamba Airbnb Occupancy Rate Trends (2025)
Maximize your bookings by understanding the Nkolafamba STR occupancy trends. Seasonal demand shifts significantly influence how often properties are booked. Typically, Octobersees the highest demand (peak season occupancy), while February experiences the lowest (low season). Effective strategies, like adjusting minimum stays or offering promotions, can boost occupancy during slower periods. Here's how different property tiers perform in Nkolafamba:
- Best-in-class properties (Top 10%) achieve 66%+ occupancy, indicating high desirability and potentially optimized availability.
- Strong performing properties (Top 25%) maintain 38% or higher occupancy, suggesting good market fit and guest satisfaction.
- Typical properties (Median) have an occupancy rate around 24%.
- Entry-level properties (Bottom 25%) average 13% occupancy, potentially facing higher vacancy.
Average Monthly Occupancy Rate Trend in Nkolafamba
Average Daily Rate (ADR) Airbnb Trends in Nkolafamba (2025)
Effective short term rental pricing strategy in Nkolafamba involves understanding monthly ADR fluctuations. The Average Daily Rate (ADR) for Airbnb in Nkolafamba typically peaks in January and dips lowest during May. Leveraging Airbnb dynamic pricing tools or strategies based on this seasonality can significantly boost revenue. Here's a look at the typical nightly rates achieved:
- Best-in-class properties (Top 10%) command rates of $97+ per night, often due to premium features or locations.
- Strong performing properties (Top 25%) achieve nightly rates of $57 or more.
- Typical properties (Median) charge around $35 per night.
- Entry-level properties (Bottom 25%) earn around $24 per night.
Average Daily Rate (ADR) Trend by Month in Nkolafamba
Get Live Nkolafamba Market Intelligence 👇
Explore Real-time Analytics
Airbnb Seasonality Analysis & Trends in Nkolafamba (2025)
Peak Season (November, May, June)
- Revenue averages $1,142 per month
- Occupancy rates average 41.9%
- Daily rates average $46
Shoulder Season
- Revenue averages $913 per month
- Occupancy maintains around 33.2%
- Daily rates hold near $48
Low Season (February, July, August)
- Revenue drops to average $633 per month
- Occupancy decreases to average 22.9%
- Daily rates adjust to average $47
Seasonality Insights for Nkolafamba
- The Airbnb seasonality in Nkolafamba shows highly seasonal trends requiring careful strategy. While the sections above show seasonal averages, it's also insightful to look at the extremes:
- During the high season, the absolute peak month showcases Nkolafamba's highest earning potential, with monthly revenues capable of climbing to $1,171, occupancy reaching a high of 60.2%, and ADRs peaking at $51.
- Conversely, the slowest single month of the year, typically falling within the low season, marks the market's lowest point. In this month, revenue might dip to $539, occupancy could drop to 17.9%, and ADRs may adjust down to $46.
- Understanding both the seasonal averages and these monthly peaks and troughs in revenue, occupancy, and ADR is crucial for maximizing your Airbnb profit potential in Nkolafamba.
Seasonal Strategies for Maximizing Profit
- Peak Season: Maximize revenue through premium pricing and potentially longer minimum stays. Ensure high availability.
- Low Season: Offer competitive pricing, special promotions (e.g., extended stay discounts), and flexible cancellation policies. Target off-season travelers like remote workers or budget-conscious guests.
- Shoulder Seasons: Implement dynamic pricing that balances peak and low rates. Target weekend travelers or specific events. Offer slightly more flexible terms than peak season.
- Regularly analyze your own performance against these Nkolafamba seasonality benchmarks and adjust your pricing and availability strategy accordingly.
Best Areas for Airbnb Investment in Nkolafamba (2025)
Exploring the top neighborhoods for short-term rentals in Nkolafamba? This section highlights key areas, outlining why they are attractive for hosts and guests, along with notable local attractions. Consider these locations based on your target guest profile and investment strategy.
| Neighborhood / Area | Why Host Here? (Target Guests & Appeal) | Key Attractions & Landmarks |
|---|---|---|
| Nkolafamba Central | A bustling hub in Nkolafamba that offers convenience and access to local markets and amenities. Ideal for guests seeking an authentic Cameroonian experience with modern comforts. | Local markets, Restaurants, Cultural centers, Community events |
| Mount Cameroon View | Stunning views of Mount Cameroon and great hiking opportunities. Perfect for nature lovers and adventure seekers looking to explore the beauty of the region. | Hiking trails, Nature reserves, Scenic viewpoints |
| Biyem-Assi | Close to key urban facilities and an emerging neighborhood with growing popularity among travelers. Offers a blend of urban and cultural experiences. | Local art shops, Cultural landmarks, Traditional eateries |
| Akwa District | A vibrant district known for its nightlife and entertainment options. Popular among younger travelers looking for a lively experience near the heart of Douala. | Nightclubs, Live music venues, Dining options |
| Eko hotel area | A luxurious area with upscale accommodation options and business facilities. Suitable for business travelers and those seeking a refined stay. | Business centers, Upscale restaurants, Shopping centers |
| Bamenda Old Town | Rich in history and culture, this area attracts tourists interested in the heritage of Cameroon. Offers a unique cultural experience. | Historical sites, Museums, Cultural festivals |
| Nkongsamba | Known for its natural beauty and serenity, Nkongsamba attracts those looking to escape urban life for a peaceful retreat in nature. | Nature parks, Waterfalls, Scenic landscapes |
| Dschang | A key location for educational and cultural tourism, home to several institutions and festivals. Attracts students and educational tourists. | Universities, Cultural festivals, Local cafés |
Understanding Airbnb License Requirements & STR Laws in Nkolafamba (2025)
While Nkolafamba, Centre, Cameroon currently shows low STR regulations, specific Airbnb license requirements might still exist or change. Always verify the latest short term rental regulations and Airbnb license requirements directly with local government authorities for Nkolafamba to ensure full compliance before hosting.
(Source: AirROI data, 2025, finding no licensed listings among those analyzed)
Top Performing Airbnb Properties in Nkolafamba (2025)
Benchmark your potential! Explore examples of top-performing Airbnb properties in Nkolafambabased on Trailing Twelve Month (TTM) revenue. Analyze their characteristics, revenue, occupancy rate, and ADR to understand what drives success in this market.

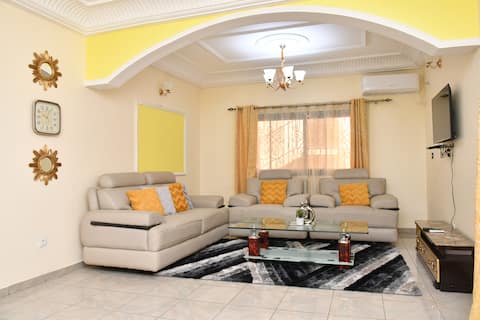
Green Earth Home - Superbe Penthouse lumineux
Entire Place • 4 bedrooms
Grand T3 (2 chambres ) - ETS Hélène
Private Room • 2 bedrooms
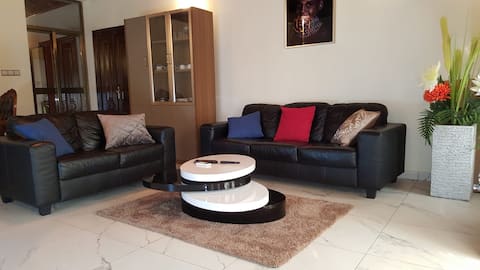
Clarahouse Residence
Entire Place • 2 bedrooms

casamia 3!crossroads market ekie, washing machine
Entire Place • 1 bedroom

Modern apartment hot Water&Clim
Entire Place • 2 bedrooms

Magnifique villa franco-camerounaise
Entire Place • 2 bedrooms
Note: Performance varies based on location, size, amenities, seasonality, and management quality. Data reflects the past 12 months.
Top Performing Airbnb Hosts in Nkolafamba (2025)
Learn from the best! This table showcases top-performing Airbnb hosts in Nkolafamba based on the number of properties managed and estimated total revenue over the past year. Analyze their scale and performance metrics.
| Host Name | Properties | Grossing Revenue | Stay Reviews | Avg Rating |
|---|---|---|---|---|
| Raphaël | 3 | $18,344 | 6 | 1.67/5.0 |
| Host #399224200 | 1 | $8,062 | 0 | 0.00/5.0 |
| Host #458233036 | 1 | $5,343 | 0 | 0.00/5.0 |
| Marie | 1 | $4,179 | 19 | 4.58/5.0 |
| Host #436910159 | 1 | $3,614 | 0 | 0.00/5.0 |
| Host #463260848 | 2 | $3,514 | 0 | 0.00/5.0 |
| Host #476407446 | 1 | $3,185 | 0 | 0.00/5.0 |
| Host #152939540 | 1 | $2,911 | 0 | 0.00/5.0 |
| Host #451534284 | 1 | $2,851 | 0 | 0.00/5.0 |
| Host #485651030 | 1 | $2,542 | 0 | 0.00/5.0 |
Analyzing the strategies of top hosts, such as their property selection, pricing, and guest communication, can offer valuable lessons for optimizing your own Airbnb operations in Nkolafamba.
Dive Deeper: Advanced Nkolafamba STR Market Data (2025)
Ready to unlock more insights? AirROI provides access to advanced metrics and comprehensive Airbnb data for Nkolafamba. Explore detailed analytics beyond this report to refine your investment strategy, optimize pricing, and maximize your vacation rental profits.
Explore Advanced MetricsNkolafamba Short-Term Rental Market Composition (2025): Property & Room Types
Room Type Distribution
Property Type Distribution
Market Composition Insights for Nkolafamba
- The Nkolafamba Airbnb market composition is heavily skewed towards Entire Home/Apt listings, which make up 78.9% of the 19 active rentals. This indicates strong guest preference for privacy and space.
- Looking at the property type distribution in Nkolafamba, Apartment/Condo properties are the most common (78.9%), reflecting the local real estate landscape.
- The presence of 10.5% Hotel/Boutique listings indicates integration with traditional hospitality.
Nkolafamba Airbnb Room Capacity Analysis (2025): Bedroom Distribution
Distribution of Listings by Number of Bedrooms
Room Capacity Insights for Nkolafamba
- The dominant room capacity in Nkolafamba is 2 bedrooms listings, making up 52.6% of the market. This suggests a strong demand for properties suitable for couples or solo travelers.
- Together, 2 bedrooms and 1 bedroom properties represent 89.4% of the active Airbnb listings in Nkolafamba, indicating a high concentration in these sizes.
Nkolafamba Vacation Rental Guest Capacity Trends (2025)
Distribution of Listings by Guest Capacity
Guest Capacity Insights for Nkolafamba
- The most common guest capacity trend in Nkolafamba vacation rentals is listings accommodating 4 guests (52.6%). This suggests the primary traveler segment is likely small families or groups.
- Properties designed for 4 guests and 2 guests dominate the Nkolafamba STR market, accounting for 78.9% of listings.
- 10.6% of properties accommodate 6+ guests, serving the market segment for larger families or group travel in Nkolafamba.
- On average, properties in Nkolafamba are equipped to host 3.7 guests.
Nkolafamba Airbnb Booking Patterns (2025): Available vs. Booked Days
Available Days Distribution
Booked Days Distribution
Booking Pattern Insights for Nkolafamba
- The most common availability pattern in Nkolafamba falls within the 271-366 days range, representing 89.5% of listings. This suggests many properties have significant open periods on their calendars.
- Approximately 94.8% of listings show high availability (181+ days open annually), indicating potential for increased bookings or specific owner usage patterns.
- For booked days, the 31-90 days range is most frequent in Nkolafamba (68.4%), reflecting common guest stay durations or potential owner blocking patterns.
- A notable 5.3% of properties secure long booking periods (181+ days booked per year), highlighting successful long-term rental strategies or significant owner usage.
Nkolafamba Airbnb Minimum Stay Requirements Analysis
Distribution of Listings by Minimum Night Requirement
1 Night
11 listings
64.7% of total
2 Nights
2 listings
11.8% of total
3 Nights
3 listings
17.6% of total
30+ Nights
1 listings
5.9% of total
Key Insights
- The most prevalent minimum stay requirement in Nkolafamba is 1 Night, adopted by 64.7% of listings. This highlights the market's preference for shorter, flexible bookings.
- A strong majority (76.5%) of the Nkolafamba Airbnb data shows acceptance of very short stays (1-2 nights), indicating a dynamic, high-turnover market.
Recommendations
- Align with the market by considering a 1 Night minimum stay, as 64.7% of Nkolafamba hosts use this setting.
- Explore offering discounts for stays of 30+ nights to attract the 5.9% of the market seeking extended stays.
- Adjust minimum nights based on seasonality – potentially shorter during low season and longer during peak demand periods in Nkolafamba.
Nkolafamba Airbnb Cancellation Policy Trends Analysis (2025)
Flexible
2 listings
50% of total
Firm
1 listings
25% of total
Strict
1 listings
25% of total
Cancellation Policy Insights for Nkolafamba
- The prevailing Airbnb cancellation policy trend in Nkolafamba is Flexible, used by 50% of listings.
- There's a relatively balanced mix between guest-friendly (50.0%) and stricter (50.0%) policies, offering choices for different guest needs.
Recommendations for Hosts
- Consider adopting a Flexible policy to align with the 50% market standard in Nkolafamba.
- Regularly review your cancellation policy against competitors and market demand shifts in Nkolafamba.
Nkolafamba STR Booking Lead Time Analysis (2025)
Average Booking Lead Time by Month
Booking Lead Time Insights for Nkolafamba
- The overall average booking lead time for vacation rentals in Nkolafamba is 18 days.
- Guests book furthest in advance for stays during December (average 54 days), likely coinciding with peak travel demand or local events.
- The shortest booking windows occur for stays in November (average 3 days), indicating more last-minute travel plans during this time.
- Seasonally, Winter (33 days avg.) sees the longest lead times, while Spring (9 days avg.) has the shortest, reflecting typical travel planning cycles.
Recommendations for Hosts
- Use the overall average lead time (18 days) as a baseline for your pricing and availability strategy in Nkolafamba.
- For December stays, consider implementing length-of-stay discounts or slightly higher rates for bookings made less than 54 days out to capitalize on advance planning.
- During November, focus on last-minute booking availability and promotions, as guests book with very short notice (3 days avg.).
- Target marketing efforts for the Winter season well in advance (at least 33 days) to capture early planners.
- Monitor your own booking lead times against these Nkolafamba averages to identify opportunities for dynamic pricing adjustments.
Popular & Essential Airbnb Amenities in Nkolafamba (2025)
Amenity Prevalence
Amenity Insights for Nkolafamba
- Essential amenities in Nkolafamba that guests expect include: TV. Lacking these (this) could significantly impact bookings.
- Popular amenities like Kitchen, Free parking on premises, Essentials are common but not universal. Offering these can provide a competitive edge.
- Warning: Wifi is not universally provided but is considered essential globally. Ensure reliable Wifi is offered.
Recommendations for Hosts
- Ensure your listing includes all essential amenities for Nkolafamba: TV.
- Consider adding popular differentiators like Kitchen or Free parking on premises to increase appeal.
- Highlight unique or less common amenities you offer (e.g., hot tub, dedicated workspace, EV charger) in your listing description and photos.
- Regularly check competitor amenities in Nkolafamba to stay competitive.
Nkolafamba Airbnb Guest Demographics & Profile Analysis (2025)
Guest Profile Summary for Nkolafamba
- The typical guest profile for Airbnb in Nkolafamba consists of predominantly international visitors (100%), with top international origins including United States, typically belonging to the Post-2000s (Gen Z/Alpha) group (50%), primarily speaking French or English.
- Domestic travelers account for 0.0% of guests.
- Key international markets include France (57.1%) and United States (28.6%).
- Top languages spoken are French (44.4%) followed by English (33.3%).
- A significant demographic segment is the Post-2000s (Gen Z/Alpha) group, representing 50% of guests.
Recommendations for Hosts
- Focus marketing internationally, particularly towards travelers from United States.
- Offer listing details and communication support in French.
- Tailor amenities and listing descriptions to appeal to the dominant Post-2000s (Gen Z/Alpha) demographic (e.g., highlight fast WiFi, smart home features, local guides).
- Highlight unique local experiences or amenities relevant to the primary guest profile.
- Consider seasonal promotions aligned with peak travel times for key origin markets.
Nearby Short-Term Rental Market Comparison
How does the Nkolafamba Airbnb market stack up against its neighbors? Compare key performance metrics like average monthly revenue, ADR, and occupancy rates in surrounding areas to understand the broader regional STR landscape.