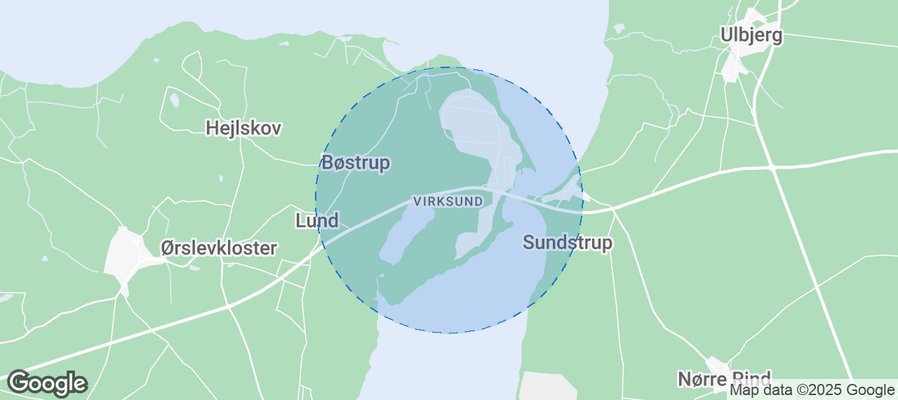
Virksund Airbnb Market Analysis 2025: Short Term Rental Data & Vacation Rental Statistics in Central Denmark Region, Denmark
Is Airbnb profitable in Virksund in 2025? Explore comprehensive Airbnb analytics for Virksund, Central Denmark Region, Denmark to uncover income potential. This 2025 STR market report for Virksund, based on AirROI data from May 2024 to April 2025, reveals key trends in the niche market of 20 active listings.
Whether you're considering an Airbnb investment in Virksund, optimizing your existing vacation rental, or exploring rental arbitrage opportunities, understanding the Virksund Airbnb data is crucial. Leveraging the low regulation environment is key to maximizing your short term rental income potential. Let's dive into the specifics.
Key Virksund Airbnb Performance Metrics Overview
Monthly Airbnb Revenue Variations & Income Potential in Virksund (2025)
Understanding the monthly revenue variations for Airbnb listings in Virksund is key to maximizing your short term rental income potential. Seasonality significantly impacts earnings. Our analysis, based on data from the past 12 months, shows that the peak revenue month for STRs in Virksund is typically May, while February often presents the lowest earnings, highlighting opportunities for strategic pricing adjustments during shoulder and low seasons. Explore the typical Airbnb income in Virksund across different performance tiers:
- Best-in-class properties (Top 10%) achieve $4,597+ monthly, often utilizing dynamic pricing and superior guest experiences.
- Strong performing properties (Top 25%) earn $3,096 or more, indicating effective management and desirable locations/amenities.
- Typical properties (Median) generate around $1,625 per month, representing the average market performance.
- Entry-level properties (Bottom 25%) see earnings around $978, often with potential for optimization.
Average Monthly Airbnb Earnings Trend in Virksund
Virksund Airbnb Occupancy Rate Trends (2025)
Maximize your bookings by understanding the Virksund STR occupancy trends. Seasonal demand shifts significantly influence how often properties are booked. Typically, Junesees the highest demand (peak season occupancy), while April experiences the lowest (low season). Effective strategies, like adjusting minimum stays or offering promotions, can boost occupancy during slower periods. Here's how different property tiers perform in Virksund:
- Best-in-class properties (Top 10%) achieve 61%+ occupancy, indicating high desirability and potentially optimized availability.
- Strong performing properties (Top 25%) maintain 31% or higher occupancy, suggesting good market fit and guest satisfaction.
- Typical properties (Median) have an occupancy rate around 16%.
- Entry-level properties (Bottom 25%) average 11% occupancy, potentially facing higher vacancy.
Average Monthly Occupancy Rate Trend in Virksund
Average Daily Rate (ADR) Airbnb Trends in Virksund (2025)
Effective short term rental pricing strategy in Virksund involves understanding monthly ADR fluctuations. The Average Daily Rate (ADR) for Airbnb in Virksund typically peaks in April and dips lowest during November. Leveraging Airbnb dynamic pricing tools or strategies based on this seasonality can significantly boost revenue. Here's a look at the typical nightly rates achieved:
- Best-in-class properties (Top 10%) command rates of $401+ per night, often due to premium features or locations.
- Strong performing properties (Top 25%) achieve nightly rates of $249 or more.
- Typical properties (Median) charge around $181 per night.
- Entry-level properties (Bottom 25%) earn around $120 per night.
Average Daily Rate (ADR) Trend by Month in Virksund
Get Live Virksund Market Intelligence 👇
Explore Real-time Analytics
Airbnb Seasonality Analysis & Trends in Virksund (2025)
Peak Season (May, June, December)
- Revenue averages $3,951 per month
- Occupancy rates average 31.7%
- Daily rates average $212
Shoulder Season
- Revenue averages $1,795 per month
- Occupancy maintains around 25.3%
- Daily rates hold near $214
Low Season (February, April, September)
- Revenue drops to average $1,039 per month
- Occupancy decreases to average 19.3%
- Daily rates adjust to average $233
Seasonality Insights for Virksund
- The Airbnb seasonality in Virksund shows highly seasonal trends requiring careful strategy. While the sections above show seasonal averages, it's also insightful to look at the extremes:
- During the high season, the absolute peak month showcases Virksund's highest earning potential, with monthly revenues capable of climbing to $5,121, occupancy reaching a high of 41.1%, and ADRs peaking at $255.
- Conversely, the slowest single month of the year, typically falling within the low season, marks the market's lowest point. In this month, revenue might dip to $764, occupancy could drop to 18.0%, and ADRs may adjust down to $193.
- Understanding both the seasonal averages and these monthly peaks and troughs in revenue, occupancy, and ADR is crucial for maximizing your Airbnb profit potential in Virksund.
Seasonal Strategies for Maximizing Profit
- Peak Season: Maximize revenue through premium pricing and potentially longer minimum stays. Ensure high availability.
- Low Season: Offer competitive pricing, special promotions (e.g., extended stay discounts), and flexible cancellation policies. Target off-season travelers like remote workers or budget-conscious guests.
- Shoulder Seasons: Implement dynamic pricing that balances peak and low rates. Target weekend travelers or specific events. Offer slightly more flexible terms than peak season.
- Regularly analyze your own performance against these Virksund seasonality benchmarks and adjust your pricing and availability strategy accordingly.
Best Areas for Airbnb Investment in Virksund (2025)
Exploring the top neighborhoods for short-term rentals in Virksund? This section highlights key areas, outlining why they are attractive for hosts and guests, along with notable local attractions. Consider these locations based on your target guest profile and investment strategy.
| Neighborhood / Area | Why Host Here? (Target Guests & Appeal) | Key Attractions & Landmarks |
|---|---|---|
| Virksund Beach | A scenic coastal area known for its beautiful beaches and family-friendly atmosphere. Ideal for tourists looking for a relaxing getaway by the sea. | Virksund Strand, Nature walks, Local fishing spots, Water sports activities, Sunny picnic areas |
| Virksund Harbour | A charming harbour area perfect for those interested in boating and fishing. Popular among those who enjoy water activities and the local seafood cuisine. | Virksund Harbour, Fishing tours, Boat rentals, Quaint seafood restaurants, Scenic waterfront views |
| Morsø National Park | Located nearby, this national park offers stunning nature trails and wildlife experiences, attracting nature enthusiasts and hikers. | Hiking trails, Bicycle routes, Wildlife watching, Scenic viewpoints, Nature exhibits |
| Fur Island | Just a short ferry ride away, Fur Island offers unique local culture and attractions such as rich history and beautiful landscapes, ideal for a day trip. | Fur Museum, Walking trails, Local artisan shops, Scenic views of the Limfjord, Ferry experiences |
| Nykøbing Mors | The largest town in the area offering various amenities, shops, and cultural attractions. Great for those who enjoy dining out and local events. | Nykøbing Mors Museum, Shopping streets, Park areas, Cafés and restaurants, Local festivals |
| Metropol Scene | An entertainment venue in Nykøbing that hosts various cultural events and performances, attracting both locals and visitors looking for nightlife. | Live performances, Theater shows, Concerts, Cultural events, Local community gatherings |
| Morsø Art Center | A cultural hub featuring art galleries and exhibitions, appealing to creative tourists and art lovers looking to explore local artistic expressions. | Art exhibitions, Workshops, Local artist showcases, Art-related events, Interactive art experiences |
| Local Vineyards | The nearby vineyards offer wine tasting experiences and tours, attracting wine enthusiasts and those interested in local gastronomy. | Wine tasting, Guided tours of vineyards, Local dessert pairings, Scenic vineyard views, Culinary events |
Understanding Airbnb License Requirements & STR Laws in Virksund (2025)
While Virksund, Central Denmark Region, Denmark currently shows low STR regulations, specific Airbnb license requirements might still exist or change. Always verify the latest short term rental regulations and Airbnb license requirements directly with local government authorities for Virksund to ensure full compliance before hosting.
(Source: AirROI data, 2025, finding no licensed listings among those analyzed)
Top Performing Airbnb Properties in Virksund (2025)
Benchmark your potential! Explore examples of top-performing Airbnb properties in Virksundbased on Trailing Twelve Month (TTM) revenue. Analyze their characteristics, revenue, occupancy rate, and ADR to understand what drives success in this market.

"Blome" - 150m to the inlet by Interhome
Entire Place • 2 bedrooms

"Niesina" - 600m to the inlet by Interhome
Entire Place • 2 bedrooms

20 person holiday home in highslev
Entire Place • 7 bedrooms

"Anine" - 200m to the inlet by Interhome
Entire Place • 5 bedrooms

"Aman" - 700m to the inlet by Interhome
Entire Place • 3 bedrooms
7 person holiday home in højslev
Entire Place • 3 bedrooms
Note: Performance varies based on location, size, amenities, seasonality, and management quality. Data reflects the past 12 months.
Top Performing Airbnb Hosts in Virksund (2025)
Learn from the best! This table showcases top-performing Airbnb hosts in Virksund based on the number of properties managed and estimated total revenue over the past year. Analyze their scale and performance metrics.
| Host Name | Properties | Grossing Revenue | Stay Reviews | Avg Rating |
|---|---|---|---|---|
| Host #118498296 | 4 | $77,020 | 0 | 0.00/5.0 |
| Ida - DANCENTER | 8 | $71,027 | 23 | 2.56/5.0 |
| Host #118498500 | 2 | $28,837 | 1 | 0.00/5.0 |
| Host #150440142 | 1 | $21,536 | 0 | 0.00/5.0 |
| Host #101615600 | 1 | $14,255 | 0 | 0.00/5.0 |
| Host #274764446 | 1 | $12,929 | 0 | 0.00/5.0 |
| Søren | 1 | $11,943 | 58 | 4.76/5.0 |
| Gert Bonde | 1 | $6,551 | 107 | 4.39/5.0 |
| Gitte | 1 | $6,162 | 4 | 5.00/5.0 |
Analyzing the strategies of top hosts, such as their property selection, pricing, and guest communication, can offer valuable lessons for optimizing your own Airbnb operations in Virksund.
Dive Deeper: Advanced Virksund STR Market Data (2025)
Ready to unlock more insights? AirROI provides access to advanced metrics and comprehensive Airbnb data for Virksund. Explore detailed analytics beyond this report to refine your investment strategy, optimize pricing, and maximize your vacation rental profits.
Explore Advanced MetricsVirksund Short-Term Rental Market Composition (2025): Property & Room Types
Room Type Distribution
Property Type Distribution
Market Composition Insights for Virksund
- The Virksund Airbnb market composition is heavily skewed towards Entire Home/Apt listings, which make up 100% of the 20 active rentals. This indicates strong guest preference for privacy and space.
- Looking at the property type distribution in Virksund, House properties are the most common (100%), reflecting the local real estate landscape.
- Houses represent a significant 100% portion, catering likely to families or larger groups.
Virksund Airbnb Room Capacity Analysis (2025): Bedroom Distribution
Distribution of Listings by Number of Bedrooms
Room Capacity Insights for Virksund
- The dominant room capacity in Virksund is 2 bedrooms listings, making up 35% of the market. This suggests a strong demand for properties suitable for couples or solo travelers.
- Together, 2 bedrooms and 3 bedrooms properties represent 70.0% of the active Airbnb listings in Virksund, indicating a high concentration in these sizes.
- A significant 65.0% of listings offer 3+ bedrooms, catering to larger groups and families seeking more space in Virksund.
Virksund Vacation Rental Guest Capacity Trends (2025)
Distribution of Listings by Guest Capacity
Guest Capacity Insights for Virksund
- The most common guest capacity trend in Virksund vacation rentals is listings accommodating 8+ guests (40%). This suggests the primary traveler segment is likely larger groups.
- Properties designed for 8+ guests and 6 guests dominate the Virksund STR market, accounting for 65.0% of listings.
- 70.0% of properties accommodate 6+ guests, serving the market segment for larger families or group travel in Virksund.
- On average, properties in Virksund are equipped to host 6.4 guests.
Virksund Airbnb Booking Patterns (2025): Available vs. Booked Days
Available Days Distribution
Booked Days Distribution
Booking Pattern Insights for Virksund
- The most common availability pattern in Virksund falls within the 271-366 days range, representing 85% of listings. This suggests many properties have significant open periods on their calendars.
- Approximately 100.0% of listings show high availability (181+ days open annually), indicating potential for increased bookings or specific owner usage patterns.
- For booked days, the 31-90 days range is most frequent in Virksund (55%), reflecting common guest stay durations or potential owner blocking patterns.
Virksund Airbnb Minimum Stay Requirements Analysis
Distribution of Listings by Minimum Night Requirement
1 Night
12 listings
63.2% of total
2 Nights
1 listings
5.3% of total
30+ Nights
6 listings
31.6% of total
Key Insights
- The most prevalent minimum stay requirement in Virksund is 1 Night, adopted by 63.2% of listings. This highlights the market's preference for shorter, flexible bookings.
- A strong majority (68.5%) of the Virksund Airbnb data shows acceptance of very short stays (1-2 nights), indicating a dynamic, high-turnover market.
- A significant segment (31.6%) caters to monthly stays (30+ nights) in Virksund, pointing to opportunities in the extended-stay market.
Recommendations
- Align with the market by considering a 1 Night minimum stay, as 63.2% of Virksund hosts use this setting.
- Explore offering discounts for stays of 30+ nights to attract the 31.6% of the market seeking extended stays.
- Adjust minimum nights based on seasonality – potentially shorter during low season and longer during peak demand periods in Virksund.
Virksund Airbnb Cancellation Policy Trends Analysis (2025)
Flexible
2 listings
22.2% of total
Firm
7 listings
77.8% of total
Cancellation Policy Insights for Virksund
- The prevailing Airbnb cancellation policy trend in Virksund is Firm, used by 77.8% of listings.
- A majority (77.8%) of hosts in Virksund utilize Firm or Strict policies, indicating a market where hosts prioritize booking security.
Recommendations for Hosts
- Consider adopting a Firm policy to align with the 77.8% market standard in Virksund.
- Regularly review your cancellation policy against competitors and market demand shifts in Virksund.
Virksund STR Booking Lead Time Analysis (2025)
Average Booking Lead Time by Month
Booking Lead Time Insights for Virksund
- The overall average booking lead time for vacation rentals in Virksund is 60 days.
- Guests book furthest in advance for stays during August (average 114 days), likely coinciding with peak travel demand or local events.
- The shortest booking windows occur for stays in February (average 4 days), indicating more last-minute travel plans during this time.
- Seasonally, Summer (70 days avg.) sees the longest lead times, while Fall (36 days avg.) has the shortest, reflecting typical travel planning cycles.
Recommendations for Hosts
- Use the overall average lead time (60 days) as a baseline for your pricing and availability strategy in Virksund.
- For August stays, consider implementing length-of-stay discounts or slightly higher rates for bookings made less than 114 days out to capitalize on advance planning.
- During February, focus on last-minute booking availability and promotions, as guests book with very short notice (4 days avg.).
- Target marketing efforts for the Summer season well in advance (at least 70 days) to capture early planners.
- Monitor your own booking lead times against these Virksund averages to identify opportunities for dynamic pricing adjustments.
Popular & Essential Airbnb Amenities in Virksund (2025)
Amenity Prevalence
Amenity Insights for Virksund
- Essential amenities in Virksund that guests expect include: TV, Kitchen, Heating, Wifi, Hangers. Lacking these (any) could significantly impact bookings.
- Popular amenities like Private entrance, Dishwasher, Microwave are common but not universal. Offering these can provide a competitive edge.
Recommendations for Hosts
- Ensure your listing includes all essential amenities for Virksund: TV, Kitchen, Heating, Wifi, Hangers.
- Prioritize adding missing essentials: Heating, Wifi, Hangers.
- Consider adding popular differentiators like Private entrance or Dishwasher to increase appeal.
- Highlight unique or less common amenities you offer (e.g., hot tub, dedicated workspace, EV charger) in your listing description and photos.
- Regularly check competitor amenities in Virksund to stay competitive.
Virksund Airbnb Guest Demographics & Profile Analysis (2025)
Guest Profile Summary for Virksund
- The typical guest profile for Airbnb in Virksund consists of predominantly international visitors (83%), with top international origins including Netherlands, typically belonging to the Post-2000s (Gen Z/Alpha) group (50%), primarily speaking English or German.
- Domestic travelers account for 16.7% of guests.
- Key international markets include Germany (33.3%) and Netherlands (33.3%).
- Top languages spoken are English (44.4%) followed by German (33.3%).
- A significant demographic segment is the Post-2000s (Gen Z/Alpha) group, representing 50% of guests.
Recommendations for Hosts
- Focus marketing internationally, particularly towards travelers from Netherlands.
- Tailor amenities and listing descriptions to appeal to the dominant Post-2000s (Gen Z/Alpha) demographic (e.g., highlight fast WiFi, smart home features, local guides).
- Highlight unique local experiences or amenities relevant to the primary guest profile.
- Consider seasonal promotions aligned with peak travel times for key origin markets.
Nearby Short-Term Rental Market Comparison
How does the Virksund Airbnb market stack up against its neighbors? Compare key performance metrics like average monthly revenue, ADR, and occupancy rates in surrounding areas to understand the broader regional STR landscape.
| Market | Active Properties | Monthly Revenue | Daily Rate | Avg. Occupancy |
|---|---|---|---|---|
| Husum-Ballum | 17 | $4,072 | $473.27 | 40% |
| Lohals | 25 | $3,323 | $326.86 | 34% |
| Øster Knasborg | 16 | $2,567 | $453.29 | 31% |
| Aggersund | 10 | $2,567 | $251.93 | 23% |
| Blokhus | 85 | $2,518 | $317.49 | 30% |
| Skagen | 317 | $2,389 | $267.87 | 37% |
| Bønnerup | 38 | $2,385 | $309.69 | 31% |
| Lyngså | 10 | $2,371 | $274.32 | 39% |
| Løkken | 227 | $2,365 | $270.62 | 32% |
| Billund | 123 | $2,364 | $248.19 | 41% |