Assay Airbnb Market Analysis 2025: Short Term Rental Data & Vacation Rental Statistics in Centre-Val de Loire, France
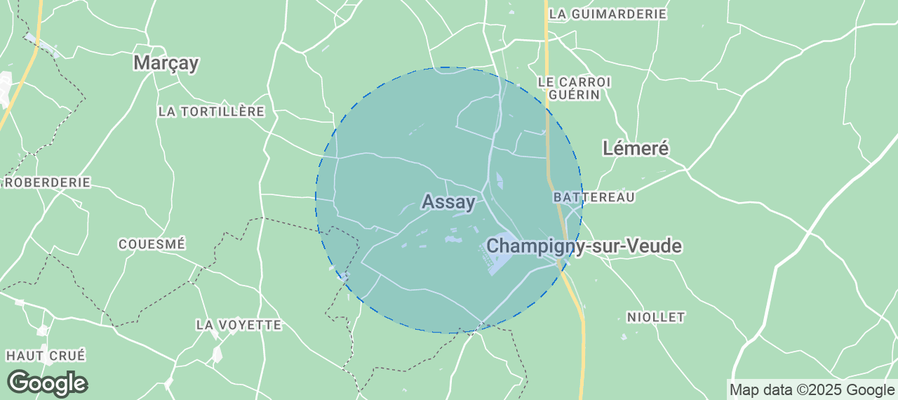
Is Airbnb profitable in Assay in 2025? Explore comprehensive Airbnb analytics for Assay, Centre-Val de Loire, France to uncover income potential. This 2025 STR market report for Assay, based on AirROI data from July 2024 to June 2025, reveals key trends in the niche market of 18 active listings.
Whether you're considering an Airbnb investment in Assay, optimizing your existing vacation rental, or exploring rental arbitrage opportunities, understanding the Assay Airbnb data is crucial. Leveraging the low regulation environment is key to maximizing your short term rental income potential. Let's dive into the specifics.
Key Assay Airbnb Performance Metrics Overview
Monthly Airbnb Revenue Variations & Income Potential in Assay (2025)
Understanding the monthly revenue variations for Airbnb listings in Assay is key to maximizing your short term rental income potential. Seasonality significantly impacts earnings. Our analysis, based on data from the past 12 months, shows that the peak revenue month for STRs in Assay is typically August, while February often presents the lowest earnings, highlighting opportunities for strategic pricing adjustments during shoulder and low seasons. Explore the typical Airbnb income in Assay across different performance tiers:
- Best-in-class properties (Top 10%) achieve $4,097+ monthly, often utilizing dynamic pricing and superior guest experiences.
- Strong performing properties (Top 25%) earn $3,073 or more, indicating effective management and desirable locations/amenities.
- Typical properties (Median) generate around $1,649 per month, representing the average market performance.
- Entry-level properties (Bottom 25%) see earnings around $887, often with potential for optimization.
Average Monthly Airbnb Earnings Trend in Assay
Assay Airbnb Occupancy Rate Trends (2025)
Maximize your bookings by understanding the Assay STR occupancy trends. Seasonal demand shifts significantly influence how often properties are booked. Typically, Augustsees the highest demand (peak season occupancy), while February experiences the lowest (low season). Effective strategies, like adjusting minimum stays or offering promotions, can boost occupancy during slower periods. Here's how different property tiers perform in Assay:
- Best-in-class properties (Top 10%) achieve 63%+ occupancy, indicating high desirability and potentially optimized availability.
- Strong performing properties (Top 25%) maintain 46% or higher occupancy, suggesting good market fit and guest satisfaction.
- Typical properties (Median) have an occupancy rate around 29%.
- Entry-level properties (Bottom 25%) average 17% occupancy, potentially facing higher vacancy.
Average Monthly Occupancy Rate Trend in Assay
Average Daily Rate (ADR) Airbnb Trends in Assay (2025)
Effective short term rental pricing strategy in Assay involves understanding monthly ADR fluctuations. The Average Daily Rate (ADR) for Airbnb in Assay typically peaks in June and dips lowest during February. Leveraging Airbnb dynamic pricing tools or strategies based on this seasonality can significantly boost revenue. Here's a look at the typical nightly rates achieved:
- Best-in-class properties (Top 10%) command rates of $341+ per night, often due to premium features or locations.
- Strong performing properties (Top 25%) achieve nightly rates of $259 or more.
- Typical properties (Median) charge around $169 per night.
- Entry-level properties (Bottom 25%) earn around $119 per night.
Average Daily Rate (ADR) Trend by Month in Assay
Get Live Assay Market Intelligence 👇
Explore Real-time Analytics
Airbnb Seasonality Analysis & Trends in Assay (2025)
Peak Season (August, April, May)
- Revenue averages $2,776 per month
- Occupancy rates average 40.5%
- Daily rates average $203
Shoulder Season
- Revenue averages $2,404 per month
- Occupancy maintains around 35.5%
- Daily rates hold near $201
Low Season (January, February, March)
- Revenue drops to average $1,086 per month
- Occupancy decreases to average 20.8%
- Daily rates adjust to average $193
Seasonality Insights for Assay
- The Airbnb seasonality in Assay shows highly seasonal trends requiring careful strategy. While the sections above show seasonal averages, it's also insightful to look at the extremes:
- During the high season, the absolute peak month showcases Assay's highest earning potential, with monthly revenues capable of climbing to $3,058, occupancy reaching a high of 43.2%, and ADRs peaking at $210.
- Conversely, the slowest single month of the year, typically falling within the low season, marks the market's lowest point. In this month, revenue might dip to $892, occupancy could drop to 16.7%, and ADRs may adjust down to $192.
- Understanding both the seasonal averages and these monthly peaks and troughs in revenue, occupancy, and ADR is crucial for maximizing your Airbnb profit potential in Assay.
Seasonal Strategies for Maximizing Profit
- Peak Season: Maximize revenue through premium pricing and potentially longer minimum stays. Ensure high availability.
- Low Season: Offer competitive pricing, special promotions (e.g., extended stay discounts), and flexible cancellation policies. Target off-season travelers like remote workers or budget-conscious guests.
- Shoulder Seasons: Implement dynamic pricing that balances peak and low rates. Target weekend travelers or specific events. Offer slightly more flexible terms than peak season.
- Regularly analyze your own performance against these Assay seasonality benchmarks and adjust your pricing and availability strategy accordingly.
Best Areas for Airbnb Investment in Assay (2025)
Exploring the top neighborhoods for short-term rentals in Assay? This section highlights key areas, outlining why they are attractive for hosts and guests, along with notable local attractions. Consider these locations based on your target guest profile and investment strategy.
| Neighborhood / Area | Why Host Here? (Target Guests & Appeal) | Key Attractions & Landmarks |
|---|---|---|
| Bourges | Capital of the Berry region with a rich history, Bourges is known for its stunning cathedral and medieval architecture. A prime location for those interested in culture and history. | Bourges Cathedral, Palais Jacques-Coeur, Marais de Bourges, Les Nuits Lumière, Castles of the Loire |
| Châteauroux | The capital of Indre department, Châteauroux offers a mix of historical sites and modern amenities. It’s an attractive option for families and business travelers alike. | Saint-Christophe Cathedral, Maurice Gontard Park, The Museum of France, Château Raoul, Châteauroux's Markets |
| Sancerre | Famous for its wine, Sancerre attracts tourists looking to explore vineyards and enjoy picturesque views of the Loire valley. A quaint, rural escape. | Sancerre Vineyards, The Sancerre Museum, Caves de la Molière, Panoramic Viewpoint, La Maison des Sancerre |
| Saint-Aignan | Home to the famous Zoo Parc de Beauval, Saint-Aignan is a popular spot for families and animal lovers. Its proximity to the zoo makes it a key area for overnight stays. | Zoo de Beauval, Château de Saint-Aignan, Domaine de la Chervine, Local Vineyards, La Loire à Vélo |
| Amboise | Known for its beautiful chateau, Amboise is a picturesque town along the Loire River that attracts tourists seeking history and art, making it a great Airbnb location. | Château d'Amboise, Clos Lucé, The Loire River, Local Farmers' Markets, Amboise's Historic Centre |
| Blois | Blois is a charming town with a rich history and a great location along the Loire. It’s known for its beautiful castle and is located in the heart of the Loire Valley. | Château de Blois, Maison de la Magie, Blois Historical Center, St.Louis Cathedral, Loire Valley Cycling Routes |
| La Châtre | A smaller town with a vibrant art scene, La Châtre is a peaceful escape for those looking for relaxation and a local experience outside major tourist areas. | George Sand House, Brenne Regional Natural Park, Local Art Galleries, Markets, Traditional Festivals |
| Saint-Florent-sur-Cher | This small commune offers a charming rural experience and access to nature, ideal for those looking to escape the city and enjoy outdoor activities. | Cher River, Local Nature Trails, Historic Churches, Traditional French Countryside, Outdoor Markets |
Understanding Airbnb License Requirements & STR Laws in Assay (2025)
While Assay, Centre-Val de Loire, France currently shows low STR regulations, specific Airbnb license requirements might still exist or change. Always verify the latest short term rental regulations and Airbnb license requirements directly with local government authorities for Assay to ensure full compliance before hosting.
(Source: AirROI data, 2025, finding no licensed listings among those analyzed)
Top Performing Airbnb Properties in Assay (2025)
Benchmark your potential! Explore examples of top-performing Airbnb properties in Assaybased on Trailing Twelve Month (TTM) revenue. Analyze their characteristics, revenue, occupancy rate, and ADR to understand what drives success in this market.

Nature cottage, Loire Valley castles in the countryside
Entire Place • 5 bedrooms

Year-round one bedroom cottage
Entire Place • 1 bedroom

Douceur Tourangelle Heated indoor pool
Entire Place • 4 bedrooms

Loire Valley year-round country loft near Chinon
Entire Place • 1 bedroom

Loire Valley 17th century gatehouse near Chinon
Entire Place • 2 bedrooms

Gîte de la prairie
Entire Place • 2 bedrooms
Note: Performance varies based on location, size, amenities, seasonality, and management quality. Data reflects the past 12 months.
Top Performing Airbnb Hosts in Assay (2025)
Learn from the best! This table showcases top-performing Airbnb hosts in Assay based on the number of properties managed and estimated total revenue over the past year. Analyze their scale and performance metrics.
| Host Name | Properties | Grossing Revenue | Stay Reviews | Avg Rating |
|---|---|---|---|---|
| Jeff | 5 | $135,560 | 331 | 4.96/5.0 |
| Robert | 3 | $70,873 | 61 | 4.99/5.0 |
| Lionel | 1 | $35,457 | 6 | 5.00/5.0 |
| Stephane Et Anne | 1 | $30,877 | 95 | 4.99/5.0 |
| Sonia | 1 | $13,043 | 9 | 4.89/5.0 |
| Séraphine | 2 | $7,378 | 5 | 5.00/5.0 |
| Christophe | 1 | $5,750 | 8 | 5.00/5.0 |
| Michel | 2 | $4,557 | 37 | 4.86/5.0 |
| Michel | 1 | $2,461 | 2 | Not Rated |
| Novasol | 1 | $287 | 1 | Not Rated |
Analyzing the strategies of top hosts, such as their property selection, pricing, and guest communication, can offer valuable lessons for optimizing your own Airbnb operations in Assay.
Dive Deeper: Advanced Assay STR Market Data (2025)
Ready to unlock more insights? AirROI provides access to advanced metrics and comprehensive Airbnb data for Assay. Explore detailed analytics beyond this report to refine your investment strategy, optimize pricing, and maximize your vacation rental profits.
Explore Advanced MetricsAssay Short-Term Rental Market Composition (2025): Property & Room Types
Room Type Distribution
Property Type Distribution
Market Composition Insights for Assay
- The Assay Airbnb market composition is heavily skewed towards Entire Home/Apt listings, which make up 94.4% of the 18 active rentals. This indicates strong guest preference for privacy and space.
- Looking at the property type distribution in Assay, House properties are the most common (83.3%), reflecting the local real estate landscape.
- Houses represent a significant 83.3% portion, catering likely to families or larger groups.
Assay Airbnb Room Capacity Analysis (2025): Bedroom Distribution
Distribution of Listings by Number of Bedrooms
Room Capacity Insights for Assay
- The dominant room capacity in Assay is 2 bedrooms listings, making up 44.4% of the market. This suggests a strong demand for properties suitable for couples or solo travelers.
- Together, 2 bedrooms and 1 bedroom properties represent 72.2% of the active Airbnb listings in Assay, indicating a high concentration in these sizes.
- A significant 22.3% of listings offer 3+ bedrooms, catering to larger groups and families seeking more space in Assay.
Assay Vacation Rental Guest Capacity Trends (2025)
Distribution of Listings by Guest Capacity
Guest Capacity Insights for Assay
- The most common guest capacity trend in Assay vacation rentals is listings accommodating 8+ guests (16.7%). This suggests the primary traveler segment is likely larger groups.
- Properties designed for 8+ guests and 2 guests dominate the Assay STR market, accounting for 33.4% of listings.
- 38.9% of properties accommodate 6+ guests, serving the market segment for larger families or group travel in Assay.
- On average, properties in Assay are equipped to host 4.8 guests.
Assay Airbnb Booking Patterns (2025): Available vs. Booked Days
Available Days Distribution
Booked Days Distribution
Booking Pattern Insights for Assay
- The most common availability pattern in Assay falls within the 271-366 days range, representing 61.1% of listings. This suggests many properties have significant open periods on their calendars.
- Approximately 94.4% of listings show high availability (181+ days open annually), indicating potential for increased bookings or specific owner usage patterns.
- For booked days, the 91-180 days range is most frequent in Assay (33.3%), reflecting common guest stay durations or potential owner blocking patterns.
- A notable 11.1% of properties secure long booking periods (181+ days booked per year), highlighting successful long-term rental strategies or significant owner usage.
Assay Airbnb Minimum Stay Requirements Analysis
Distribution of Listings by Minimum Night Requirement
1 Night
1 listings
6.3% of total
2 Nights
6 listings
37.5% of total
7-29 Nights
2 listings
12.5% of total
30+ Nights
7 listings
43.8% of total
Key Insights
- The most prevalent minimum stay requirement in Assay is 30+ Nights, adopted by 43.8% of listings. This highlights the market's preference for longer commitments.
- A significant segment (43.8%) caters to monthly stays (30+ nights) in Assay, pointing to opportunities in the extended-stay market.
Recommendations
- Align with the market by considering a 30+ Nights minimum stay, as 43.8% of Assay hosts use this setting.
- If feasible, allowing 1-night stays, especially midweek or during low season, could capture last-minute bookings, as only 6.3% currently do.
- A 2-night minimum appears standard (37.5%). Consider this for weekends or peak periods.
- Explore offering discounts for stays of 30+ nights to attract the 43.8% of the market seeking extended stays.
- Adjust minimum nights based on seasonality – potentially shorter during low season and longer during peak demand periods in Assay.
Assay Airbnb Cancellation Policy Trends Analysis (2025)
Super Strict 60 Days
1 listings
5.6% of total
Flexible
6 listings
33.3% of total
Moderate
1 listings
5.6% of total
Firm
5 listings
27.8% of total
Strict
5 listings
27.8% of total
Cancellation Policy Insights for Assay
- The prevailing Airbnb cancellation policy trend in Assay is Flexible, used by 33.3% of listings.
- A majority (55.6%) of hosts in Assay utilize Firm or Strict policies, indicating a market where hosts prioritize booking security.
Recommendations for Hosts
- Consider adopting a Flexible policy to align with the 33.3% market standard in Assay.
- Regularly review your cancellation policy against competitors and market demand shifts in Assay.
Assay STR Booking Lead Time Analysis (2025)
Average Booking Lead Time by Month
Booking Lead Time Insights for Assay
- The overall average booking lead time for vacation rentals in Assay is 48 days.
- Guests book furthest in advance for stays during May (average 101 days), likely coinciding with peak travel demand or local events.
- The shortest booking windows occur for stays in January (average 29 days), indicating more last-minute travel plans during this time.
- Seasonally, Spring (77 days avg.) sees the longest lead times, while Winter (41 days avg.) has the shortest, reflecting typical travel planning cycles.
Recommendations for Hosts
- Use the overall average lead time (48 days) as a baseline for your pricing and availability strategy in Assay.
- For May stays, consider implementing length-of-stay discounts or slightly higher rates for bookings made less than 101 days out to capitalize on advance planning.
- Target marketing efforts for the Spring season well in advance (at least 77 days) to capture early planners.
- Monitor your own booking lead times against these Assay averages to identify opportunities for dynamic pricing adjustments.
Popular & Essential Airbnb Amenities in Assay (2025)
Amenity data is currently unavailable for Assay.
Assay Airbnb Guest Demographics & Profile Analysis (2025)
Guest Profile Summary for Assay
- The typical guest profile for Airbnb in Assay consists of a mix of domestic (48%) and international guests, with top international origins including United Kingdom, typically belonging to the Post-2000s (Gen Z/Alpha) group (50%), primarily speaking English or French.
- Domestic travelers account for 47.8% of guests.
- Key international markets include France (47.8%) and United Kingdom (21.7%).
- Top languages spoken are English (43.2%) followed by French (38.6%).
- A significant demographic segment is the Post-2000s (Gen Z/Alpha) group, representing 50% of guests.
Recommendations for Hosts
- Balance marketing efforts between domestic and international channels based on the guest mix.
- Tailor amenities and listing descriptions to appeal to the dominant Post-2000s (Gen Z/Alpha) demographic (e.g., highlight fast WiFi, smart home features, local guides).
- Highlight unique local experiences or amenities relevant to the primary guest profile.
- Consider seasonal promotions aligned with peak travel times for key origin markets.
Nearby Short-Term Rental Market Comparison
How does the Assay Airbnb market stack up against its neighbors? Compare key performance metrics like average monthly revenue, ADR, and occupancy rates in surrounding areas to understand the broader regional STR landscape.
| Market | Active Properties | Monthly Revenue | Daily Rate | Avg. Occupancy |
|---|---|---|---|---|
| La Couture-Boussey | 11 | $3,981 | $426.23 | 31% |
| Thilouze | 10 | $3,574 | $308.45 | 55% |
| Saint-Rémy-l'Honoré | 13 | $3,413 | $262.31 | 41% |
| Mesnils-sur-Iton | 24 | $3,222 | $343.62 | 41% |
| Millançay | 12 | $3,035 | $347.68 | 35% |
| Coteaux-sur-Loire | 20 | $2,966 | $274.28 | 39% |
| Artannes-sur-Indre | 24 | $2,878 | $329.70 | 39% |
| Montrieux-en-Sologne | 13 | $2,718 | $411.51 | 31% |
| Bourneau | 11 | $2,704 | $445.15 | 32% |
| Tourouvre au Perche | 30 | $2,703 | $241.27 | 39% |