Bhattakufer Airbnb Market Analysis 2025: Short Term Rental Data & Vacation Rental Statistics in Himachal Pradesh, India
Is Airbnb profitable in Bhattakufer in 2025? Explore comprehensive Airbnb analytics for Bhattakufer, Himachal Pradesh, India to uncover income potential. This 2025 STR market report for Bhattakufer, based on AirROI data from May 2024 to April 2025, reveals key trends in the niche market of 20 active listings.
Whether you're considering an Airbnb investment in Bhattakufer, optimizing your existing vacation rental, or exploring rental arbitrage opportunities, understanding the Bhattakufer Airbnb data is crucial. Leveraging the low regulation environment is key to maximizing your short term rental income potential. Let's dive into the specifics.
Key Bhattakufer Airbnb Performance Metrics Overview
Monthly Airbnb Revenue Variations & Income Potential in Bhattakufer (2025)
Understanding the monthly revenue variations for Airbnb listings in Bhattakufer is key to maximizing your short term rental income potential. Seasonality significantly impacts earnings. Our analysis, based on data from the past 12 months, shows that the peak revenue month for STRs in Bhattakufer is typically August, while December often presents the lowest earnings, highlighting opportunities for strategic pricing adjustments during shoulder and low seasons. Explore the typical Airbnb income in Bhattakufer across different performance tiers:
- Best-in-class properties (Top 10%) achieve $6,362+ monthly, often utilizing dynamic pricing and superior guest experiences.
- Strong performing properties (Top 25%) earn $1,706 or more, indicating effective management and desirable locations/amenities.
- Typical properties (Median) generate around $583 per month, representing the average market performance.
- Entry-level properties (Bottom 25%) see earnings around $248, often with potential for optimization.
Average Monthly Airbnb Earnings Trend in Bhattakufer
Bhattakufer Airbnb Occupancy Rate Trends (2025)
Maximize your bookings by understanding the Bhattakufer STR occupancy trends. Seasonal demand shifts significantly influence how often properties are booked. Typically, Novembersees the highest demand (peak season occupancy), while June experiences the lowest (low season). Effective strategies, like adjusting minimum stays or offering promotions, can boost occupancy during slower periods. Here's how different property tiers perform in Bhattakufer:
- Best-in-class properties (Top 10%) achieve 44%+ occupancy, indicating high desirability and potentially optimized availability.
- Strong performing properties (Top 25%) maintain 39% or higher occupancy, suggesting good market fit and guest satisfaction.
- Typical properties (Median) have an occupancy rate around 29%.
- Entry-level properties (Bottom 25%) average 20% occupancy, potentially facing higher vacancy.
Average Monthly Occupancy Rate Trend in Bhattakufer
Average Daily Rate (ADR) Airbnb Trends in Bhattakufer (2025)
Effective short term rental pricing strategy in Bhattakufer involves understanding monthly ADR fluctuations. The Average Daily Rate (ADR) for Airbnb in Bhattakufer typically peaks in April and dips lowest during December. Leveraging Airbnb dynamic pricing tools or strategies based on this seasonality can significantly boost revenue. Here's a look at the typical nightly rates achieved:
- Best-in-class properties (Top 10%) command rates of $100+ per night, often due to premium features or locations.
- Strong performing properties (Top 25%) achieve nightly rates of $62 or more.
- Typical properties (Median) charge around $41 per night.
- Entry-level properties (Bottom 25%) earn around $22 per night.
Average Daily Rate (ADR) Trend by Month in Bhattakufer
Get Live Bhattakufer Market Intelligence 👇
Explore Real-time Analytics
Airbnb Seasonality Analysis & Trends in Bhattakufer (2025)
Peak Season (August, September, October)
- Revenue averages $2,940 per month
- Occupancy rates average 38.9%
- Daily rates average $53
Shoulder Season
- Revenue averages $1,978 per month
- Occupancy maintains around 25.7%
- Daily rates hold near $58
Low Season (April, July, December)
- Revenue drops to average $895 per month
- Occupancy decreases to average 29.5%
- Daily rates adjust to average $56
Seasonality Insights for Bhattakufer
- The Airbnb seasonality in Bhattakufer shows highly seasonal trends requiring careful strategy. While the sections above show seasonal averages, it's also insightful to look at the extremes:
- During the high season, the absolute peak month showcases Bhattakufer's highest earning potential, with monthly revenues capable of climbing to $3,196, occupancy reaching a high of 68.0%, and ADRs peaking at $63.
- Conversely, the slowest single month of the year, typically falling within the low season, marks the market's lowest point. In this month, revenue might dip to $255, occupancy could drop to 3.3%, and ADRs may adjust down to $49.
- Understanding both the seasonal averages and these monthly peaks and troughs in revenue, occupancy, and ADR is crucial for maximizing your Airbnb profit potential in Bhattakufer.
Seasonal Strategies for Maximizing Profit
- Peak Season: Maximize revenue through premium pricing and potentially longer minimum stays. Ensure high availability.
- Low Season: Offer competitive pricing, special promotions (e.g., extended stay discounts), and flexible cancellation policies. Target off-season travelers like remote workers or budget-conscious guests.
- Shoulder Seasons: Implement dynamic pricing that balances peak and low rates. Target weekend travelers or specific events. Offer slightly more flexible terms than peak season.
- Regularly analyze your own performance against these Bhattakufer seasonality benchmarks and adjust your pricing and availability strategy accordingly.
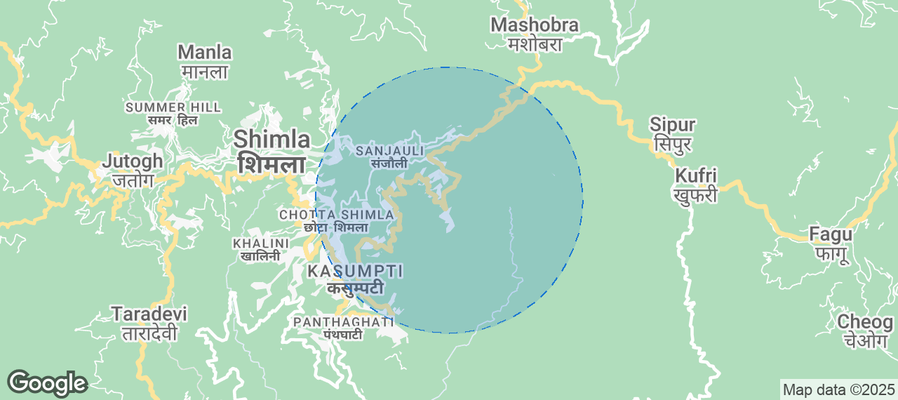
Best Areas for Airbnb Investment in Bhattakufer (2025)
Exploring the top neighborhoods for short-term rentals in Bhattakufer? This section highlights key areas, outlining why they are attractive for hosts and guests, along with notable local attractions. Consider these locations based on your target guest profile and investment strategy.
| Neighborhood / Area | Why Host Here? (Target Guests & Appeal) | Key Attractions & Landmarks |
|---|---|---|
| Mashobra | A serene hill station near Shimla, known for its lush greenery and scenic views. Perfect for tourists looking for a peaceful retreat in nature. | Mashobra Estate, Himalayan Nature Park, Kufri, Scandal Point, Tara Devi Temple |
| Kufri | Famous for its snow activities and panoramic vistas, Kufri attracts tourists year-round for skiing in winter and hiking in summer. | Kufri Fun World, Mahasu Peak, Himalayan Nature Park, Fagu, Horse Riding |
| Summer Hill | A quiet residential area in Shimla known for its universities and beautiful scenery, appealing to students and families alike. | Summer Hill Railway Station, Himachal Pradesh University, Nature walks, Scenic views of Shimla |
| Chail | Known for its stunning landscapes and the highest cricket ground in the world, this area offers a unique experience for tourists. | Chail Palace, Kali Ka Tibba, Chail Wildlife Sanctuary, Highest Cricket Ground |
| Naldehra | Renowned for its golf course and picturesque hills, Naldehra is a tranquil getaway from the hustle of city life. | Naldehra Golf Course, Naldehra Temple, Scenic nature views, Trekking trails |
| Junga | A lesser-known destination that offers a mix of adventure and serenity, popular among locals and some travelers looking for solace. | Junga Fort, Temples, Trekking routes, Natural beauty |
| Hatu Peak | Famous for its trekking trails and magnificent views, it attracts adventure enthusiasts and nature lovers. | Hatu Peak Trek, Hatu Temple, Scenic views of the valley, Natural beauty |
| Fagu | With apple orchards and tranquil surroundings, Fagu offers a picturesque setting for relaxation and exploration of nature. | Apple Orchards, Fagu Lake, Adventure activities, Local culture |
Understanding Airbnb License Requirements & STR Laws in Bhattakufer (2025)
While Bhattakufer, Himachal Pradesh, India currently shows low STR regulations, specific Airbnb license requirements might still exist or change. Always verify the latest short term rental regulations and Airbnb license requirements directly with local government authorities for Bhattakufer to ensure full compliance before hosting.
(Source: AirROI data, 2025, finding no licensed listings among those analyzed)
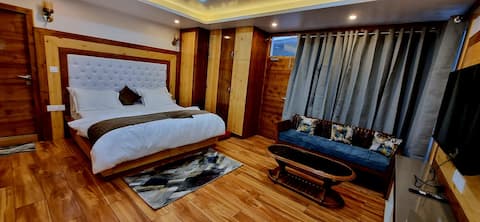
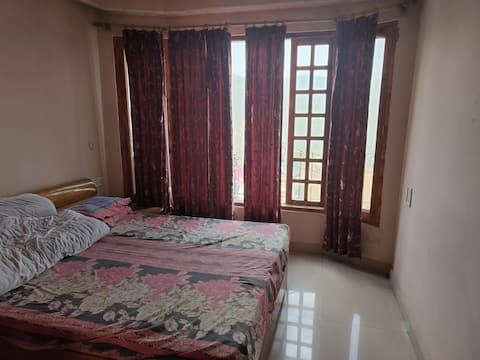
Top Performing Airbnb Properties in Bhattakufer (2025)
Benchmark your potential! Explore examples of top-performing Airbnb properties in Bhattakuferbased on Trailing Twelve Month (TTM) revenue. Analyze their characteristics, revenue, occupancy rate, and ADR to understand what drives success in this market.
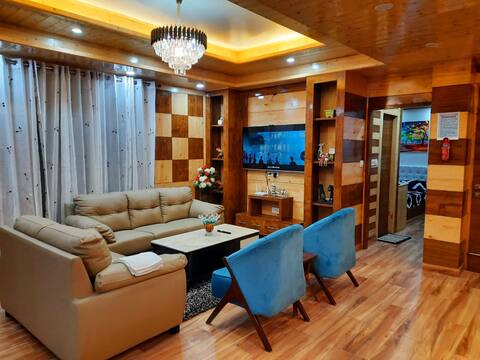
It's all in details !
Entire Place • 3 bedrooms

Jkvillashimla In pine forest
Entire Place • 2 bedrooms
Hilltop heaven
Entire Place • 2 bedrooms
CleanRoom with balcony &parking
Private Room • 1 bedroom
Family suite. 28
Entire Place • 3 bedrooms

Family suite 06
Entire Place • 3 bedrooms
Note: Performance varies based on location, size, amenities, seasonality, and management quality. Data reflects the past 12 months.
Top Performing Airbnb Hosts in Bhattakufer (2025)
Learn from the best! This table showcases top-performing Airbnb hosts in Bhattakufer based on the number of properties managed and estimated total revenue over the past year. Analyze their scale and performance metrics.
| Host Name | Properties | Grossing Revenue | Stay Reviews | Avg Rating |
|---|---|---|---|---|
| Host #312191858 | 7 | $18,376 | 0 | 0.00/5.0 |
| Host #492238743 | 2 | $18,104 | 0 | 0.00/5.0 |
| Host #164923000 | 1 | $7,433 | 0 | 0.00/5.0 |
| Host #305587457 | 1 | $5,398 | 0 | 0.00/5.0 |
| Host #39514105 | 1 | $3,867 | 0 | 0.00/5.0 |
| Host #437969769 | 1 | $3,201 | 0 | 0.00/5.0 |
| Host #453288030 | 1 | $2,987 | 0 | 0.00/5.0 |
| Abhinav | 1 | $2,892 | 32 | 4.72/5.0 |
| Host #498390187 | 1 | $2,210 | 0 | 0.00/5.0 |
| Host #386190431 | 1 | $838 | 1 | 0.00/5.0 |
Analyzing the strategies of top hosts, such as their property selection, pricing, and guest communication, can offer valuable lessons for optimizing your own Airbnb operations in Bhattakufer.
Dive Deeper: Advanced Bhattakufer STR Market Data (2025)
Ready to unlock more insights? AirROI provides access to advanced metrics and comprehensive Airbnb data for Bhattakufer. Explore detailed analytics beyond this report to refine your investment strategy, optimize pricing, and maximize your vacation rental profits.
Explore Advanced MetricsBhattakufer Short-Term Rental Market Composition (2025): Property & Room Types
Room Type Distribution
Property Type Distribution
Market Composition Insights for Bhattakufer
- The Bhattakufer Airbnb market composition is heavily skewed towards Entire Home/Apt listings, which make up 55% of the 20 active rentals. This indicates strong guest preference for privacy and space.
- However, a notable 45% share for Private Rooms suggests opportunities for budget-conscious travelers or hosts renting out spare rooms.
- Looking at the property type distribution in Bhattakufer, Apartment/Condo properties are the most common (65%), reflecting the local real estate landscape.
- The presence of 35% Hotel/Boutique listings indicates integration with traditional hospitality.
Bhattakufer Airbnb Room Capacity Analysis (2025): Bedroom Distribution
Distribution of Listings by Number of Bedrooms
Room Capacity Insights for Bhattakufer
- The dominant room capacity in Bhattakufer is 1 bedroom listings, making up 40% of the market. This suggests a strong demand for properties suitable for couples or solo travelers.
- Together, 1 bedroom and 2 bedrooms properties represent 75.0% of the active Airbnb listings in Bhattakufer, indicating a high concentration in these sizes.
- A significant 25.0% of listings offer 3+ bedrooms, catering to larger groups and families seeking more space in Bhattakufer.
Bhattakufer Vacation Rental Guest Capacity Trends (2025)
Distribution of Listings by Guest Capacity
Guest Capacity Insights for Bhattakufer
- The most common guest capacity trend in Bhattakufer vacation rentals is listings accommodating 8+ guests (30%). This suggests the primary traveler segment is likely larger groups.
- Properties designed for 8+ guests and 2 guests dominate the Bhattakufer STR market, accounting for 60.0% of listings.
- 40.0% of properties accommodate 6+ guests, serving the market segment for larger families or group travel in Bhattakufer.
- On average, properties in Bhattakufer are equipped to host 4.8 guests.
Bhattakufer Airbnb Booking Patterns (2025): Available vs. Booked Days
Available Days Distribution
Booked Days Distribution
Booking Pattern Insights for Bhattakufer
- The most common availability pattern in Bhattakufer falls within the 271-366 days range, representing 90% of listings. This suggests many properties have significant open periods on their calendars.
- Approximately 100.0% of listings show high availability (181+ days open annually), indicating potential for increased bookings or specific owner usage patterns.
- For booked days, the 31-90 days range is most frequent in Bhattakufer (85%), reflecting common guest stay durations or potential owner blocking patterns.
Bhattakufer Airbnb Minimum Stay Requirements Analysis
Distribution of Listings by Minimum Night Requirement
1 Night
17 listings
94.4% of total
2 Nights
1 listings
5.6% of total
Key Insights
- The most prevalent minimum stay requirement in Bhattakufer is 1 Night, adopted by 94.4% of listings. This highlights the market's preference for shorter, flexible bookings.
- A strong majority (100.0%) of the Bhattakufer Airbnb data shows acceptance of very short stays (1-2 nights), indicating a dynamic, high-turnover market.
Recommendations
- Align with the market by considering a 1 Night minimum stay, as 94.4% of Bhattakufer hosts use this setting.
- Adjust minimum nights based on seasonality – potentially shorter during low season and longer during peak demand periods in Bhattakufer.
Bhattakufer Airbnb Cancellation Policy Trends Analysis (2025)
Flexible
1 listings
33.3% of total
Moderate
1 listings
33.3% of total
Strict
1 listings
33.3% of total
Cancellation Policy Insights for Bhattakufer
- The prevailing Airbnb cancellation policy trend in Bhattakufer is Flexible, used by 33.3% of listings.
- There's a relatively balanced mix between guest-friendly (66.6%) and stricter (33.3%) policies, offering choices for different guest needs.
Recommendations for Hosts
- Consider adopting a Flexible policy to align with the 33.3% market standard in Bhattakufer.
- With 33.3% using Strict terms, this is a viable option in Bhattakufer, particularly for high-value properties or during peak demand periods.
- Regularly review your cancellation policy against competitors and market demand shifts in Bhattakufer.
Bhattakufer STR Booking Lead Time Analysis (2025)
Average Booking Lead Time by Month
Booking Lead Time Insights for Bhattakufer
- The overall average booking lead time for vacation rentals in Bhattakufer is 10 days.
- Guests book furthest in advance for stays during April (average 22 days), likely coinciding with peak travel demand or local events.
- The shortest booking windows occur for stays in June (average 0 days), indicating more last-minute travel plans during this time.
- Seasonally, Fall (14 days avg.) sees the longest lead times, while Summer (2 days avg.) has the shortest, reflecting typical travel planning cycles.
Recommendations for Hosts
- Use the overall average lead time (10 days) as a baseline for your pricing and availability strategy in Bhattakufer.
- For April stays, consider implementing length-of-stay discounts or slightly higher rates for bookings made less than 22 days out to capitalize on advance planning.
- During June, focus on last-minute booking availability and promotions, as guests book with very short notice (0 days avg.).
- Target marketing efforts for the Fall season well in advance (at least 14 days) to capture early planners.
- Monitor your own booking lead times against these Bhattakufer averages to identify opportunities for dynamic pricing adjustments.
Popular & Essential Airbnb Amenities in Bhattakufer (2025)
Amenity Prevalence
Amenity Insights for Bhattakufer
- Essential amenities in Bhattakufer that guests expect include: Hot water, Kitchen, Essentials, Washer, Wifi. Lacking these (any) could significantly impact bookings.
- Popular amenities like TV, Heating, Carbon monoxide alarm are common but not universal. Offering these can provide a competitive edge.
Recommendations for Hosts
- Ensure your listing includes all essential amenities for Bhattakufer: Hot water, Kitchen, Essentials, Washer, Wifi.
- Prioritize adding missing essentials: Essentials, Washer, Wifi.
- Consider adding popular differentiators like TV or Heating to increase appeal.
- Highlight unique or less common amenities you offer (e.g., hot tub, dedicated workspace, EV charger) in your listing description and photos.
- Regularly check competitor amenities in Bhattakufer to stay competitive.
Bhattakufer Airbnb Guest Demographics & Profile Analysis (2025)
Guest Profile Summary for Bhattakufer
- The typical guest profile for Airbnb in Bhattakufer consists of primarily domestic travelers (75%), often arriving from nearby New Delhi, typically belonging to the Post-2000s (Gen Z/Alpha) group (50%), primarily speaking English or Hindi.
- Domestic travelers account for 75.0% of guests.
- Key international markets include India (75%) and United States (18.8%).
- Top languages spoken are English (34.8%) followed by Hindi (30.4%).
- A significant demographic segment is the Post-2000s (Gen Z/Alpha) group, representing 50% of guests.
Recommendations for Hosts
- Target domestic marketing efforts towards travelers from New Delhi and Seattle.
- Tailor amenities and listing descriptions to appeal to the dominant Post-2000s (Gen Z/Alpha) demographic (e.g., highlight fast WiFi, smart home features, local guides).
- Highlight unique local experiences or amenities relevant to the primary guest profile.
- Consider seasonal promotions aligned with peak travel times for key origin markets.
Nearby Short-Term Rental Market Comparison
How does the Bhattakufer Airbnb market stack up against its neighbors? Compare key performance metrics like average monthly revenue, ADR, and occupancy rates in surrounding areas to understand the broader regional STR landscape.
| Market | Active Properties | Monthly Revenue | Daily Rate | Avg. Occupancy |
|---|---|---|---|---|
| Mashobra | 10 | $2,944 | $319.94 | 22% |
| barlowganj | 26 | $1,577 | $184.51 | 26% |
| Maiti | 19 | $1,518 | $315.25 | 22% |
| Parwanoo | 59 | $1,497 | $233.48 | 22% |
| Dharampur | 101 | $1,286 | $169.82 | 20% |
| Garkhal | 92 | $1,262 | $217.05 | 19% |
| punkalgaon | 46 | $1,107 | $132.67 | 22% |
| Kasauli | 108 | $1,106 | $204.40 | 20% |
| bhatta | 85 | $1,087 | $120.00 | 29% |
| Jabarkhet | 34 | $1,079 | $125.95 | 29% |