District of Itauguá Airbnb Market Analysis 2025: Short Term Rental Data & Vacation Rental Statistics in Central Department, Paraguay
Is Airbnb profitable in District of Itauguá in 2025? Explore comprehensive Airbnb analytics for District of Itauguá, Central Department, Paraguay to uncover income potential. This 2025 STR market report for District of Itauguá, based on AirROI data from May 2024 to April 2025, reveals key trends in the niche market of 18 active listings.
Whether you're considering an Airbnb investment in District of Itauguá, optimizing your existing vacation rental, or exploring rental arbitrage opportunities, understanding the District of Itauguá Airbnb data is crucial. Leveraging the low regulation environment is key to maximizing your short term rental income potential. Let's dive into the specifics.
Key District of Itauguá Airbnb Performance Metrics Overview
Monthly Airbnb Revenue Variations & Income Potential in District of Itauguá (2025)
Understanding the monthly revenue variations for Airbnb listings in District of Itauguá is key to maximizing your short term rental income potential. Seasonality significantly impacts earnings. Our analysis, based on data from the past 12 months, shows that the peak revenue month for STRs in District of Itauguá is typically June, while January often presents the lowest earnings, highlighting opportunities for strategic pricing adjustments during shoulder and low seasons. Explore the typical Airbnb income in District of Itauguá across different performance tiers:
- Best-in-class properties (Top 10%) achieve $3,910+ monthly, often utilizing dynamic pricing and superior guest experiences.
- Strong performing properties (Top 25%) earn $1,521 or more, indicating effective management and desirable locations/amenities.
- Typical properties (Median) generate around $625 per month, representing the average market performance.
- Entry-level properties (Bottom 25%) see earnings around $368, often with potential for optimization.
Average Monthly Airbnb Earnings Trend in District of Itauguá
District of Itauguá Airbnb Occupancy Rate Trends (2025)
Maximize your bookings by understanding the District of Itauguá STR occupancy trends. Seasonal demand shifts significantly influence how often properties are booked. Typically, Octobersees the highest demand (peak season occupancy), while June experiences the lowest (low season). Effective strategies, like adjusting minimum stays or offering promotions, can boost occupancy during slower periods. Here's how different property tiers perform in District of Itauguá:
- Best-in-class properties (Top 10%) achieve 49%+ occupancy, indicating high desirability and potentially optimized availability.
- Strong performing properties (Top 25%) maintain 29% or higher occupancy, suggesting good market fit and guest satisfaction.
- Typical properties (Median) have an occupancy rate around 19%.
- Entry-level properties (Bottom 25%) average 13% occupancy, potentially facing higher vacancy.
Average Monthly Occupancy Rate Trend in District of Itauguá
Average Daily Rate (ADR) Airbnb Trends in District of Itauguá (2025)
Effective short term rental pricing strategy in District of Itauguá involves understanding monthly ADR fluctuations. The Average Daily Rate (ADR) for Airbnb in District of Itauguá typically peaks in March and dips lowest during September. Leveraging Airbnb dynamic pricing tools or strategies based on this seasonality can significantly boost revenue. Here's a look at the typical nightly rates achieved:
- Best-in-class properties (Top 10%) command rates of $363+ per night, often due to premium features or locations.
- Strong performing properties (Top 25%) achieve nightly rates of $134 or more.
- Typical properties (Median) charge around $94 per night.
- Entry-level properties (Bottom 25%) earn around $37 per night.
Average Daily Rate (ADR) Trend by Month in District of Itauguá
Get Live District of Itauguá Market Intelligence 👇
Explore Real-time Analytics
Airbnb Seasonality Analysis & Trends in District of Itauguá (2025)
Peak Season (June, May, July)
- Revenue averages $2,784 per month
- Occupancy rates average 13.2%
- Daily rates average $113
Shoulder Season
- Revenue averages $859 per month
- Occupancy maintains around 30.3%
- Daily rates hold near $137
Low Season (January, April, November)
- Revenue drops to average $579 per month
- Occupancy decreases to average 19.8%
- Daily rates adjust to average $147
Seasonality Insights for District of Itauguá
- The Airbnb seasonality in District of Itauguá shows highly seasonal trends requiring careful strategy. While the sections above show seasonal averages, it's also insightful to look at the extremes:
- During the high season, the absolute peak month showcases District of Itauguá's highest earning potential, with monthly revenues capable of climbing to $3,503, occupancy reaching a high of 34.4%, and ADRs peaking at $166.
- Conversely, the slowest single month of the year, typically falling within the low season, marks the market's lowest point. In this month, revenue might dip to $516, occupancy could drop to 6.7%, and ADRs may adjust down to $111.
- Understanding both the seasonal averages and these monthly peaks and troughs in revenue, occupancy, and ADR is crucial for maximizing your Airbnb profit potential in District of Itauguá.
Seasonal Strategies for Maximizing Profit
- Peak Season: Maximize revenue through premium pricing and potentially longer minimum stays. Ensure high availability.
- Low Season: Offer competitive pricing, special promotions (e.g., extended stay discounts), and flexible cancellation policies. Target off-season travelers like remote workers or budget-conscious guests.
- Shoulder Seasons: Implement dynamic pricing that balances peak and low rates. Target weekend travelers or specific events. Offer slightly more flexible terms than peak season.
- Regularly analyze your own performance against these District of Itauguá seasonality benchmarks and adjust your pricing and availability strategy accordingly.
Best Areas for Airbnb Investment in District of Itauguá (2025)
Exploring the top neighborhoods for short-term rentals in District of Itauguá? This section highlights key areas, outlining why they are attractive for hosts and guests, along with notable local attractions. Consider these locations based on your target guest profile and investment strategy.
| Neighborhood / Area | Why Host Here? (Target Guests & Appeal) | Key Attractions & Landmarks |
|---|---|---|
| Centro | The heart of Itauguá, featuring a mix of historical architecture and modern amenities. Tourists can experience local culture, food markets, and shopping. | Iglesia de la Candelaria, Plaza de los Héroes, Museo del Futuro, Shopping in local markets |
| Parque ÑuGuasu | A large green space and park that provides recreational activities and a beautiful environment. Popular among families and tourists looking for nature and relaxation. | Walking paths, Workout stations, Picnic areas, Playgrounds |
| Caacupé | A nearby city famous for its religious significance and picturesque scenery. Perfect for travelers seeking cultural and spiritual experiences. | Basilica of Caacupé, Local crafts market, Hiking trails |
| Ypacaraí Lake | Known for its scenic beauty and water activities. Guests can enjoy swimming, sailing, and a peaceful lakeside atmosphere. | Water sports, Lakeside beaches, Fishing spots |
| San Bernardino | A tourist hub during the summer months, known for its vibrant nightlife and beach activities. Great for young travelers and parties. | Beaches, Bars and clubs, Boat rentals |
| Areguá | Famous for its ceramics and charming streets, this area attracts tourists interested in local arts and crafts. | Ceramic workshops, Local artisan markets, Historical city center |
| Tebicuary | A peaceful town with a tight-knit community, suitable for travelers looking to escape the hustle and bustle and enjoy a quiet stay. | Local cultural events, Rural landscapes, Traditional Paraguayan cuisine |
| Valle Pucú | An emerging area known for its eco-tourism and nature-friendly activities, appealing to environmentally conscious travelers. | Nature trails, Bird watching, Eco-lodges |
Understanding Airbnb License Requirements & STR Laws in District of Itauguá (2025)
While District of Itauguá, Central Department, Paraguay currently shows low STR regulations, specific Airbnb license requirements might still exist or change. Always verify the latest short term rental regulations and Airbnb license requirements directly with local government authorities for District of Itauguá to ensure full compliance before hosting.
(Source: AirROI data, 2025, finding no licensed listings among those analyzed)
Top Performing Airbnb Properties in District of Itauguá (2025)
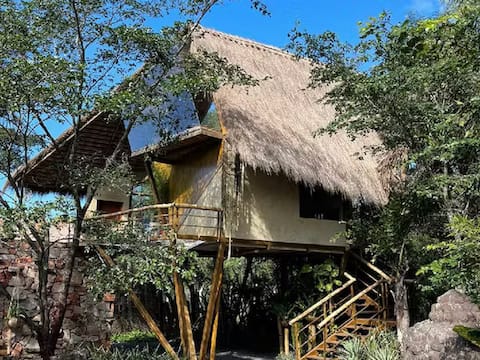
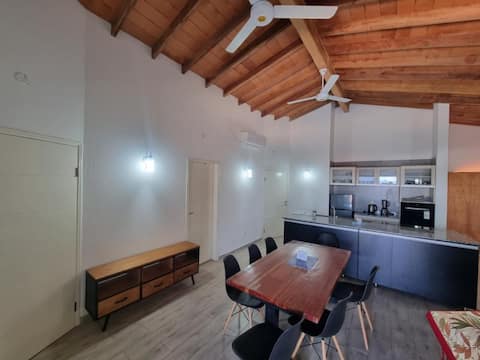
Benchmark your potential! Explore examples of top-performing Airbnb properties in District of Itauguábased on Trailing Twelve Month (TTM) revenue. Analyze their characteristics, revenue, occupancy rate, and ADR to understand what drives success in this market.
Bungalow Apolo
Entire Place • 1 bedroom

Bungalow Atlantis
Entire Place • 1 bedroom

Casa Quinta Yvyraty
Entire Place • 3 bedrooms

Domo Galicia - Quinta La Paloma
Entire Place • 1 bedroom

Casa Sevilla - Quinta La Paloma
Entire Place • 6 bedrooms
4 Schlafzimmer, Pool, Wi-Fi
Entire Place • 4 bedrooms
Note: Performance varies based on location, size, amenities, seasonality, and management quality. Data reflects the past 12 months.
Top Performing Airbnb Hosts in District of Itauguá (2025)
Learn from the best! This table showcases top-performing Airbnb hosts in District of Itauguá based on the number of properties managed and estimated total revenue over the past year. Analyze their scale and performance metrics.
| Host Name | Properties | Grossing Revenue | Stay Reviews | Avg Rating |
|---|---|---|---|---|
| Host #408388221 | 2 | $58,107 | 0 | 0.00/5.0 |
| Pablo | 4 | $39,843 | 32 | 3.64/5.0 |
| Host #495501084 | 1 | $25,736 | 0 | 0.00/5.0 |
| Host #344135718 | 1 | $10,204 | 0 | 0.00/5.0 |
| Fernando Gabriel | 1 | $7,846 | 5 | 4.40/5.0 |
| Host #495436528 | 1 | $6,394 | 0 | 0.00/5.0 |
| Host #53882417 | 1 | $6,262 | 0 | 0.00/5.0 |
| Jonathan | 1 | $4,825 | 5 | 5.00/5.0 |
| Host #466167311 | 1 | $4,748 | 0 | 0.00/5.0 |
| Stefany | 1 | $4,203 | 3 | 5.00/5.0 |
Analyzing the strategies of top hosts, such as their property selection, pricing, and guest communication, can offer valuable lessons for optimizing your own Airbnb operations in District of Itauguá.
Dive Deeper: Advanced District of Itauguá STR Market Data (2025)
Ready to unlock more insights? AirROI provides access to advanced metrics and comprehensive Airbnb data for District of Itauguá. Explore detailed analytics beyond this report to refine your investment strategy, optimize pricing, and maximize your vacation rental profits.
Explore Advanced MetricsDistrict of Itauguá Short-Term Rental Market Composition (2025): Property & Room Types
Room Type Distribution
Property Type Distribution
Market Composition Insights for District of Itauguá
- The District of Itauguá Airbnb market composition is heavily skewed towards Entire Home/Apt listings, which make up 83.3% of the 18 active rentals. This indicates strong guest preference for privacy and space.
- Looking at the property type distribution in District of Itauguá, House properties are the most common (50%), reflecting the local real estate landscape.
- Houses represent a significant 50% portion, catering likely to families or larger groups.
- The presence of 5.6% Hotel/Boutique listings indicates integration with traditional hospitality.
District of Itauguá Airbnb Room Capacity Analysis (2025): Bedroom Distribution
Distribution of Listings by Number of Bedrooms
Room Capacity Insights for District of Itauguá
- The dominant room capacity in District of Itauguá is 1 bedroom listings, making up 50% of the market. This suggests a strong demand for properties suitable for couples or solo travelers.
- Together, 1 bedroom and 2 bedrooms properties represent 77.8% of the active Airbnb listings in District of Itauguá, indicating a high concentration in these sizes.
District of Itauguá Vacation Rental Guest Capacity Trends (2025)
Distribution of Listings by Guest Capacity
Guest Capacity Insights for District of Itauguá
- The most common guest capacity trend in District of Itauguá vacation rentals is listings accommodating 2 guests (27.8%). This suggests the primary traveler segment is likely couples or solo travelers.
- Properties designed for 2 guests and 8+ guests dominate the District of Itauguá STR market, accounting for 44.5% of listings.
- 27.9% of properties accommodate 6+ guests, serving the market segment for larger families or group travel in District of Itauguá.
- On average, properties in District of Itauguá are equipped to host 4.1 guests.
District of Itauguá Airbnb Booking Patterns (2025): Available vs. Booked Days
Available Days Distribution
Booked Days Distribution
Booking Pattern Insights for District of Itauguá
- The most common availability pattern in District of Itauguá falls within the 271-366 days range, representing 77.8% of listings. This suggests many properties have significant open periods on their calendars.
- Approximately 94.5% of listings show high availability (181+ days open annually), indicating potential for increased bookings or specific owner usage patterns.
- For booked days, the 31-90 days range is most frequent in District of Itauguá (61.1%), reflecting common guest stay durations or potential owner blocking patterns.
- A notable 5.6% of properties secure long booking periods (181+ days booked per year), highlighting successful long-term rental strategies or significant owner usage.
District of Itauguá Airbnb Minimum Stay Requirements Analysis
Distribution of Listings by Minimum Night Requirement
1 Night
14 listings
77.8% of total
3 Nights
1 listings
5.6% of total
30+ Nights
3 listings
16.7% of total
Key Insights
- The most prevalent minimum stay requirement in District of Itauguá is 1 Night, adopted by 77.8% of listings. This highlights the market's preference for shorter, flexible bookings.
- A strong majority (77.8%) of the District of Itauguá Airbnb data shows acceptance of very short stays (1-2 nights), indicating a dynamic, high-turnover market.
- A significant segment (16.7%) caters to monthly stays (30+ nights) in District of Itauguá, pointing to opportunities in the extended-stay market.
Recommendations
- Align with the market by considering a 1 Night minimum stay, as 77.8% of District of Itauguá hosts use this setting.
- Explore offering discounts for stays of 30+ nights to attract the 16.7% of the market seeking extended stays.
- Adjust minimum nights based on seasonality – potentially shorter during low season and longer during peak demand periods in District of Itauguá.
District of Itauguá Airbnb Cancellation Policy Trends Analysis (2025)
Flexible
3 listings
50% of total
Strict
3 listings
50% of total
Cancellation Policy Insights for District of Itauguá
- The prevailing Airbnb cancellation policy trend in District of Itauguá is Flexible, used by 50% of listings.
- There's a relatively balanced mix between guest-friendly (50.0%) and stricter (50.0%) policies, offering choices for different guest needs.
Recommendations for Hosts
- Consider adopting a Flexible policy to align with the 50% market standard in District of Itauguá.
- With 50% using Strict terms, this is a viable option in District of Itauguá, particularly for high-value properties or during peak demand periods.
- Regularly review your cancellation policy against competitors and market demand shifts in District of Itauguá.
District of Itauguá STR Booking Lead Time Analysis (2025)
Average Booking Lead Time by Month
Booking Lead Time Insights for District of Itauguá
- The overall average booking lead time for vacation rentals in District of Itauguá is 17 days.
- Guests book furthest in advance for stays during January (average 44 days), likely coinciding with peak travel demand or local events.
- The shortest booking windows occur for stays in June (average 0 days), indicating more last-minute travel plans during this time.
- Seasonally, Winter (30 days avg.) sees the longest lead times, while Summer (7 days avg.) has the shortest, reflecting typical travel planning cycles.
Recommendations for Hosts
- Use the overall average lead time (17 days) as a baseline for your pricing and availability strategy in District of Itauguá.
- For January stays, consider implementing length-of-stay discounts or slightly higher rates for bookings made less than 44 days out to capitalize on advance planning.
- During June, focus on last-minute booking availability and promotions, as guests book with very short notice (0 days avg.).
- Target marketing efforts for the Winter season well in advance (at least 30 days) to capture early planners.
- Monitor your own booking lead times against these District of Itauguá averages to identify opportunities for dynamic pricing adjustments.
Popular & Essential Airbnb Amenities in District of Itauguá (2025)
Amenity Prevalence
Amenity Insights for District of Itauguá
- Essential amenities in District of Itauguá that guests expect include: Kitchen, Air conditioning. Lacking these (any) could significantly impact bookings.
- Popular amenities like Wifi, Outdoor dining area, Free parking on premises are common but not universal. Offering these can provide a competitive edge.
- Warning: Wifi is not universally provided but is considered essential globally. Ensure reliable Wifi is offered.
Recommendations for Hosts
- Ensure your listing includes all essential amenities for District of Itauguá: Kitchen, Air conditioning.
- Consider adding popular differentiators like Wifi or Outdoor dining area to increase appeal.
- Highlight unique or less common amenities you offer (e.g., hot tub, dedicated workspace, EV charger) in your listing description and photos.
- Regularly check competitor amenities in District of Itauguá to stay competitive.
District of Itauguá Airbnb Guest Demographics & Profile Analysis (2025)
Guest Profile Summary for District of Itauguá
- The typical guest profile for Airbnb in District of Itauguá consists of predominantly international visitors (78%), with top international origins including Paraguay, typically belonging to the Post-2000s (Gen Z/Alpha) group (50%), primarily speaking Spanish or Portuguese.
- Domestic travelers account for 22.2% of guests.
- Key international markets include Argentina (33.3%) and Paraguay (22.2%).
- Top languages spoken are Spanish (58.3%) followed by Portuguese (25%).
- A significant demographic segment is the Post-2000s (Gen Z/Alpha) group, representing 50% of guests.
Recommendations for Hosts
- Focus marketing internationally, particularly towards travelers from Paraguay.
- Offer listing details and communication support in Spanish and Portuguese.
- Tailor amenities and listing descriptions to appeal to the dominant Post-2000s (Gen Z/Alpha) demographic (e.g., highlight fast WiFi, smart home features, local guides).
- Highlight unique local experiences or amenities relevant to the primary guest profile.
- Consider seasonal promotions aligned with peak travel times for key origin markets.
Nearby Short-Term Rental Market Comparison
How does the District of Itauguá Airbnb market stack up against its neighbors? Compare key performance metrics like average monthly revenue, ADR, and occupancy rates in surrounding areas to understand the broader regional STR landscape.
| Market | Active Properties | Monthly Revenue | Daily Rate | Avg. Occupancy |
|---|---|---|---|---|
| San Bernardino | 200 | $939 | $184.29 | 21% |
| San Bernardino | 30 | $807 | $149.83 | 22% |
| Altos | 18 | $691 | $103.21 | 25% |
| Asuncion | 1,085 | $562 | $46.79 | 45% |
| Ypacarai District | 31 | $556 | $130.45 | 22% |
| Lambaré | 31 | $502 | $94.98 | 27% |
| Paraguari district | 33 | $493 | $98.17 | 15% |
| Caacupé | 10 | $490 | $79.06 | 20% |
| Areguá | 25 | $455 | $97.62 | 22% |
| Mariano Roque Alonso | 33 | $435 | $58.14 | 33% |