Rheinfelden Airbnb Market Analysis 2025: Short Term Rental Data & Vacation Rental Statistics in Aargau, Switzerland
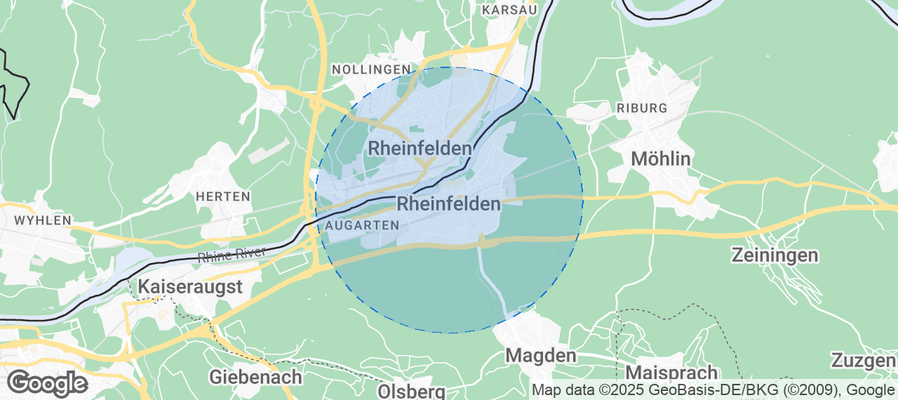
Is Airbnb profitable in Rheinfelden in 2025? Explore comprehensive Airbnb analytics for Rheinfelden, Aargau, Switzerland to uncover income potential. This 2025 STR market report for Rheinfelden, based on AirROI data from October 2024 to September 2025, reveals key trends in the niche market of 17 active listings.
Whether you're considering an Airbnb investment in Rheinfelden, optimizing your existing vacation rental, or exploring rental arbitrage opportunities, understanding the Rheinfelden Airbnb data is crucial. Leveraging the low regulation environment is key to maximizing your short term rental income potential. Let's dive into the specifics.
Key Rheinfelden Airbnb Performance Metrics Overview
Monthly Airbnb Revenue Variations & Income Potential in Rheinfelden (2025)
Understanding the monthly revenue variations for Airbnb listings in Rheinfelden is key to maximizing your short term rental income potential. Seasonality significantly impacts earnings. Our analysis, based on data from the past 12 months, shows that the peak revenue month for STRs in Rheinfelden is typically July, while January often presents the lowest earnings, highlighting opportunities for strategic pricing adjustments during shoulder and low seasons. Explore the typical Airbnb income in Rheinfelden across different performance tiers:
- Best-in-class properties (Top 10%) achieve $3,009+ monthly, often utilizing dynamic pricing and superior guest experiences.
- Strong performing properties (Top 25%) earn $1,989 or more, indicating effective management and desirable locations/amenities.
- Typical properties (Median) generate around $1,220 per month, representing the average market performance.
- Entry-level properties (Bottom 25%) see earnings around $699, often with potential for optimization.
Average Monthly Airbnb Earnings Trend in Rheinfelden
Rheinfelden Airbnb Occupancy Rate Trends (2025)
Maximize your bookings by understanding the Rheinfelden STR occupancy trends. Seasonal demand shifts significantly influence how often properties are booked. Typically, Julysees the highest demand (peak season occupancy), while February experiences the lowest (low season). Effective strategies, like adjusting minimum stays or offering promotions, can boost occupancy during slower periods. Here's how different property tiers perform in Rheinfelden:
- Best-in-class properties (Top 10%) achieve 73%+ occupancy, indicating high desirability and potentially optimized availability.
- Strong performing properties (Top 25%) maintain 62% or higher occupancy, suggesting good market fit and guest satisfaction.
- Typical properties (Median) have an occupancy rate around 46%.
- Entry-level properties (Bottom 25%) average 25% occupancy, potentially facing higher vacancy.
Average Monthly Occupancy Rate Trend in Rheinfelden
Average Daily Rate (ADR) Airbnb Trends in Rheinfelden (2025)
Effective short term rental pricing strategy in Rheinfelden involves understanding monthly ADR fluctuations. The Average Daily Rate (ADR) for Airbnb in Rheinfelden typically peaks in July and dips lowest during April. Leveraging Airbnb dynamic pricing tools or strategies based on this seasonality can significantly boost revenue. Here's a look at the typical nightly rates achieved:
- Best-in-class properties (Top 10%) command rates of $191+ per night, often due to premium features or locations.
- Strong performing properties (Top 25%) achieve nightly rates of $150 or more.
- Typical properties (Median) charge around $88 per night.
- Entry-level properties (Bottom 25%) earn around $76 per night.
Average Daily Rate (ADR) Trend by Month in Rheinfelden
Get Live Rheinfelden Market Intelligence 👇
Explore Real-time Analytics
Airbnb Seasonality Analysis & Trends in Rheinfelden (2025)
Peak Season (July, May, April)
- Revenue averages $1,952 per month
- Occupancy rates average 55.9%
- Daily rates average $121
Shoulder Season
- Revenue averages $1,575 per month
- Occupancy maintains around 44.4%
- Daily rates hold near $118
Low Season (January, February, March)
- Revenue drops to average $1,026 per month
- Occupancy decreases to average 33.4%
- Daily rates adjust to average $100
Seasonality Insights for Rheinfelden
- The Airbnb seasonality in Rheinfelden shows highly seasonal trends requiring careful strategy. While the sections above show seasonal averages, it's also insightful to look at the extremes:
- During the high season, the absolute peak month showcases Rheinfelden's highest earning potential, with monthly revenues capable of climbing to $2,142, occupancy reaching a high of 60.0%, and ADRs peaking at $135.
- Conversely, the slowest single month of the year, typically falling within the low season, marks the market's lowest point. In this month, revenue might dip to $943, occupancy could drop to 27.7%, and ADRs may adjust down to $98.
- Understanding both the seasonal averages and these monthly peaks and troughs in revenue, occupancy, and ADR is crucial for maximizing your Airbnb profit potential in Rheinfelden.
Seasonal Strategies for Maximizing Profit
- Peak Season: Maximize revenue through premium pricing and potentially longer minimum stays. Ensure high availability.
- Low Season: Offer competitive pricing, special promotions (e.g., extended stay discounts), and flexible cancellation policies. Target off-season travelers like remote workers or budget-conscious guests.
- Shoulder Seasons: Implement dynamic pricing that balances peak and low rates. Target weekend travelers or specific events. Offer slightly more flexible terms than peak season.
- Regularly analyze your own performance against these Rheinfelden seasonality benchmarks and adjust your pricing and availability strategy accordingly.
Best Areas for Airbnb Investment in Rheinfelden (2025)
Exploring the top neighborhoods for short-term rentals in Rheinfelden? This section highlights key areas, outlining why they are attractive for hosts and guests, along with notable local attractions. Consider these locations based on your target guest profile and investment strategy.
| Neighborhood / Area | Why Host Here? (Target Guests & Appeal) | Key Attractions & Landmarks |
|---|---|---|
| Altstadt (Old Town) | Historic center of Rheinfelden with charming alleys, traditional architecture, and cozy cafes. A prime location for tourists seeking cultural experiences and local cuisine. | Rheinfelden Town Hall, Rheinfelden Old Bridge, Schwarzbuehl Park, Local markets, Historical museums |
| Rheinpromenade | Scenic river promenade perfect for leisurely walks and outdoor activities. Attracts visitors looking for a picturesque view of the Rhine and opportunities for picnicking or cycling. | Rhein Park, Boat tours, Cycle paths along the river, Picnic areas, Scenic viewpoints |
| Kaiseraugst | Nearby suburb known for its Roman history and archaeological sites. Attracts history enthusiasts and those interested in cultural exploration outside the main tourist areas. | Augusta Raurica Roman site, Theater ruins, Rheinwald Park, Local wineries, Roman Museum |
| Baden | A charming town easily accessible from Rheinfelden, known for its thermal springs and vibrant cultural scene. Appeals to travelers looking for wellness and relaxation. | Baden's thermal baths, Old Town of Baden, Casino Baden, Museum Langmatt, Limmat river |
| Laufenburg | Picturesque town located just across the river, known for its medieval charm and stunning views. Great for tourists looking for a quieter experience with beautiful scenery. | Laufenburg Old Town, Historic bridges, Scenic viewpoints, Local hiking trails, River activities |
| Mägenwil | Emerging area with family-friendly attractions and local parks. Ideal for those traveling with children and looking for a more suburban feel. | Family parks, Nearby sports facilities, Local shops, Community events, Nature trails |
| Frick | A serene town surrounded by nature, appealing to nature lovers and outdoor enthusiasts. Offers various hiking and biking opportunities. | Frick Valley, Hiking trails, Wine tasting tours, Nature parks, Local farms |
| Kaiser-Friedrich-Stadt | A developing neighborhood known for its modern amenities and proximity to transport links. Attractive to business travelers and urban dwellers. | Shopping centers, Public transport access, Food markets, Local restaurants, Community activities |
Understanding Airbnb License Requirements & STR Laws in Rheinfelden (2025)
While Rheinfelden, Aargau, Switzerland currently shows low STR regulations, specific Airbnb license requirements might still exist or change. Always verify the latest short term rental regulations and Airbnb license requirements directly with local government authorities for Rheinfelden to ensure full compliance before hosting.
(Source: AirROI data, 2025, based on 6% licensed listings)
Top Performing Airbnb Properties in Rheinfelden (2025)
Benchmark your potential! Explore examples of top-performing Airbnb properties in Rheinfeldenbased on Trailing Twelve Month (TTM) revenue. Analyze their characteristics, revenue, occupancy rate, and ADR to understand what drives success in this market.

Apartment 3 Rooms , Rheinfelden Switzerland
Entire Place • 2 bedrooms

holidayhouse / holidayflat old city Rheinfelden
Entire Place • 2 bedrooms

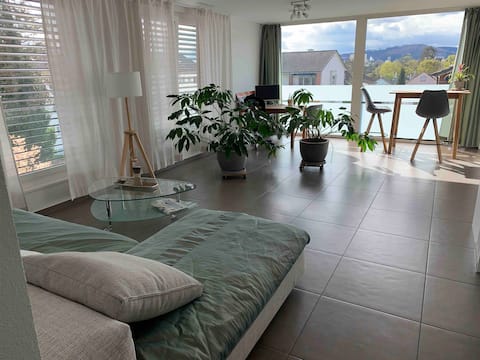
Modernes Studio in Rheinfelden direkt am Rhein
Entire Place • 1 bedroom
Modern apartment in Rheinfelden Schweiz
Entire Place • 1 bedroom

apartment in old town Rheinfelden
Entire Place • 1 bedroom
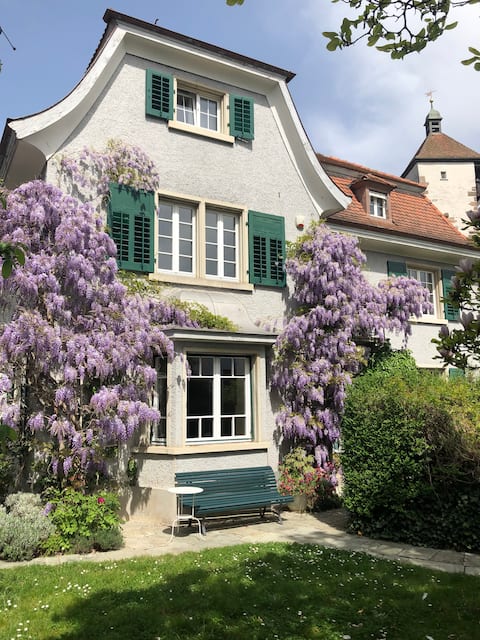
Modern loft apartment in Villa Wencke from 1928
Entire Place • 1 bedroom
Note: Performance varies based on location, size, amenities, seasonality, and management quality. Data reflects the past 12 months.
Top Performing Airbnb Hosts in Rheinfelden (2025)
Learn from the best! This table showcases top-performing Airbnb hosts in Rheinfelden based on the number of properties managed and estimated total revenue over the past year. Analyze their scale and performance metrics.
| Host Name | Properties | Grossing Revenue | Stay Reviews | Avg Rating |
|---|---|---|---|---|
| Elena | 2 | $53,498 | 268 | 4.87/5.0 |
| Marcello Und Sandra | 2 | $51,208 | 171 | 4.97/5.0 |
| Fabian | 1 | $23,209 | 46 | 4.80/5.0 |
| Olga | 1 | $23,013 | 36 | 4.64/5.0 |
| Achim | 2 | $20,671 | 422 | 4.83/5.0 |
| Susanne | 2 | $20,547 | 58 | 5.00/5.0 |
| Wencke | 1 | $19,242 | 26 | 4.88/5.0 |
| Rasema | 1 | $13,788 | 4 | 5.00/5.0 |
| Dibyendu | 1 | $10,835 | 9 | 4.89/5.0 |
| Siggi | 2 | $10,308 | 14 | 4.79/5.0 |
Analyzing the strategies of top hosts, such as their property selection, pricing, and guest communication, can offer valuable lessons for optimizing your own Airbnb operations in Rheinfelden.
Dive Deeper: Advanced Rheinfelden STR Market Data (2025)
Ready to unlock more insights? AirROI provides access to advanced metrics and comprehensive Airbnb data for Rheinfelden. Explore detailed analytics beyond this report to refine your investment strategy, optimize pricing, and maximize your vacation rental profits.
Explore Advanced MetricsRheinfelden Short-Term Rental Market Composition (2025): Property & Room Types
Room Type Distribution
Property Type Distribution
Market Composition Insights for Rheinfelden
- The Rheinfelden Airbnb market composition is heavily skewed towards Entire Home/Apt listings, which make up 70.6% of the 17 active rentals. This indicates strong guest preference for privacy and space.
- Looking at the property type distribution in Rheinfelden, Apartment/Condo properties are the most common (64.7%), reflecting the local real estate landscape.
- Houses represent a significant 29.4% portion, catering likely to families or larger groups.
- The presence of 5.9% Hotel/Boutique listings indicates integration with traditional hospitality.
Rheinfelden Airbnb Room Capacity Analysis (2025): Bedroom Distribution
Distribution of Listings by Number of Bedrooms
Room Capacity Insights for Rheinfelden
- The dominant room capacity in Rheinfelden is 1 bedroom listings, making up 47.1% of the market. This suggests a strong demand for properties suitable for couples or solo travelers.
- Together, 1 bedroom and 2 bedrooms properties represent 64.7% of the active Airbnb listings in Rheinfelden, indicating a high concentration in these sizes.
- Listings with 3+ bedrooms (5.9%) represent a smaller niche, potentially indicating an underserved market for larger group accommodations in Rheinfelden.
Rheinfelden Vacation Rental Guest Capacity Trends (2025)
Distribution of Listings by Guest Capacity
Guest Capacity Insights for Rheinfelden
- The most common guest capacity trend in Rheinfelden vacation rentals is listings accommodating 3 guests (23.5%). This suggests the primary traveler segment is likely small families or groups.
- Properties designed for 3 guests and 2 guests dominate the Rheinfelden STR market, accounting for 47.0% of listings.
- On average, properties in Rheinfelden are equipped to host 2.3 guests.
Rheinfelden Airbnb Booking Patterns (2025): Available vs. Booked Days
Available Days Distribution
Booked Days Distribution
Booking Pattern Insights for Rheinfelden
- The most common availability pattern in Rheinfelden falls within the 91-180 days range, representing 35.3% of listings. This suggests many properties have significant open periods on their calendars.
- Approximately 64.7% of listings show high availability (181+ days open annually), indicating potential for increased bookings or specific owner usage patterns.
- For booked days, the 181-270 days range is most frequent in Rheinfelden (41.2%), reflecting common guest stay durations or potential owner blocking patterns.
- A notable 41.2% of properties secure long booking periods (181+ days booked per year), highlighting successful long-term rental strategies or significant owner usage.
Rheinfelden Airbnb Minimum Stay Requirements Analysis
Distribution of Listings by Minimum Night Requirement
1 Night
7 listings
41.2% of total
2 Nights
5 listings
29.4% of total
4-6 Nights
1 listings
5.9% of total
7-29 Nights
1 listings
5.9% of total
30+ Nights
3 listings
17.6% of total
Key Insights
- The most prevalent minimum stay requirement in Rheinfelden is 1 Night, adopted by 41.2% of listings. This highlights the market's preference for shorter, flexible bookings.
- A strong majority (70.6%) of the Rheinfelden Airbnb data shows acceptance of very short stays (1-2 nights), indicating a dynamic, high-turnover market.
- A significant segment (17.6%) caters to monthly stays (30+ nights) in Rheinfelden, pointing to opportunities in the extended-stay market.
Recommendations
- Align with the market by considering a 1 Night minimum stay, as 41.2% of Rheinfelden hosts use this setting.
- Explore offering discounts for stays of 30+ nights to attract the 17.6% of the market seeking extended stays.
- Adjust minimum nights based on seasonality – potentially shorter during low season and longer during peak demand periods in Rheinfelden.
Rheinfelden Airbnb Cancellation Policy Trends Analysis (2025)
Flexible
7 listings
41.2% of total
Moderate
6 listings
35.3% of total
Firm
3 listings
17.6% of total
Strict
1 listings
5.9% of total
Cancellation Policy Insights for Rheinfelden
- The prevailing Airbnb cancellation policy trend in Rheinfelden is Flexible, used by 41.2% of listings.
- The market strongly favors guest-friendly terms, with 76.5% of listings offering Flexible or Moderate policies. This suggests guests in Rheinfelden may expect booking flexibility.
- Strict cancellation policies are quite rare (5.9%), potentially making listings with this policy less competitive unless justified by high demand or property type.
Recommendations for Hosts
- Consider adopting a Flexible policy to align with the 41.2% market standard in Rheinfelden.
- Using a Strict policy might deter some guests, as only 5.9% of listings use it. Evaluate if potential revenue protection outweighs possible lower booking rates.
- Regularly review your cancellation policy against competitors and market demand shifts in Rheinfelden.
Rheinfelden STR Booking Lead Time Analysis (2025)
Average Booking Lead Time by Month
Booking Lead Time Insights for Rheinfelden
- The overall average booking lead time for vacation rentals in Rheinfelden is 39 days.
- Guests book furthest in advance for stays during May (average 69 days), likely coinciding with peak travel demand or local events.
- The shortest booking windows occur for stays in November (average 20 days), indicating more last-minute travel plans during this time.
- Seasonally, Spring (50 days avg.) sees the longest lead times, while Fall (27 days avg.) has the shortest, reflecting typical travel planning cycles.
Recommendations for Hosts
- Use the overall average lead time (39 days) as a baseline for your pricing and availability strategy in Rheinfelden.
- For May stays, consider implementing length-of-stay discounts or slightly higher rates for bookings made less than 69 days out to capitalize on advance planning.
- Target marketing efforts for the Spring season well in advance (at least 50 days) to capture early planners.
- Monitor your own booking lead times against these Rheinfelden averages to identify opportunities for dynamic pricing adjustments.
Popular & Essential Airbnb Amenities in Rheinfelden (2025)
Amenity Prevalence
Amenity Insights for Rheinfelden
- Popular amenities like Heating, Wifi, Hair dryer are common but not universal. Offering these can provide a competitive edge.
- Warning: Wifi is not universally provided but is considered essential globally. Ensure reliable Wifi is offered.
Recommendations for Hosts
- Consider adding popular differentiators like Heating or Wifi to increase appeal.
- Highlight unique or less common amenities you offer (e.g., hot tub, dedicated workspace, EV charger) in your listing description and photos.
- Regularly check competitor amenities in Rheinfelden to stay competitive.
Rheinfelden Airbnb Guest Demographics & Profile Analysis (2025)
Guest Profile Summary for Rheinfelden
- The typical guest profile for Airbnb in Rheinfelden consists of a mix of domestic (49%) and international guests, with top international origins including Germany, typically belonging to the Post-2000s (Gen Z/Alpha) group (50%), primarily speaking English or German.
- Domestic travelers account for 49.4% of guests.
- Key international markets include Switzerland (49.4%) and Germany (25.3%).
- Top languages spoken are English (32.8%) followed by German (26.7%).
- A significant demographic segment is the Post-2000s (Gen Z/Alpha) group, representing 50% of guests.
Recommendations for Hosts
- Balance marketing efforts between domestic and international channels based on the guest mix.
- Tailor amenities and listing descriptions to appeal to the dominant Post-2000s (Gen Z/Alpha) demographic (e.g., highlight fast WiFi, smart home features, local guides).
- Highlight unique local experiences or amenities relevant to the primary guest profile.
- Consider seasonal promotions aligned with peak travel times for key origin markets.
Nearby Short-Term Rental Market Comparison
How does the Rheinfelden Airbnb market stack up against its neighbors? Compare key performance metrics like average monthly revenue, ADR, and occupancy rates in surrounding areas to understand the broader regional STR landscape.
| Market | Active Properties | Monthly Revenue | Daily Rate | Avg. Occupancy |
|---|---|---|---|---|
| La Rivière-Enverse | 16 | $6,280 | $719.98 | 37% |
| Lauterbrunnen | 553 | $6,030 | $517.48 | 51% |
| Rothenburg | 11 | $5,949 | $306.85 | 62% |
| Grindelwald | 509 | $5,440 | $385.79 | 56% |
| Matten bei Interlaken | 63 | $5,387 | $336.44 | 59% |
| Zermatt | 789 | $5,160 | $490.50 | 47% |
| Bassersdorf | 16 | $5,060 | $396.71 | 49% |
| Interlaken | 310 | $4,983 | $396.73 | 54% |
| Ittenheim | 20 | $4,902 | $296.39 | 43% |
| Niederried bei Interlaken | 17 | $4,892 | $505.36 | 39% |