Robertson Airbnb Market Analysis 2025: Short Term Rental Data & Vacation Rental Statistics in New South Wales, Australia
Is Airbnb profitable in Robertson in 2025? Explore comprehensive Airbnb analytics for Robertson, New South Wales, Australia to uncover income potential. This 2025 STR market report for Robertson, based on AirROI data from December 2024 to November 2025, reveals key trends in the niche market of 48 active listings.
Whether you're considering an Airbnb investment in Robertson, optimizing your existing vacation rental, or exploring rental arbitrage opportunities, understanding the Robertson Airbnb data is crucial. Navigating the high regulation landscape is key to maximizing your short term rental income potential. Let's dive into the specifics.
Key Robertson Airbnb Performance Metrics Overview
Monthly Airbnb Revenue Variations & Income Potential in Robertson (2025)
Understanding the monthly revenue variations for Airbnb listings in Robertson is key to maximizing your short term rental income potential. Seasonality significantly impacts earnings. Our analysis, based on data from the past 12 months, shows that the peak revenue month for STRs in Robertson is typically July, while February often presents the lowest earnings, highlighting opportunities for strategic pricing adjustments during shoulder and low seasons. Explore the typical Airbnb income in Robertson across different performance tiers:
- Best-in-class properties (Top 10%) achieve $10,392+ monthly, often utilizing dynamic pricing and superior guest experiences.
- Strong performing properties (Top 25%) earn $5,546 or more, indicating effective management and desirable locations/amenities.
- Typical properties (Median) generate around $3,322 per month, representing the average market performance.
- Entry-level properties (Bottom 25%) see earnings around $1,820, often with potential for optimization.
Average Monthly Airbnb Earnings Trend in Robertson
Robertson Airbnb Occupancy Rate Trends (2025)
Maximize your bookings by understanding the Robertson STR occupancy trends. Seasonal demand shifts significantly influence how often properties are booked. Typically, Julysees the highest demand (peak season occupancy), while February experiences the lowest (low season). Effective strategies, like adjusting minimum stays or offering promotions, can boost occupancy during slower periods. Here's how different property tiers perform in Robertson:
- Best-in-class properties (Top 10%) achieve 77%+ occupancy, indicating high desirability and potentially optimized availability.
- Strong performing properties (Top 25%) maintain 57% or higher occupancy, suggesting good market fit and guest satisfaction.
- Typical properties (Median) have an occupancy rate around 34%.
- Entry-level properties (Bottom 25%) average 20% occupancy, potentially facing higher vacancy.
Average Monthly Occupancy Rate Trend in Robertson
Average Daily Rate (ADR) Airbnb Trends in Robertson (2025)
Effective short term rental pricing strategy in Robertson involves understanding monthly ADR fluctuations. The Average Daily Rate (ADR) for Airbnb in Robertson typically peaks in July and dips lowest during September. Leveraging Airbnb dynamic pricing tools or strategies based on this seasonality can significantly boost revenue. Here's a look at the typical nightly rates achieved:
- Best-in-class properties (Top 10%) command rates of $858+ per night, often due to premium features or locations.
- Strong performing properties (Top 25%) achieve nightly rates of $551 or more.
- Typical properties (Median) charge around $267 per night.
- Entry-level properties (Bottom 25%) earn around $188 per night.
Average Daily Rate (ADR) Trend by Month in Robertson
Get Live Robertson Market Intelligence 👇

Explore Real-time Analytics
Airbnb Seasonality Analysis & Trends in Robertson (2025)
Peak Season (July, April, March)
- Revenue averages $6,196 per month
- Occupancy rates average 45.8%
- Daily rates average $412
Shoulder Season
- Revenue averages $5,264 per month
- Occupancy maintains around 40.2%
- Daily rates hold near $409
Low Season (February, June, November)
- Revenue drops to average $4,225 per month
- Occupancy decreases to average 32.4%
- Daily rates adjust to average $414
Seasonality Insights for Robertson
- The Airbnb seasonality in Robertson shows moderate seasonality with distinct peak and low periods. While the sections above show seasonal averages, it's also insightful to look at the extremes:
- During the high season, the absolute peak month showcases Robertson's highest earning potential, with monthly revenues capable of climbing to $6,591, occupancy reaching a high of 49.5%, and ADRs peaking at $419.
- Conversely, the slowest single month of the year, typically falling within the low season, marks the market's lowest point. In this month, revenue might dip to $3,613, occupancy could drop to 30.0%, and ADRs may adjust down to $405.
- Understanding both the seasonal averages and these monthly peaks and troughs in revenue, occupancy, and ADR is crucial for maximizing your Airbnb profit potential in Robertson.
Seasonal Strategies for Maximizing Profit
- Peak Season: Maximize revenue through premium pricing and potentially longer minimum stays. Ensure high availability.
- Low Season: Offer competitive pricing, special promotions (e.g., extended stay discounts), and flexible cancellation policies. Target off-season travelers like remote workers or budget-conscious guests.
- Shoulder Seasons: Implement dynamic pricing that balances peak and low rates. Target weekend travelers or specific events. Offer slightly more flexible terms than peak season.
- Regularly analyze your own performance against these Robertson seasonality benchmarks and adjust your pricing and availability strategy accordingly.
Best Areas for Airbnb Investment in Robertson (2025)
Exploring the top neighborhoods for short-term rentals in Robertson? This section highlights key areas, outlining why they are attractive for hosts and guests, along with notable local attractions. Consider these locations based on your target guest profile and investment strategy.
| Neighborhood / Area | Why Host Here? (Target Guests & Appeal) | Key Attractions & Landmarks |
|---|---|---|
| Robertson Village | Charming village atmosphere with beautiful historic buildings. Ideal for visitors seeking a peaceful getaway in the Southern Highlands, close to local attractions and nature. | Robertson Nature Reserve, Robertson Cheese Factory, Historical Museum, Fitzroy Falls, Illawarra Fly Treetop Walk |
| Macquarie Pass National Park | Stunning natural park with lush rainforests and scenic waterfalls. Attracts nature lovers and hikers looking for outdoor adventures and relaxation. | Macquarie Pass Lookout, Dawson's Creek, Waterfall Walks, Wildlife Watching, Picnic Areas |
| Kangaroo Valley | Beautiful valley known for its stunning landscapes and outdoor activities. Great for investment as it draws families and adventure enthusiasts year-round. | Kangaroo Valley Adventure Co., Barrengarry Creek, Fitzroy Falls, Kangaroo River, Local Markets |
| Berry | A picturesque town known for its boutique shops, cafes, and nearby beaches. Popular with tourists who want a mix of country charm and coastal access. | Berry Village Markets, Berry Historic Museum, Seven Mile Beach, Saddleback Mountain, Local Wineries |
| Jamberoo | Quaint village with a friendly community atmosphere, well-known for Jamberoo Action Park. Great for families and thrill-seekers looking for fun. | Jamberoo Action Park, Kangaroo River, Jamberoo Lookout, Local Cafes, Thirroul Beach nearby |
| Shellharbour | Coastal city with beautiful beaches, family-friendly environments, and a relaxing lifestyle. Attractive to tourists seeking beachside fun. | Shellharbour Beach, Stocklands Shellharbour, Historical Sites, Local Seafood Restaurants, Surfing Activities |
| Gerringong | Coastal village with stunning views and access to both beaches and farmlands. Ideal for visitors looking for a relaxing beach holiday with local produce. | Werri Beach, Gerroa Beach, Gerringong Heritage Walk, Local Vineyards, Kiama Blowhole |
| Bombo Beach | Known for its natural beauty and surf culture, attracting beachgoers and surfers. Perfect for those wanting a laid-back beach holiday experience. | Bombo Beach, Kiama Coastal Walk, Surf Schools, Fishing Spots, Local Eats |
Understanding Airbnb License Requirements & STR Laws in Robertson (2025)
Yes, Robertson, New South Wales, Australia enforces high STR regulations. Obtaining a license and ensuring compliance is almost certainly required according to current 2025 STR laws. Always verify the latest short term rental regulations and Airbnb license requirements directly with local government authorities for Robertson to ensure full compliance before hosting.
(Source: AirROI data, 2025, based on 90% licensed listings)
Top Performing Airbnb Properties in Robertson (2025)
Benchmark your potential! Explore examples of top-performing Airbnb properties in Robertsonbased on Trailing Twelve Month (TTM) revenue. Analyze their characteristics, revenue, occupancy rate, and ADR to understand what drives success in this market.
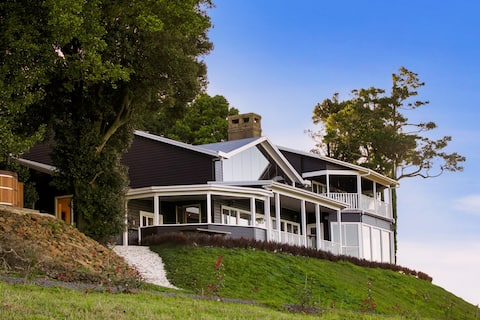
Wildefell and Cottage - Entire Country Estate
Entire Place • 8 bedrooms
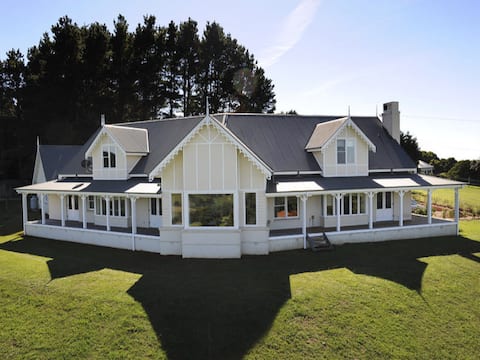
Alba House Robertson
Entire Place • 6 bedrooms
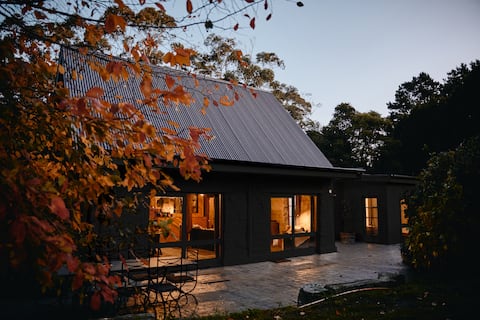
Madison Park Holiday House
Entire Place • 5 bedrooms

Ben Huon Manor
Entire Place • 5 bedrooms
Maple Lodge - 30% off Black Friday Nov & Dec Stays
Entire Place • 7 bedrooms

Hoddle Lane – rural views
Entire Place • 4 bedrooms
Note: Performance varies based on location, size, amenities, seasonality, and management quality. Data reflects the past 12 months.
Top Performing Airbnb Hosts in Robertson (2025)
Learn from the best! This table showcases top-performing Airbnb hosts in Robertson based on the number of properties managed and estimated total revenue over the past year. Analyze their scale and performance metrics.
| Host Name | Properties | Grossing Revenue | Stay Reviews | Avg Rating |
|---|---|---|---|---|
| Thomas | 2 | $517,710 | 69 | 4.99/5.0 |
| Holiday Rental Specialists | 6 | $439,154 | 89 | 4.69/5.0 |
| Simone | 1 | $164,039 | 48 | 4.85/5.0 |
| Jane | 1 | $139,013 | 73 | 4.96/5.0 |
| James | 1 | $102,414 | 33 | 5.00/5.0 |
| Carmen | 1 | $99,717 | 387 | 4.71/5.0 |
| Celeste | 2 | $89,808 | 1080 | 4.97/5.0 |
| James | 2 | $87,162 | 105 | 4.81/5.0 |
| Fiona | 4 | $82,508 | 43 | 4.61/5.0 |
| Kerstin | 2 | $67,962 | 453 | 4.96/5.0 |
Analyzing the strategies of top hosts, such as their property selection, pricing, and guest communication, can offer valuable lessons for optimizing your own Airbnb operations in Robertson.
Dive Deeper: Advanced Robertson STR Market Data (2025)
Ready to unlock more insights? AirROI provides access to advanced metrics and comprehensive Airbnb data for Robertson. Explore detailed analytics beyond this report to refine your investment strategy, optimize pricing, and maximize your vacation rental profits.
Explore Advanced MetricsRobertson Short-Term Rental Market Composition (2025): Property & Room Types
Room Type Distribution
Property Type Distribution
Market Composition Insights for Robertson
- The Robertson Airbnb market composition is heavily skewed towards Entire Home/Apt listings, which make up 97.9% of the 48 active rentals. This indicates strong guest preference for privacy and space.
- Looking at the property type distribution in Robertson, House properties are the most common (62.5%), reflecting the local real estate landscape.
- Houses represent a significant 62.5% portion, catering likely to families or larger groups.
- The presence of 12.5% Hotel/Boutique listings indicates integration with traditional hospitality.
- Smaller segments like others, apartment/condo (combined 4.2%) offer potential for unique stay experiences.
Robertson Airbnb Room Capacity Analysis (2025): Bedroom Distribution
Distribution of Listings by Number of Bedrooms
Room Capacity Insights for Robertson
- The dominant room capacity in Robertson is 1 bedroom listings, making up 22.9% of the market. This suggests a strong demand for properties suitable for couples or solo travelers.
- Together, 1 bedroom and 4 bedrooms properties represent 43.7% of the active Airbnb listings in Robertson, indicating a high concentration in these sizes.
- A significant 58.4% of listings offer 3+ bedrooms, catering to larger groups and families seeking more space in Robertson.
Robertson Vacation Rental Guest Capacity Trends (2025)
Distribution of Listings by Guest Capacity
Guest Capacity Insights for Robertson
- The most common guest capacity trend in Robertson vacation rentals is listings accommodating 8+ guests (37.5%). This suggests the primary traveler segment is likely larger groups.
- Properties designed for 8+ guests and 2 guests dominate the Robertson STR market, accounting for 58.3% of listings.
- 54.2% of properties accommodate 6+ guests, serving the market segment for larger families or group travel in Robertson.
- On average, properties in Robertson are equipped to host 5.4 guests.
Robertson Airbnb Booking Patterns (2025): Available vs. Booked Days
Available Days Distribution
Booked Days Distribution
Booking Pattern Insights for Robertson
- The most common availability pattern in Robertson falls within the 271-366 days range, representing 43.8% of listings. This suggests many properties have significant open periods on their calendars.
- Approximately 79.2% of listings show high availability (181+ days open annually), indicating potential for increased bookings or specific owner usage patterns.
- For booked days, the 91-180 days range is most frequent in Robertson (33.3%), reflecting common guest stay durations or potential owner blocking patterns.
- A notable 25.0% of properties secure long booking periods (181+ days booked per year), highlighting successful long-term rental strategies or significant owner usage.
Robertson Airbnb Minimum Stay Requirements Analysis
Distribution of Listings by Minimum Night Requirement
1 Night
9 listings
19.1% of total
2 Nights
24 listings
51.1% of total
3 Nights
1 listings
2.1% of total
4-6 Nights
1 listings
2.1% of total
30+ Nights
12 listings
25.5% of total
Key Insights
- The most prevalent minimum stay requirement in Robertson is 2 Nights, adopted by 51.1% of listings. This highlights the market's preference for shorter, flexible bookings.
- A strong majority (70.2%) of the Robertson Airbnb data shows acceptance of very short stays (1-2 nights), indicating a dynamic, high-turnover market.
- A significant segment (25.5%) caters to monthly stays (30+ nights) in Robertson, pointing to opportunities in the extended-stay market.
Recommendations
- Align with the market by considering a 2 Nights minimum stay, as 51.1% of Robertson hosts use this setting.
- If feasible, allowing 1-night stays, especially midweek or during low season, could capture last-minute bookings, as only 19.1% currently do.
- A 2-night minimum appears standard (51.1%). Consider this for weekends or peak periods.
- Explore offering discounts for stays of 30+ nights to attract the 25.5% of the market seeking extended stays.
- Adjust minimum nights based on seasonality – potentially shorter during low season and longer during peak demand periods in Robertson.
Robertson Airbnb Cancellation Policy Trends Analysis (2025)
Super Strict 30 Days
6 listings
12.8% of total
Limited
1 listings
2.1% of total
Flexible
9 listings
19.1% of total
Moderate
6 listings
12.8% of total
Firm
20 listings
42.6% of total
Strict
5 listings
10.6% of total
Cancellation Policy Insights for Robertson
- The prevailing Airbnb cancellation policy trend in Robertson is Firm, used by 42.6% of listings.
- A majority (53.2%) of hosts in Robertson utilize Firm or Strict policies, indicating a market where hosts prioritize booking security.
Recommendations for Hosts
- Consider adopting a Firm policy to align with the 42.6% market standard in Robertson.
- Using a Strict policy might deter some guests, as only 10.6% of listings use it. Evaluate if potential revenue protection outweighs possible lower booking rates.
- Regularly review your cancellation policy against competitors and market demand shifts in Robertson.
Robertson STR Booking Lead Time Analysis (2025)
Average Booking Lead Time by Month
Booking Lead Time Insights for Robertson
- The overall average booking lead time for vacation rentals in Robertson is 63 days.
- Guests book furthest in advance for stays during March (average 83 days), likely coinciding with peak travel demand or local events.
- The shortest booking windows occur for stays in July (average 43 days), indicating more last-minute travel plans during this time.
- Seasonally, Fall (76 days avg.) sees the longest lead times, while Summer (52 days avg.) has the shortest, reflecting typical travel planning cycles.
Recommendations for Hosts
- Use the overall average lead time (63 days) as a baseline for your pricing and availability strategy in Robertson.
- For March stays, consider implementing length-of-stay discounts or slightly higher rates for bookings made less than 83 days out to capitalize on advance planning.
- Target marketing efforts for the Fall season well in advance (at least 76 days) to capture early planners.
- Monitor your own booking lead times against these Robertson averages to identify opportunities for dynamic pricing adjustments.
Popular & Essential Airbnb Amenities in Robertson (2025)
Amenity Prevalence
Amenity Insights for Robertson
- Essential amenities in Robertson that guests expect include: Smoke alarm, TV, Free parking on premises, Heating, Kitchen. Lacking these (any) could significantly impact bookings.
- Popular amenities like Hair dryer, Hot water, Iron are common but not universal. Offering these can provide a competitive edge.
Recommendations for Hosts
- Ensure your listing includes all essential amenities for Robertson: Smoke alarm, TV, Free parking on premises, Heating, Kitchen.
- Prioritize adding missing essentials: TV, Free parking on premises, Heating, Kitchen.
- Consider adding popular differentiators like Hair dryer or Hot water to increase appeal.
- Highlight unique or less common amenities you offer (e.g., hot tub, dedicated workspace, EV charger) in your listing description and photos.
- Regularly check competitor amenities in Robertson to stay competitive.
Robertson Airbnb Guest Demographics & Profile Analysis (2025)
Guest Profile Summary for Robertson
- The typical guest profile for Airbnb in Robertson consists of primarily domestic travelers (94%), often arriving from nearby Sydney, typically belonging to the Post-2000s (Gen Z/Alpha) group (50%), primarily speaking English or Spanish.
- Domestic travelers account for 93.6% of guests.
- Key international markets include Australia (93.6%) and United Kingdom (1.7%).
- Top languages spoken are English (67.4%) followed by Spanish (5.7%).
- A significant demographic segment is the Post-2000s (Gen Z/Alpha) group, representing 50% of guests.
Recommendations for Hosts
- Target domestic marketing efforts towards travelers from Sydney and New South Wales.
- Tailor amenities and listing descriptions to appeal to the dominant Post-2000s (Gen Z/Alpha) demographic (e.g., highlight fast WiFi, smart home features, local guides).
- Highlight unique local experiences or amenities relevant to the primary guest profile.
- Consider seasonal promotions aligned with peak travel times for key origin markets.
Nearby Short-Term Rental Market Comparison
How does the Robertson Airbnb market stack up against its neighbors? Compare key performance metrics like average monthly revenue, ADR, and occupancy rates in surrounding areas to understand the broader regional STR landscape.
| Market | Active Properties | Monthly Revenue | Daily Rate | Avg. Occupancy |
|---|---|---|---|---|
| Penrose | 12 | $5,986 | $644.14 | 38% |
| Berry | 122 | $5,913 | $552.72 | 40% |
| Burrawang | 12 | $5,659 | $570.35 | 40% |
| Jaspers Brush | 16 | $4,651 | $468.22 | 36% |
| The Council of the Municipality of Kiama | 118 | $4,514 | $452.02 | 43% |
| Gerringong | 130 | $4,365 | $483.07 | 37% |
| Exeter | 37 | $4,340 | $529.68 | 40% |
| Gerroa | 88 | $4,291 | $511.44 | 32% |
| Bundanoon | 51 | $4,284 | $412.05 | 41% |
| Kangaroo Valley | 140 | $4,196 | $386.65 | 41% |