Plympton-Wyoming Airbnb Market Analysis 2025: Short Term Rental Data & Vacation Rental Statistics in Ontario, Canada
Is Airbnb profitable in Plympton-Wyoming in 2025? Explore comprehensive Airbnb analytics for Plympton-Wyoming, Ontario, Canada to uncover income potential. This 2025 STR market report for Plympton-Wyoming, based on AirROI data from April 2024 to March 2025, reveals key trends in the niche market of 46 active listings.
Whether you're considering an Airbnb investment in Plympton-Wyoming, optimizing your existing vacation rental, or exploring rental arbitrage opportunities, understanding the Plympton-Wyoming Airbnb data is crucial. Leveraging the low regulation environment is key to maximizing your short term rental income potential. Let's dive into the specifics.
Key Plympton-Wyoming Airbnb Performance Metrics Overview
Monthly Airbnb Revenue Variations & Income Potential in Plympton-Wyoming (2025)
Understanding the monthly revenue variations for Airbnb listings in Plympton-Wyoming is key to maximizing your short term rental income potential. Seasonality significantly impacts earnings. Our analysis, based on data from the past 12 months, shows that the peak revenue month for STRs in Plympton-Wyoming is typically July, while February often presents the lowest earnings, highlighting opportunities for strategic pricing adjustments during shoulder and low seasons. Explore the typical Airbnb income in Plympton-Wyoming across different performance tiers:
- Best-in-class properties (Top 10%) achieve $6,682+ monthly, often utilizing dynamic pricing and superior guest experiences.
- Strong performing properties (Top 25%) earn $4,224 or more, indicating effective management and desirable locations/amenities.
- Typical properties (Median) generate around $2,677 per month, representing the average market performance.
- Entry-level properties (Bottom 25%) see earnings around $1,520, often with potential for optimization.
Average Monthly Airbnb Earnings Trend in Plympton-Wyoming
Plympton-Wyoming Airbnb Occupancy Rate Trends (2025)
Maximize your bookings by understanding the Plympton-Wyoming STR occupancy trends. Seasonal demand shifts significantly influence how often properties are booked. Typically, Julysees the highest demand (peak season occupancy), while February experiences the lowest (low season). Effective strategies, like adjusting minimum stays or offering promotions, can boost occupancy during slower periods. Here's how different property tiers perform in Plympton-Wyoming:
- Best-in-class properties (Top 10%) achieve 80%+ occupancy, indicating high desirability and potentially optimized availability.
- Strong performing properties (Top 25%) maintain 63% or higher occupancy, suggesting good market fit and guest satisfaction.
- Typical properties (Median) have an occupancy rate around 42%.
- Entry-level properties (Bottom 25%) average 22% occupancy, potentially facing higher vacancy.
Average Monthly Occupancy Rate Trend in Plympton-Wyoming
Average Daily Rate (ADR) Airbnb Trends in Plympton-Wyoming (2025)
Effective short term rental pricing strategy in Plympton-Wyoming involves understanding monthly ADR fluctuations. The Average Daily Rate (ADR) for Airbnb in Plympton-Wyoming typically peaks in August and dips lowest during February. Leveraging Airbnb dynamic pricing tools or strategies based on this seasonality can significantly boost revenue. Here's a look at the typical nightly rates achieved:
- Best-in-class properties (Top 10%) command rates of $339+ per night, often due to premium features or locations.
- Strong performing properties (Top 25%) achieve nightly rates of $251 or more.
- Typical properties (Median) charge around $183 per night.
- Entry-level properties (Bottom 25%) earn around $117 per night.
Average Daily Rate (ADR) Trend by Month in Plympton-Wyoming
Get Live Plympton-Wyoming Market Intelligence 👇

Explore Real-time Analytics
Airbnb Seasonality Analysis & Trends in Plympton-Wyoming (2025)
Peak Season (July, August, April)
- Revenue averages $5,477 per month
- Occupancy rates average 61.6%
- Daily rates average $218
Shoulder Season
- Revenue averages $2,967 per month
- Occupancy maintains around 40.1%
- Daily rates hold near $202
Low Season (January, February, November)
- Revenue drops to average $1,713 per month
- Occupancy decreases to average 35.1%
- Daily rates adjust to average $188
Seasonality Insights for Plympton-Wyoming
- The Airbnb seasonality in Plympton-Wyoming shows highly seasonal trends requiring careful strategy. While the sections above show seasonal averages, it's also insightful to look at the extremes:
- During the high season, the absolute peak month showcases Plympton-Wyoming's highest earning potential, with monthly revenues capable of climbing to $6,089, occupancy reaching a high of 71.2%, and ADRs peaking at $228.
- Conversely, the slowest single month of the year, typically falling within the low season, marks the market's lowest point. In this month, revenue might dip to $1,457, occupancy could drop to 34.7%, and ADRs may adjust down to $182.
- Understanding both the seasonal averages and these monthly peaks and troughs in revenue, occupancy, and ADR is crucial for maximizing your Airbnb profit potential in Plympton-Wyoming.
Seasonal Strategies for Maximizing Profit
- Peak Season: Maximize revenue through premium pricing and potentially longer minimum stays. Ensure high availability.
- Low Season: Offer competitive pricing, special promotions (e.g., extended stay discounts), and flexible cancellation policies. Target off-season travelers like remote workers or budget-conscious guests.
- Shoulder Seasons: Implement dynamic pricing that balances peak and low rates. Target weekend travelers or specific events. Offer slightly more flexible terms than peak season.
- Regularly analyze your own performance against these Plympton-Wyoming seasonality benchmarks and adjust your pricing and availability strategy accordingly.
Best Areas for Airbnb Investment in Plympton-Wyoming (2025)
Exploring the top neighborhoods for short-term rentals in Plympton-Wyoming? This section highlights key areas, outlining why they are attractive for hosts and guests, along with notable local attractions. Consider these locations based on your target guest profile and investment strategy.
| Neighborhood / Area | Why Host Here? (Target Guests & Appeal) | Key Attractions & Landmarks |
|---|---|---|
| Lambton County | A picturesque region with beautiful rural landscapes, making it ideal for guests looking for a peaceful getaway. Proximity to natural attractions and outdoor activities. | Canatara Park, Lambton Heritage Museum, Pinery Provincial Park, Lake Huron beaches, Wildwood Conservation Area |
| Wyoming Village | A quaint village known for its community charm and accessibility to surrounding urban areas. Offers a blend of suburban life with easy access to amenities. | Wyoming Park, Local cafes and restaurants, Community events, Adjacent to Sarnia's attractions |
| Lakeshore Road | Offers stunning views of Lake Huron and is a prime location for summer tourism, attracting visitors looking for waterfront activities. | Public beaches, Boating and fishing opportunities, Scenic lakeside trails, Nearby golf courses |
| Sarnia City Centre | The urban hub of the area, with various shops, restaurants, and cultural sites. Suitable for guests seeking the vibrancy of city life. | Bluewater Boardwalk, Sarnia Bay Marina, Imperial Theatre, Local markets, Art galleries |
| Point Edward | Located near the St. Clair River, this area provides unique waterfront experiences and is a popular spot for visitors looking to explore Sarnia and St. Clair. | Point Edward Waterfront Park, Canoeing and kayaking, Fort Gratiot Lighthouse, Shopping in Point Edward |
| Bright's Grove | A calm neighborhood perfect for families and couples, offering a relaxed atmosphere near the water and local parks. | Bright's Grove Beaches, Walking trails, Parks and recreation areas, Local dining options |
| Lambton Shores | Known for its stunning beaches and outdoor activities, this area attracts visitors for summer getaways and nature exploration. | Grand Bend Beach, Pinery Provincial Park, Cultural festivals, Lighthouse tours |
| Petrolia | A historic town with Victorian architecture and rich heritage, this area attracts those interested in history and small-town charm. | Victoria Playhouse, Petrolia Heritage Museum, Cultural events, Charming local shops |
Understanding Airbnb License Requirements & STR Laws in Plympton-Wyoming (2025)
While Plympton-Wyoming, Ontario, Canada currently shows low STR regulations, specific Airbnb license requirements might still exist or change. Always verify the latest short term rental regulations and Airbnb license requirements directly with local government authorities for Plympton-Wyoming to ensure full compliance before hosting.
(Source: AirROI data, 2025, finding no licensed listings among those analyzed)
Top Performing Airbnb Properties in Plympton-Wyoming (2025)
Benchmark your potential! Explore examples of top-performing Airbnb properties in Plympton-Wyomingbased on Trailing Twelve Month (TTM) revenue. Analyze their characteristics, revenue, occupancy rate, and ADR to understand what drives success in this market.
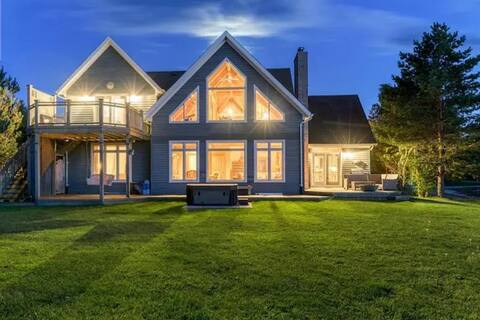
Lakefront Lodge Private Beach Retreat w/ Hottub
Entire Place • 4 bedrooms

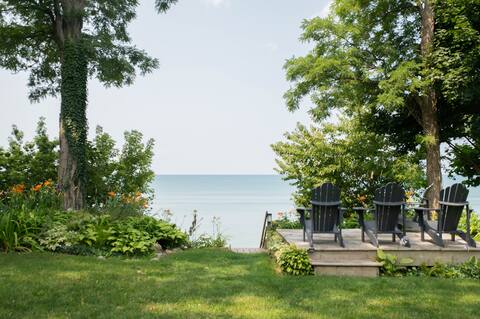
Sparks Waterfront Cottages- Blue Point Bay
Entire Place • 6 bedrooms
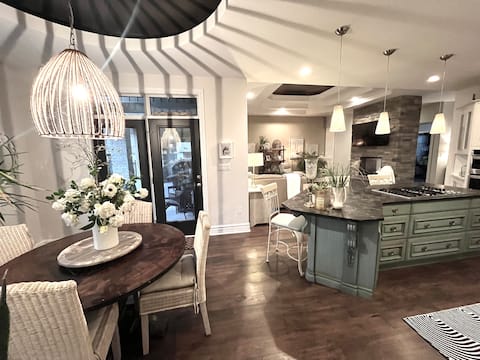
The Cardinal Point
Entire Place • 3 bedrooms
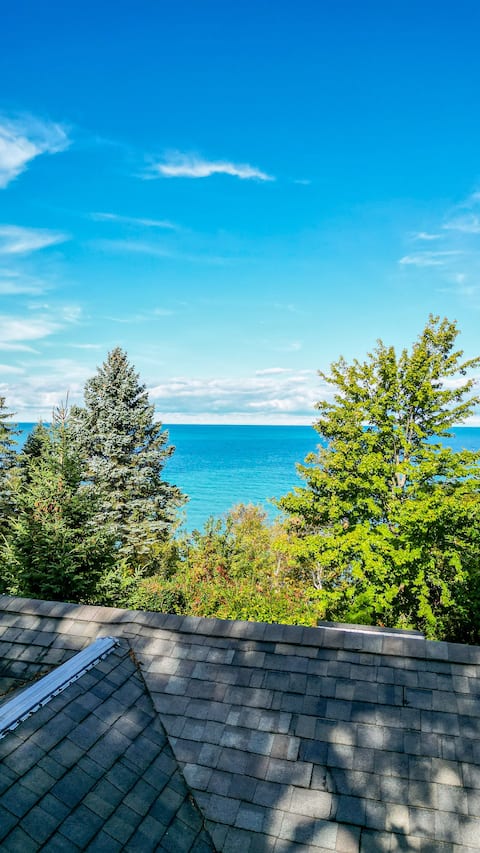
Spacious Luxury Home
Entire Place • 5 bedrooms
The Rose Cottage- Waterfront
Entire Place • 4 bedrooms

The Oasis Beach Home
Entire Place • 3 bedrooms
Note: Performance varies based on location, size, amenities, seasonality, and management quality. Data reflects the past 12 months.
Top Performing Airbnb Hosts in Plympton-Wyoming (2025)
Learn from the best! This table showcases top-performing Airbnb hosts in Plympton-Wyoming based on the number of properties managed and estimated total revenue over the past year. Analyze their scale and performance metrics.
| Host Name | Properties | Grossing Revenue | Stay Reviews | Avg Rating |
|---|---|---|---|---|
| Sean | 4 | $253,075 | 291 | 4.79/5.0 |
| Reilly & Kourtney | 4 | $203,119 | 129 | 3.57/5.0 |
| Louise | 2 | $107,527 | 22 | 5.00/5.0 |
| Sarah | 3 | $88,730 | 46 | 4.87/5.0 |
| Duane And Sheila | 1 | $39,495 | 12 | 4.92/5.0 |
| Erick And Terri-Lynn | 1 | $38,078 | 213 | 4.95/5.0 |
| Angela | 1 | $37,038 | 97 | 4.89/5.0 |
| Host #191857994 | 1 | $34,071 | 49 | 4.96/5.0 |
| Jim & Rachael | 2 | $32,390 | 278 | 4.96/5.0 |
| Jeremy | 1 | $32,220 | 97 | 4.79/5.0 |
Analyzing the strategies of top hosts, such as their property selection, pricing, and guest communication, can offer valuable lessons for optimizing your own Airbnb operations in Plympton-Wyoming.
Dive Deeper: Advanced Plympton-Wyoming STR Market Data (2025)
Ready to unlock more insights? AirROI provides access to advanced metrics and comprehensive Airbnb data for Plympton-Wyoming. Explore detailed analytics beyond this report to refine your investment strategy, optimize pricing, and maximize your vacation rental profits.
Explore Advanced MetricsPlympton-Wyoming Short-Term Rental Market Composition (2025): Property & Room Types
Room Type Distribution
Property Type Distribution
Market Composition Insights for Plympton-Wyoming
- The Plympton-Wyoming Airbnb market composition is heavily skewed towards Entire Home/Apt listings, which make up 93.5% of the 46 active rentals. This indicates strong guest preference for privacy and space.
- Looking at the property type distribution in Plympton-Wyoming, House properties are the most common (87%), reflecting the local real estate landscape.
- Houses represent a significant 87% portion, catering likely to families or larger groups.
- The presence of 8.7% Hotel/Boutique listings indicates integration with traditional hospitality.
- Smaller segments like apartment/condo (combined 4.3%) offer potential for unique stay experiences.
Plympton-Wyoming Airbnb Room Capacity Analysis (2025): Bedroom Distribution
Distribution of Listings by Number of Bedrooms
Room Capacity Insights for Plympton-Wyoming
- The dominant room capacity in Plympton-Wyoming is 3 bedrooms listings, making up 45.7% of the market. This suggests a strong demand for properties suitable for families or small groups.
- Together, 3 bedrooms and 2 bedrooms properties represent 71.8% of the active Airbnb listings in Plympton-Wyoming, indicating a high concentration in these sizes.
- A significant 63.1% of listings offer 3+ bedrooms, catering to larger groups and families seeking more space in Plympton-Wyoming.
Plympton-Wyoming Vacation Rental Guest Capacity Trends (2025)
Distribution of Listings by Guest Capacity
Guest Capacity Insights for Plympton-Wyoming
- The most common guest capacity trend in Plympton-Wyoming vacation rentals is listings accommodating 8+ guests (34.8%). This suggests the primary traveler segment is likely larger groups.
- Properties designed for 8+ guests and 6 guests dominate the Plympton-Wyoming STR market, accounting for 69.6% of listings.
- 76.1% of properties accommodate 6+ guests, serving the market segment for larger families or group travel in Plympton-Wyoming.
- On average, properties in Plympton-Wyoming are equipped to host 5.9 guests.
Plympton-Wyoming Airbnb Booking Patterns (2025): Available vs. Booked Days
Available Days Distribution
Booked Days Distribution
Booking Pattern Insights for Plympton-Wyoming
- The most common availability pattern in Plympton-Wyoming falls within the 181-270 days range, representing 41.3% of listings. This suggests many properties have significant open periods on their calendars.
- Approximately 76.1% of listings show high availability (181+ days open annually), indicating potential for increased bookings or specific owner usage patterns.
- For booked days, the 91-180 days range is most frequent in Plympton-Wyoming (39.1%), reflecting common guest stay durations or potential owner blocking patterns.
- A notable 26.0% of properties secure long booking periods (181+ days booked per year), highlighting successful long-term rental strategies or significant owner usage.
Plympton-Wyoming Airbnb Minimum Stay Requirements Analysis
Distribution of Listings by Minimum Night Requirement
1 Night
10 listings
22.2% of total
2 Nights
12 listings
26.7% of total
3 Nights
4 listings
8.9% of total
4-6 Nights
9 listings
20% of total
7-29 Nights
3 listings
6.7% of total
30+ Nights
7 listings
15.6% of total
Key Insights
- The most prevalent minimum stay requirement in Plympton-Wyoming is 2 Nights, adopted by 26.7% of listings. This highlights the market's preference for shorter, flexible bookings.
- A significant segment (15.6%) caters to monthly stays (30+ nights) in Plympton-Wyoming, pointing to opportunities in the extended-stay market.
Recommendations
- Align with the market by considering a 2 Nights minimum stay, as 26.7% of Plympton-Wyoming hosts use this setting.
- If feasible, allowing 1-night stays, especially midweek or during low season, could capture last-minute bookings, as only 22.2% currently do.
- Explore offering discounts for stays of 30+ nights to attract the 15.6% of the market seeking extended stays.
- Adjust minimum nights based on seasonality – potentially shorter during low season and longer during peak demand periods in Plympton-Wyoming.
Plympton-Wyoming Airbnb Cancellation Policy Trends Analysis (2025)
Flexible
12 listings
27.3% of total
Moderate
10 listings
22.7% of total
Firm
9 listings
20.5% of total
Strict
13 listings
29.5% of total
Cancellation Policy Insights for Plympton-Wyoming
- The prevailing Airbnb cancellation policy trend in Plympton-Wyoming is Strict, used by 29.5% of listings.
- There's a relatively balanced mix between guest-friendly (50.0%) and stricter (50.0%) policies, offering choices for different guest needs.
Recommendations for Hosts
- Consider adopting a Strict policy to align with the 29.5% market standard in Plympton-Wyoming.
- Regularly review your cancellation policy against competitors and market demand shifts in Plympton-Wyoming.
Plympton-Wyoming STR Booking Lead Time Analysis (2025)
Average Booking Lead Time by Month
Booking Lead Time Insights for Plympton-Wyoming
- The overall average booking lead time for vacation rentals in Plympton-Wyoming is 51 days.
- Guests book furthest in advance for stays during July (average 109 days), likely coinciding with peak travel demand or local events.
- The shortest booking windows occur for stays in March (average 11 days), indicating more last-minute travel plans during this time.
- Seasonally, Summer (85 days avg.) sees the longest lead times, while Winter (37 days avg.) has the shortest, reflecting typical travel planning cycles.
Recommendations for Hosts
- Use the overall average lead time (51 days) as a baseline for your pricing and availability strategy in Plympton-Wyoming.
- For July stays, consider implementing length-of-stay discounts or slightly higher rates for bookings made less than 109 days out to capitalize on advance planning.
- During March, focus on last-minute booking availability and promotions, as guests book with very short notice (11 days avg.).
- Target marketing efforts for the Summer season well in advance (at least 85 days) to capture early planners.
- Monitor your own booking lead times against these Plympton-Wyoming averages to identify opportunities for dynamic pricing adjustments.
Popular & Essential Airbnb Amenities in Plympton-Wyoming (2025)
Amenity Prevalence
Amenity Insights for Plympton-Wyoming
- Essential amenities in Plympton-Wyoming that guests expect include: Smoke alarm, Free parking on premises, Wifi, Carbon monoxide alarm, Heating, Hot water. Lacking these (any) could significantly impact bookings.
- Popular amenities like Coffee maker, BBQ grill, Refrigerator are common but not universal. Offering these can provide a competitive edge.
Recommendations for Hosts
- Ensure your listing includes all essential amenities for Plympton-Wyoming: Smoke alarm, Free parking on premises, Wifi, Carbon monoxide alarm, Heating, Hot water.
- Prioritize adding missing essentials: Heating, Hot water.
- Consider adding popular differentiators like Coffee maker or BBQ grill to increase appeal.
- Highlight unique or less common amenities you offer (e.g., hot tub, dedicated workspace, EV charger) in your listing description and photos.
- Regularly check competitor amenities in Plympton-Wyoming to stay competitive.
Plympton-Wyoming Airbnb Guest Demographics & Profile Analysis (2025)
Guest Profile Summary for Plympton-Wyoming
- The typical guest profile for Airbnb in Plympton-Wyoming consists of primarily domestic travelers (81%), often arriving from nearby Toronto, typically belonging to the Post-2000s (Gen Z/Alpha) group (50%), primarily speaking English or French.
- Domestic travelers account for 80.9% of guests.
- Key international markets include Canada (80.9%) and United States (16.4%).
- Top languages spoken are English (70.8%) followed by French (6.8%).
- A significant demographic segment is the Post-2000s (Gen Z/Alpha) group, representing 50% of guests.
Recommendations for Hosts
- Target domestic marketing efforts towards travelers from Toronto and London.
- Tailor amenities and listing descriptions to appeal to the dominant Post-2000s (Gen Z/Alpha) demographic (e.g., highlight fast WiFi, smart home features, local guides).
- Highlight unique local experiences or amenities relevant to the primary guest profile.
- Consider seasonal promotions aligned with peak travel times for key origin markets.
Nearby Short-Term Rental Market Comparison
How does the Plympton-Wyoming Airbnb market stack up against its neighbors? Compare key performance metrics like average monthly revenue, ADR, and occupancy rates in surrounding areas to understand the broader regional STR landscape.
| Market | Active Properties | Monthly Revenue | Daily Rate | Avg. Occupancy |
|---|---|---|---|---|
| Forester | 11 | $5,685 | $390.48 | 43% |
| City of Frankenmuth | 29 | $5,143 | $304.06 | 54% |
| Ann Arbor | 487 | $4,539 | $424.08 | 48% |
| Hamburg Township | 36 | $4,279 | $397.92 | 44% |
| White Lake Charter Township | 27 | $4,025 | $328.99 | 46% |
| Pittsfield Charter Township | 39 | $3,862 | $332.88 | 45% |
| Scio Township | 22 | $3,818 | $510.44 | 45% |
| Port Sanilac | 30 | $3,765 | $470.85 | 34% |
| Harrison Township | 24 | $3,464 | $248.32 | 50% |
| Lexington | 31 | $3,459 | $385.98 | 43% |