Trappes Airbnb Market Analysis 2025: Short Term Rental Data & Vacation Rental Statistics in Ile-de-France, France
Is Airbnb profitable in Trappes in 2025? Explore comprehensive Airbnb analytics for Trappes, Ile-de-France, France to uncover income potential. This 2025 STR market report for Trappes, based on AirROI data from April 2024 to March 2025, reveals key trends in the niche market of 72 active listings.
Whether you're considering an Airbnb investment in Trappes, optimizing your existing vacation rental, or exploring rental arbitrage opportunities, understanding the Trappes Airbnb data is crucial. Leveraging the low regulation environment is key to maximizing your short term rental income potential. Let's dive into the specifics.
Key Trappes Airbnb Performance Metrics Overview
Monthly Airbnb Revenue Variations & Income Potential in Trappes (2025)
Understanding the monthly revenue variations for Airbnb listings in Trappes is key to maximizing your short term rental income potential. Seasonality significantly impacts earnings. Our analysis, based on data from the past 12 months, shows that the peak revenue month for STRs in Trappes is typically April, while January often presents the lowest earnings, highlighting opportunities for strategic pricing adjustments during shoulder and low seasons. Explore the typical Airbnb income in Trappes across different performance tiers:
- Best-in-class properties (Top 10%) achieve $2,973+ monthly, often utilizing dynamic pricing and superior guest experiences.
- Strong performing properties (Top 25%) earn $2,035 or more, indicating effective management and desirable locations/amenities.
- Typical properties (Median) generate around $1,332 per month, representing the average market performance.
- Entry-level properties (Bottom 25%) see earnings around $644, often with potential for optimization.
Average Monthly Airbnb Earnings Trend in Trappes
Trappes Airbnb Occupancy Rate Trends (2025)
Maximize your bookings by understanding the Trappes STR occupancy trends. Seasonal demand shifts significantly influence how often properties are booked. Typically, Junesees the highest demand (peak season occupancy), while January experiences the lowest (low season). Effective strategies, like adjusting minimum stays or offering promotions, can boost occupancy during slower periods. Here's how different property tiers perform in Trappes:
- Best-in-class properties (Top 10%) achieve 75%+ occupancy, indicating high desirability and potentially optimized availability.
- Strong performing properties (Top 25%) maintain 57% or higher occupancy, suggesting good market fit and guest satisfaction.
- Typical properties (Median) have an occupancy rate around 34%.
- Entry-level properties (Bottom 25%) average 18% occupancy, potentially facing higher vacancy.
Average Monthly Occupancy Rate Trend in Trappes
Average Daily Rate (ADR) Airbnb Trends in Trappes (2025)
Effective short term rental pricing strategy in Trappes involves understanding monthly ADR fluctuations. The Average Daily Rate (ADR) for Airbnb in Trappes typically peaks in July and dips lowest during March. Leveraging Airbnb dynamic pricing tools or strategies based on this seasonality can significantly boost revenue. Here's a look at the typical nightly rates achieved:
- Best-in-class properties (Top 10%) command rates of $239+ per night, often due to premium features or locations.
- Strong performing properties (Top 25%) achieve nightly rates of $128 or more.
- Typical properties (Median) charge around $85 per night.
- Entry-level properties (Bottom 25%) earn around $63 per night.
Average Daily Rate (ADR) Trend by Month in Trappes
Get Live Trappes Market Intelligence 👇

Explore Real-time Analytics
Airbnb Seasonality Analysis & Trends in Trappes (2025)
Peak Season (April, May, June)
- Revenue averages $2,676 per month
- Occupancy rates average 42.1%
- Daily rates average $130
Shoulder Season
- Revenue averages $1,344 per month
- Occupancy maintains around 39.6%
- Daily rates hold near $125
Low Season (January, February, March)
- Revenue drops to average $797 per month
- Occupancy decreases to average 32.7%
- Daily rates adjust to average $115
Seasonality Insights for Trappes
- The Airbnb seasonality in Trappes shows highly seasonal trends requiring careful strategy. While the sections above show seasonal averages, it's also insightful to look at the extremes:
- During the high season, the absolute peak month showcases Trappes's highest earning potential, with monthly revenues capable of climbing to $2,778, occupancy reaching a high of 48.6%, and ADRs peaking at $142.
- Conversely, the slowest single month of the year, typically falling within the low season, marks the market's lowest point. In this month, revenue might dip to $757, occupancy could drop to 28.9%, and ADRs may adjust down to $113.
- Understanding both the seasonal averages and these monthly peaks and troughs in revenue, occupancy, and ADR is crucial for maximizing your Airbnb profit potential in Trappes.
Seasonal Strategies for Maximizing Profit
- Peak Season: Maximize revenue through premium pricing and potentially longer minimum stays. Ensure high availability.
- Low Season: Offer competitive pricing, special promotions (e.g., extended stay discounts), and flexible cancellation policies. Target off-season travelers like remote workers or budget-conscious guests.
- Shoulder Seasons: Implement dynamic pricing that balances peak and low rates. Target weekend travelers or specific events. Offer slightly more flexible terms than peak season.
- Regularly analyze your own performance against these Trappes seasonality benchmarks and adjust your pricing and availability strategy accordingly.
Best Areas for Airbnb Investment in Trappes (2025)
Exploring the top neighborhoods for short-term rentals in Trappes? This section highlights key areas, outlining why they are attractive for hosts and guests, along with notable local attractions. Consider these locations based on your target guest profile and investment strategy.
| Neighborhood / Area | Why Host Here? (Target Guests & Appeal) | Key Attractions & Landmarks |
|---|---|---|
| Trappes City Center | The heart of Trappes with easy access to local amenities, shops, and restaurants. A great place for visitors wanting to explore the local culture and community. | Trappes Market, La Ferme de Gally, Cultural Center, Stade de la Butte aux Cailles |
| Saint-Quentin-en-Yvelines | A nearby city with several attractions, it features beautiful parks and lakes, making it appealing for outdoor enthusiasts. | Parc Naturel de la Vallée de Chevreuse, Golfs de Saint-Quentin, Base de Loisirs de Saint-Quentin, Square du Verger |
| Versailles | Famous for its historical significance and the Palace of Versailles, this area attracts tourists from all over the world, ideal for Airbnb hosting. | Palace of Versailles, Gardens of Versailles, Grand Trianon, Cultural Exhibitions |
| Le Mesnil-Saint-Denis | A quieter suburban area, close to Trappes, perfect for families and those looking for a peaceful retreat while still being close to Paris. | Forest of Meudon, Local parks, Château de la Couronne, Economical local shopping |
| Montigny-le-Bretonneux | An emerging neighborhood that is developing rapidly. Close amenities and a growing number of attractions make it a favorable spot for investment. | Les Arcades shopping center, AquaLand, Local restaurants, Parc des Sources |
| Guyancourt | Known for its technological parks and proximity to the capital, this area is appealing for those visiting for business or events. | Vélodrome National, Saint-Quentin-en-Yvelines National Velodrome, Local tech companies, Cultural events |
| Élancourt | Offering a mix of residential charm and proximity to leisure activities like parks and shopping, attracting both tourists and families. | Parc Naturel de la Vallée de Chevreuse, Shopping malls like Cap Seine, Parc d'attractions France Miniature, Cultural activities |
| Plaisir | A lively suburban town with plenty of shopping and entertainment options, great for both business travelers and families. | Plaisir-Les Clayes Train Station, Shopping in Plaisir shopping center, Plaisir Castle, Local festivals and events |
Understanding Airbnb License Requirements & STR Laws in Trappes (2025)
While Trappes, Ile-de-France, France currently shows low STR regulations, specific Airbnb license requirements might still exist or change. Always verify the latest short term rental regulations and Airbnb license requirements directly with local government authorities for Trappes to ensure full compliance before hosting.
(Source: AirROI data, 2025, based on 1% licensed listings)
Top Performing Airbnb Properties in Trappes (2025)
Benchmark your potential! Explore examples of top-performing Airbnb properties in Trappesbased on Trailing Twelve Month (TTM) revenue. Analyze their characteristics, revenue, occupancy rate, and ADR to understand what drives success in this market.
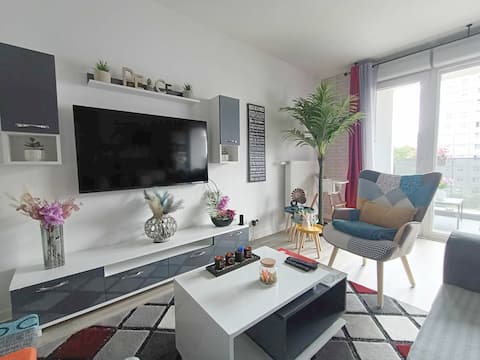
4 room apartment ~ La Rose des Yvelines ~ classified 3*
Entire Place • 3 bedrooms
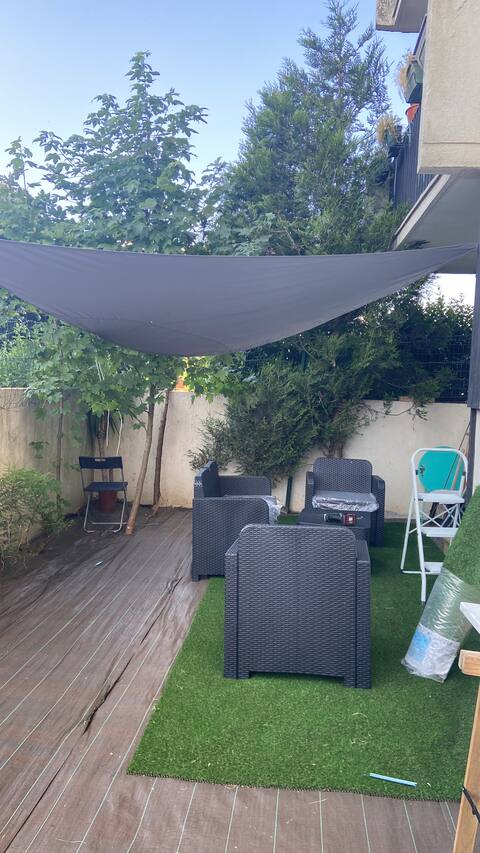
Appartement
Entire Place • 1 bedroom
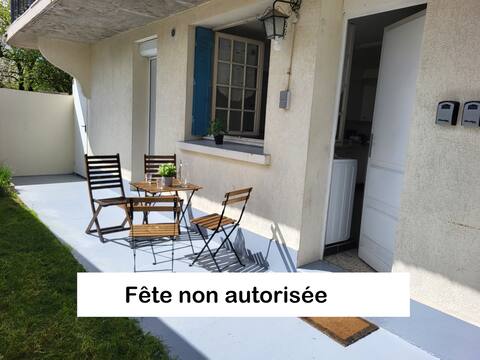
K1 Ground floor apartment: 6 beds with parking
Entire Place • 1 bedroom
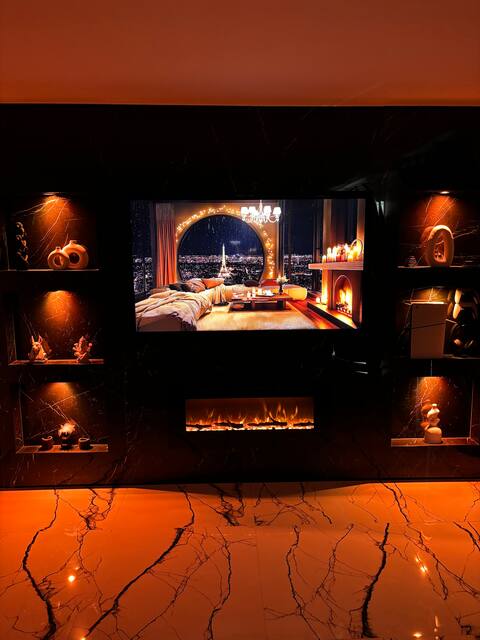
Marble Lights
Entire Place • 1 bedroom
BB 1 5-bed apartment with private parking
Entire Place • 1 bedroom

Cozy T2 with balcony and private parking
Entire Place • 1 bedroom
Note: Performance varies based on location, size, amenities, seasonality, and management quality. Data reflects the past 12 months.
Top Performing Airbnb Hosts in Trappes (2025)
Learn from the best! This table showcases top-performing Airbnb hosts in Trappes based on the number of properties managed and estimated total revenue over the past year. Analyze their scale and performance metrics.
| Host Name | Properties | Grossing Revenue | Stay Reviews | Avg Rating |
|---|---|---|---|---|
| Aurélie Et Mathieu | 10 | $133,206 | 249 | 4.75/5.0 |
| Aurélie Et Mathieu | 4 | $77,636 | 61 | 4.73/5.0 |
| Walid | 1 | $36,166 | 34 | 4.85/5.0 |
| Host #19277004 | 1 | $35,331 | 0 | 0.00/5.0 |
| Hakim | 1 | $25,450 | 80 | 4.94/5.0 |
| Lucie | 1 | $23,309 | 32 | 4.72/5.0 |
| Eddy | 1 | $22,818 | 46 | 4.72/5.0 |
| Cyril | 2 | $19,091 | 215 | 4.94/5.0 |
| Solène | 2 | $18,552 | 16 | 2.50/5.0 |
| Lucie | 1 | $18,204 | 18 | 4.83/5.0 |
Analyzing the strategies of top hosts, such as their property selection, pricing, and guest communication, can offer valuable lessons for optimizing your own Airbnb operations in Trappes.
Dive Deeper: Advanced Trappes STR Market Data (2025)
Ready to unlock more insights? AirROI provides access to advanced metrics and comprehensive Airbnb data for Trappes. Explore detailed analytics beyond this report to refine your investment strategy, optimize pricing, and maximize your vacation rental profits.
Explore Advanced MetricsTrappes Short-Term Rental Market Composition (2025): Property & Room Types
Room Type Distribution
Property Type Distribution
Market Composition Insights for Trappes
- The Trappes Airbnb market composition is heavily skewed towards Entire Home/Apt listings, which make up 75% of the 72 active rentals. This indicates strong guest preference for privacy and space.
- Looking at the property type distribution in Trappes, Apartment/Condo properties are the most common (83.3%), reflecting the local real estate landscape.
- Smaller segments like hotel/boutique (combined 4.2%) offer potential for unique stay experiences.
Trappes Airbnb Room Capacity Analysis (2025): Bedroom Distribution
Distribution of Listings by Number of Bedrooms
Room Capacity Insights for Trappes
- The dominant room capacity in Trappes is 1 bedroom listings, making up 52.8% of the market. This suggests a strong demand for properties suitable for couples or solo travelers.
- Together, 1 bedroom and 2 bedrooms properties represent 66.7% of the active Airbnb listings in Trappes, indicating a high concentration in these sizes.
- With over half the market (52.8%) consisting of studios or 1-bedroom units, Trappes is particularly well-suited for individuals or couples.
- Listings with 3+ bedrooms (9.8%) represent a smaller niche, potentially indicating an underserved market for larger group accommodations in Trappes.
Trappes Vacation Rental Guest Capacity Trends (2025)
Distribution of Listings by Guest Capacity
Guest Capacity Insights for Trappes
- The most common guest capacity trend in Trappes vacation rentals is listings accommodating 2 guests (27.8%). This suggests the primary traveler segment is likely couples or solo travelers.
- Properties designed for 2 guests and 4 guests dominate the Trappes STR market, accounting for 51.4% of listings.
- 15.3% of properties accommodate 6+ guests, serving the market segment for larger families or group travel in Trappes.
- On average, properties in Trappes are equipped to host 3.3 guests.
Trappes Airbnb Booking Patterns (2025): Available vs. Booked Days
Available Days Distribution
Booked Days Distribution
Booking Pattern Insights for Trappes
- The most common availability pattern in Trappes falls within the 271-366 days range, representing 63.9% of listings. This suggests many properties have significant open periods on their calendars.
- Approximately 86.1% of listings show high availability (181+ days open annually), indicating potential for increased bookings or specific owner usage patterns.
- For booked days, the 1-30 days range is most frequent in Trappes (33.3%), reflecting common guest stay durations or potential owner blocking patterns.
- A notable 15.3% of properties secure long booking periods (181+ days booked per year), highlighting successful long-term rental strategies or significant owner usage.
Trappes Airbnb Minimum Stay Requirements Analysis
Distribution of Listings by Minimum Night Requirement
1 Night
36 listings
63.2% of total
2 Nights
15 listings
26.3% of total
3 Nights
4 listings
7% of total
30+ Nights
2 listings
3.5% of total
Key Insights
- The most prevalent minimum stay requirement in Trappes is 1 Night, adopted by 63.2% of listings. This highlights the market's preference for shorter, flexible bookings.
- A strong majority (89.5%) of the Trappes Airbnb data shows acceptance of very short stays (1-2 nights), indicating a dynamic, high-turnover market.
Recommendations
- Align with the market by considering a 1 Night minimum stay, as 63.2% of Trappes hosts use this setting.
- Adjust minimum nights based on seasonality – potentially shorter during low season and longer during peak demand periods in Trappes.
Trappes Airbnb Cancellation Policy Trends Analysis (2025)
Flexible
8 listings
22.2% of total
Moderate
21 listings
58.3% of total
Firm
2 listings
5.6% of total
Strict
5 listings
13.9% of total
Cancellation Policy Insights for Trappes
- The prevailing Airbnb cancellation policy trend in Trappes is Moderate, used by 58.3% of listings.
- The market strongly favors guest-friendly terms, with 80.5% of listings offering Flexible or Moderate policies. This suggests guests in Trappes may expect booking flexibility.
Recommendations for Hosts
- Consider adopting a Moderate policy to align with the 58.3% market standard in Trappes.
- Using a Strict policy might deter some guests, as only 13.9% of listings use it. Evaluate if potential revenue protection outweighs possible lower booking rates.
- Regularly review your cancellation policy against competitors and market demand shifts in Trappes.
Trappes STR Booking Lead Time Analysis (2025)
Average Booking Lead Time by Month
Booking Lead Time Insights for Trappes
- The overall average booking lead time for vacation rentals in Trappes is 19 days.
- Guests book furthest in advance for stays during July (average 150 days), likely coinciding with peak travel demand or local events.
- The shortest booking windows occur for stays in May (average 14 days), indicating more last-minute travel plans during this time.
- Seasonally, Summer (76 days avg.) sees the longest lead times, while Winter (17 days avg.) has the shortest, reflecting typical travel planning cycles.
Recommendations for Hosts
- Use the overall average lead time (19 days) as a baseline for your pricing and availability strategy in Trappes.
- For July stays, consider implementing length-of-stay discounts or slightly higher rates for bookings made less than 150 days out to capitalize on advance planning.
- Target marketing efforts for the Summer season well in advance (at least 76 days) to capture early planners.
- Monitor your own booking lead times against these Trappes averages to identify opportunities for dynamic pricing adjustments.
Popular & Essential Airbnb Amenities in Trappes (2025)
Amenity Prevalence
Amenity Insights for Trappes
- Essential amenities in Trappes that guests expect include: TV, Kitchen. Lacking these (any) could significantly impact bookings.
- Popular amenities like Hot water, Smoke alarm, Heating are common but not universal. Offering these can provide a competitive edge.
- Warning: Wifi is not universally provided but is considered essential globally. Ensure reliable Wifi is offered.
Recommendations for Hosts
- Ensure your listing includes all essential amenities for Trappes: TV, Kitchen.
- Prioritize adding missing essentials: TV, Kitchen.
- Consider adding popular differentiators like Hot water or Smoke alarm to increase appeal.
- Highlight unique or less common amenities you offer (e.g., hot tub, dedicated workspace, EV charger) in your listing description and photos.
- Regularly check competitor amenities in Trappes to stay competitive.
Trappes Airbnb Guest Demographics & Profile Analysis (2025)
Guest Profile Summary for Trappes
- The typical guest profile for Airbnb in Trappes consists of primarily domestic travelers (81%), often arriving from nearby Paris, typically belonging to the Post-2000s (Gen Z/Alpha) group (50%), primarily speaking French or English.
- Domestic travelers account for 81.3% of guests.
- Key international markets include France (81.3%) and Germany (3.7%).
- Top languages spoken are French (43.3%) followed by English (29.3%).
- A significant demographic segment is the Post-2000s (Gen Z/Alpha) group, representing 50% of guests.
Recommendations for Hosts
- Target domestic marketing efforts towards travelers from Paris and Thourotte.
- Tailor amenities and listing descriptions to appeal to the dominant Post-2000s (Gen Z/Alpha) demographic (e.g., highlight fast WiFi, smart home features, local guides).
- Highlight unique local experiences or amenities relevant to the primary guest profile.
- Consider seasonal promotions aligned with peak travel times for key origin markets.
Nearby Short-Term Rental Market Comparison
How does the Trappes Airbnb market stack up against its neighbors? Compare key performance metrics like average monthly revenue, ADR, and occupancy rates in surrounding areas to understand the broader regional STR landscape.
| Market | Active Properties | Monthly Revenue | Daily Rate | Avg. Occupancy |
|---|---|---|---|---|
| Morienval | 10 | $5,794 | $400.84 | 32% |
| La Poterie-Cap-d'Antifer | 11 | $5,076 | $293.95 | 55% |
| Bonneville-sur-Touques | 16 | $3,903 | $367.00 | 40% |
| Luneray | 12 | $3,745 | $526.24 | 42% |
| La Couture-Boussey | 12 | $3,620 | $378.08 | 28% |
| Dourdan | 15 | $3,576 | $223.06 | 52% |
| Rosoy-en-Multien | 15 | $3,558 | $367.61 | 51% |
| Millançay | 11 | $3,476 | $370.42 | 39% |
| Saint-Étienne-la-Thillaye | 24 | $3,459 | $325.89 | 42% |
| Cricquebœuf | 10 | $3,417 | $268.29 | 46% |