Camelford Airbnb Market Analysis 2025: Short Term Rental Data & Vacation Rental Statistics in England, United Kingdom
Is Airbnb profitable in Camelford in 2025? Explore comprehensive Airbnb analytics for Camelford, England, United Kingdom to uncover income potential. This 2025 STR market report for Camelford, based on AirROI data from April 2024 to March 2025, reveals key trends in the niche market of 71 active listings.
Whether you're considering an Airbnb investment in Camelford, optimizing your existing vacation rental, or exploring rental arbitrage opportunities, understanding the Camelford Airbnb data is crucial. Leveraging the low regulation environment is key to maximizing your short term rental income potential. Let's dive into the specifics.
Key Camelford Airbnb Performance Metrics Overview
Monthly Airbnb Revenue Variations & Income Potential in Camelford (2025)
Understanding the monthly revenue variations for Airbnb listings in Camelford is key to maximizing your short term rental income potential. Seasonality significantly impacts earnings. Our analysis, based on data from the past 12 months, shows that the peak revenue month for STRs in Camelford is typically August, while March often presents the lowest earnings, highlighting opportunities for strategic pricing adjustments during shoulder and low seasons. Explore the typical Airbnb income in Camelford across different performance tiers:
- Best-in-class properties (Top 10%) achieve $3,637+ monthly, often utilizing dynamic pricing and superior guest experiences.
- Strong performing properties (Top 25%) earn $2,303 or more, indicating effective management and desirable locations/amenities.
- Typical properties (Median) generate around $1,299 per month, representing the average market performance.
- Entry-level properties (Bottom 25%) see earnings around $560, often with potential for optimization.
Average Monthly Airbnb Earnings Trend in Camelford
Camelford Airbnb Occupancy Rate Trends (2025)
Maximize your bookings by understanding the Camelford STR occupancy trends. Seasonal demand shifts significantly influence how often properties are booked. Typically, Augustsees the highest demand (peak season occupancy), while March experiences the lowest (low season). Effective strategies, like adjusting minimum stays or offering promotions, can boost occupancy during slower periods. Here's how different property tiers perform in Camelford:
- Best-in-class properties (Top 10%) achieve 70%+ occupancy, indicating high desirability and potentially optimized availability.
- Strong performing properties (Top 25%) maintain 50% or higher occupancy, suggesting good market fit and guest satisfaction.
- Typical properties (Median) have an occupancy rate around 30%.
- Entry-level properties (Bottom 25%) average 14% occupancy, potentially facing higher vacancy.
Average Monthly Occupancy Rate Trend in Camelford
Average Daily Rate (ADR) Airbnb Trends in Camelford (2025)
Effective short term rental pricing strategy in Camelford involves understanding monthly ADR fluctuations. The Average Daily Rate (ADR) for Airbnb in Camelford typically peaks in August and dips lowest during March. Leveraging Airbnb dynamic pricing tools or strategies based on this seasonality can significantly boost revenue. Here's a look at the typical nightly rates achieved:
- Best-in-class properties (Top 10%) command rates of $288+ per night, often due to premium features or locations.
- Strong performing properties (Top 25%) achieve nightly rates of $179 or more.
- Typical properties (Median) charge around $123 per night.
- Entry-level properties (Bottom 25%) earn around $93 per night.
Average Daily Rate (ADR) Trend by Month in Camelford
Get Live Camelford Market Intelligence 👇

Explore Real-time Analytics
Airbnb Seasonality Analysis & Trends in Camelford (2025)
Peak Season (August, May, June)
- Revenue averages $2,746 per month
- Occupancy rates average 45.2%
- Daily rates average $172
Shoulder Season
- Revenue averages $1,727 per month
- Occupancy maintains around 34.1%
- Daily rates hold near $166
Low Season (January, February, March)
- Revenue drops to average $1,108 per month
- Occupancy decreases to average 26.1%
- Daily rates adjust to average $156
Seasonality Insights for Camelford
- The Airbnb seasonality in Camelford shows highly seasonal trends requiring careful strategy. While the sections above show seasonal averages, it's also insightful to look at the extremes:
- During the high season, the absolute peak month showcases Camelford's highest earning potential, with monthly revenues capable of climbing to $3,114, occupancy reaching a high of 57.1%, and ADRs peaking at $177.
- Conversely, the slowest single month of the year, typically falling within the low season, marks the market's lowest point. In this month, revenue might dip to $1,010, occupancy could drop to 24.7%, and ADRs may adjust down to $154.
- Understanding both the seasonal averages and these monthly peaks and troughs in revenue, occupancy, and ADR is crucial for maximizing your Airbnb profit potential in Camelford.
Seasonal Strategies for Maximizing Profit
- Peak Season: Maximize revenue through premium pricing and potentially longer minimum stays. Ensure high availability.
- Low Season: Offer competitive pricing, special promotions (e.g., extended stay discounts), and flexible cancellation policies. Target off-season travelers like remote workers or budget-conscious guests.
- Shoulder Seasons: Implement dynamic pricing that balances peak and low rates. Target weekend travelers or specific events. Offer slightly more flexible terms than peak season.
- Regularly analyze your own performance against these Camelford seasonality benchmarks and adjust your pricing and availability strategy accordingly.
Best Areas for Airbnb Investment in Camelford (2025)
Exploring the top neighborhoods for short-term rentals in Camelford? This section highlights key areas, outlining why they are attractive for hosts and guests, along with notable local attractions. Consider these locations based on your target guest profile and investment strategy.
| Neighborhood / Area | Why Host Here? (Target Guests & Appeal) | Key Attractions & Landmarks |
|---|---|---|
| Camelford Town Center | The heart of Camelford, with easy access to shops, cafes, and local attractions. Ideal for tourists looking for a central base to explore North Cornwall. | Camelford Museum, Summerleaze Beach, Tregardock Beach, Rough Tor, The Old Post Office |
| Bodmin Moor | Stunning natural landscape, perfect for outdoor enthusiasts and hikers. Attracts visitors interested in nature and tranquility. | Brown Willy, Rough Tor, Druid Circles, Golitha Falls, Bodmin Moor |
| Tintagel | Historic village known for the legendary King Arthur's castle. A popular destination for tourists interested in history and mythology. | Tintagel Castle, Merlin's Cave, King Arthur's Great Halls, Tintagel Haven, Bossiney Cove |
| Port Isaac | Picturesque fishing village renowned for its charming streets and beautiful coastline. Attracts families and those looking for scenic views. | Port Isaac Harbour, Doc Martin filming location, The Platt, The Old School Hotel, Port Gaverne |
| Wadebridge | A gateway to the Camel Trail and nearby beaches, perfect for those wanting to cycle or explore the coast. Great for active tourists. | Camel Valley Vineyard, Camel Trail, Wadebridge Town, Egloshayle Church, The Olde House |
| Pencarrow House and Garden | A delightful historic estate with beautiful gardens, ideal for visitors seeking a day out in nature and history. | Pencarrow House, Gardens, Cadwalader's Ice Cream, Historic walks, Nature Trails |
| Boscastle | Quaint harbor village known for its stunning cliffs and coastal walks. Great for tourists who appreciate history and scenic views. | Boscastle Harbour, The Museum of Witchcraft and Magic, Coastal Walks, St. Juliot Church, Forrabury Chapel |
| Padstow | Famous for its seafood and beautiful harbor, Padstow is a bustling tourist destination with plenty of restaurants and beaches. | Padstow Harbour, Restaurant Nathan Outlaw, Camel Estuary, St. George's Cove, The Camel Trail |
Understanding Airbnb License Requirements & STR Laws in Camelford (2025)
While Camelford, England, United Kingdom currently shows low STR regulations, specific Airbnb license requirements might still exist or change. Always verify the latest short term rental regulations and Airbnb license requirements directly with local government authorities for Camelford to ensure full compliance before hosting.
(Source: AirROI data, 2025, finding no licensed listings among those analyzed)
Top Performing Airbnb Properties in Camelford (2025)
Benchmark your potential! Explore examples of top-performing Airbnb properties in Camelfordbased on Trailing Twelve Month (TTM) revenue. Analyze their characteristics, revenue, occupancy rate, and ADR to understand what drives success in this market.
Polmear Barn
Entire Place • 6 bedrooms

Thyme at the Old Herbery - 2 Ensuite Bedrooms
Entire Place • 2 bedrooms
Rustic converted Mill for 10 - explore Cornwall
Entire Place • 5 bedrooms
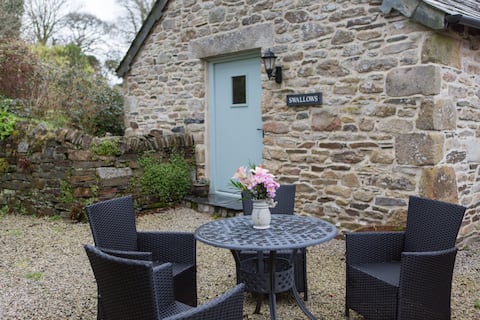
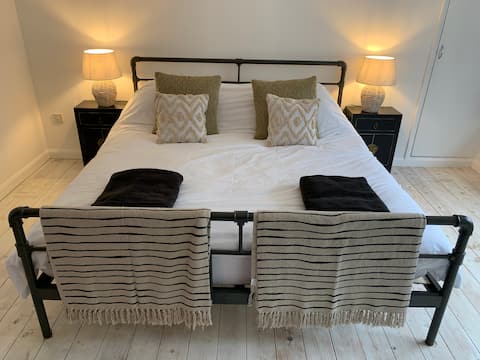
Cornish Swallows Barn, between Bude & Padstow
Entire Place • 2 bedrooms

Little Cobbetts
Entire Place • 2 bedrooms

Cosy Cornish Yew Tree Barn, rural walks from door
Entire Place • 1 bedroom
Note: Performance varies based on location, size, amenities, seasonality, and management quality. Data reflects the past 12 months.
Top Performing Airbnb Hosts in Camelford (2025)
Learn from the best! This table showcases top-performing Airbnb hosts in Camelford based on the number of properties managed and estimated total revenue over the past year. Analyze their scale and performance metrics.
| Host Name | Properties | Grossing Revenue | Stay Reviews | Avg Rating |
|---|---|---|---|---|
| Cottages | 2 | $161,945 | 7 | 2.50/5.0 |
| Helen | 4 | $110,947 | 282 | 4.90/5.0 |
| Kasey | 9 | $80,955 | 215 | 3.25/5.0 |
| Lara | 2 | $72,456 | 119 | 4.98/5.0 |
| Vay-Cays | 9 | $65,731 | 12 | 1.93/5.0 |
| Mark | 2 | $38,752 | 119 | 5.00/5.0 |
| Louise | 1 | $36,892 | 99 | 4.82/5.0 |
| StayStaycations | 2 | $33,706 | 154 | 4.60/5.0 |
| Sally | 1 | $33,127 | 132 | 4.92/5.0 |
| James | 1 | $28,747 | 201 | 4.94/5.0 |
Analyzing the strategies of top hosts, such as their property selection, pricing, and guest communication, can offer valuable lessons for optimizing your own Airbnb operations in Camelford.
Dive Deeper: Advanced Camelford STR Market Data (2025)
Ready to unlock more insights? AirROI provides access to advanced metrics and comprehensive Airbnb data for Camelford. Explore detailed analytics beyond this report to refine your investment strategy, optimize pricing, and maximize your vacation rental profits.
Explore Advanced MetricsCamelford Short-Term Rental Market Composition (2025): Property & Room Types
Room Type Distribution
Property Type Distribution
Market Composition Insights for Camelford
- The Camelford Airbnb market composition is heavily skewed towards Entire Home/Apt listings, which make up 81.7% of the 71 active rentals. This indicates strong guest preference for privacy and space.
- Looking at the property type distribution in Camelford, House properties are the most common (54.9%), reflecting the local real estate landscape.
- Houses represent a significant 54.9% portion, catering likely to families or larger groups.
- The presence of 18.3% Hotel/Boutique listings indicates integration with traditional hospitality.
- Smaller segments like others (combined 1.4%) offer potential for unique stay experiences.
Camelford Airbnb Room Capacity Analysis (2025): Bedroom Distribution
Distribution of Listings by Number of Bedrooms
Room Capacity Insights for Camelford
- The dominant room capacity in Camelford is 1 bedroom listings, making up 46.5% of the market. This suggests a strong demand for properties suitable for couples or solo travelers.
- Together, 1 bedroom and 2 bedrooms properties represent 64.8% of the active Airbnb listings in Camelford, indicating a high concentration in these sizes.
- A significant 29.5% of listings offer 3+ bedrooms, catering to larger groups and families seeking more space in Camelford.
Camelford Vacation Rental Guest Capacity Trends (2025)
Distribution of Listings by Guest Capacity
Guest Capacity Insights for Camelford
- The most common guest capacity trend in Camelford vacation rentals is listings accommodating 2 guests (40.8%). This suggests the primary traveler segment is likely couples or solo travelers.
- Properties designed for 2 guests and 6 guests dominate the Camelford STR market, accounting for 56.3% of listings.
- A significant 40.8% of listings cater specifically to 1-2 guests, highlighting strong demand from couples and solo travelers in Camelford.
- 29.6% of properties accommodate 6+ guests, serving the market segment for larger families or group travel in Camelford.
- On average, properties in Camelford are equipped to host 3.9 guests.
Camelford Airbnb Booking Patterns (2025): Available vs. Booked Days
Available Days Distribution
Booked Days Distribution
Booking Pattern Insights for Camelford
- The most common availability pattern in Camelford falls within the 271-366 days range, representing 59.2% of listings. This suggests many properties have significant open periods on their calendars.
- Approximately 88.8% of listings show high availability (181+ days open annually), indicating potential for increased bookings or specific owner usage patterns.
- For booked days, the 31-90 days range is most frequent in Camelford (43.7%), reflecting common guest stay durations or potential owner blocking patterns.
- A notable 14.1% of properties secure long booking periods (181+ days booked per year), highlighting successful long-term rental strategies or significant owner usage.
Camelford Airbnb Minimum Stay Requirements Analysis
Distribution of Listings by Minimum Night Requirement
1 Night
19 listings
29.2% of total
2 Nights
15 listings
23.1% of total
3 Nights
19 listings
29.2% of total
4-6 Nights
5 listings
7.7% of total
7-29 Nights
1 listings
1.5% of total
30+ Nights
6 listings
9.2% of total
Key Insights
- The most prevalent minimum stay requirement in Camelford is 1 Night, adopted by 29.2% of listings. This highlights the market's preference for shorter, flexible bookings.
Recommendations
- Align with the market by considering a 1 Night minimum stay, as 29.2% of Camelford hosts use this setting.
- If feasible, allowing 1-night stays, especially midweek or during low season, could capture last-minute bookings, as only 29.2% currently do.
- Explore offering discounts for stays of 30+ nights to attract the 9.2% of the market seeking extended stays.
- Adjust minimum nights based on seasonality – potentially shorter during low season and longer during peak demand periods in Camelford.
Camelford Airbnb Cancellation Policy Trends Analysis (2025)
Super Strict 60 Days
4 listings
7.5% of total
Flexible
9 listings
17% of total
Moderate
7 listings
13.2% of total
Firm
7 listings
13.2% of total
Strict
26 listings
49.1% of total
Cancellation Policy Insights for Camelford
- The prevailing Airbnb cancellation policy trend in Camelford is Strict, used by 49.1% of listings.
- A majority (62.3%) of hosts in Camelford utilize Firm or Strict policies, indicating a market where hosts prioritize booking security.
Recommendations for Hosts
- Consider adopting a Strict policy to align with the 49.1% market standard in Camelford.
- With 49.1% using Strict terms, this is a viable option in Camelford, particularly for high-value properties or during peak demand periods.
- Regularly review your cancellation policy against competitors and market demand shifts in Camelford.
Camelford STR Booking Lead Time Analysis (2025)
Average Booking Lead Time by Month
Booking Lead Time Insights for Camelford
- The overall average booking lead time for vacation rentals in Camelford is 64 days.
- Guests book furthest in advance for stays during June (average 116 days), likely coinciding with peak travel demand or local events.
- The shortest booking windows occur for stays in March (average 23 days), indicating more last-minute travel plans during this time.
- Seasonally, Summer (88 days avg.) sees the longest lead times, while Winter (54 days avg.) has the shortest, reflecting typical travel planning cycles.
Recommendations for Hosts
- Use the overall average lead time (64 days) as a baseline for your pricing and availability strategy in Camelford.
- For June stays, consider implementing length-of-stay discounts or slightly higher rates for bookings made less than 116 days out to capitalize on advance planning.
- Target marketing efforts for the Summer season well in advance (at least 88 days) to capture early planners.
- Monitor your own booking lead times against these Camelford averages to identify opportunities for dynamic pricing adjustments.
Popular & Essential Airbnb Amenities in Camelford (2025)
Amenity Prevalence
Amenity Insights for Camelford
- Essential amenities in Camelford that guests expect include: Wifi, TV, Smoke alarm. Lacking these (any) could significantly impact bookings.
- Popular amenities like Hot water, Essentials, Heating are common but not universal. Offering these can provide a competitive edge.
Recommendations for Hosts
- Ensure your listing includes all essential amenities for Camelford: Wifi, TV, Smoke alarm.
- Prioritize adding missing essentials: TV, Smoke alarm.
- Consider adding popular differentiators like Hot water or Essentials to increase appeal.
- Highlight unique or less common amenities you offer (e.g., hot tub, dedicated workspace, EV charger) in your listing description and photos.
- Regularly check competitor amenities in Camelford to stay competitive.
Camelford Airbnb Guest Demographics & Profile Analysis (2025)
Guest Profile Summary for Camelford
- The typical guest profile for Airbnb in Camelford consists of primarily domestic travelers (83%), often arriving from nearby England, typically belonging to the Post-2000s (Gen Z/Alpha) group (50%), primarily speaking English or German.
- Domestic travelers account for 83.2% of guests.
- Key international markets include United Kingdom (83.2%) and United States (4.3%).
- Top languages spoken are English (65.4%) followed by German (7.7%).
- A significant demographic segment is the Post-2000s (Gen Z/Alpha) group, representing 50% of guests.
Recommendations for Hosts
- Target domestic marketing efforts towards travelers from England and London.
- Tailor amenities and listing descriptions to appeal to the dominant Post-2000s (Gen Z/Alpha) demographic (e.g., highlight fast WiFi, smart home features, local guides).
- Highlight unique local experiences or amenities relevant to the primary guest profile.
- Consider seasonal promotions aligned with peak travel times for key origin markets.
Nearby Short-Term Rental Market Comparison
How does the Camelford Airbnb market stack up against its neighbors? Compare key performance metrics like average monthly revenue, ADR, and occupancy rates in surrounding areas to understand the broader regional STR landscape.
| Market | Active Properties | Monthly Revenue | Daily Rate | Avg. Occupancy |
|---|---|---|---|---|
| Llanrhidian | 15 | $4,842 | $386.18 | 53% |
| Crai | 20 | $4,799 | $371.85 | 46% |
| Trenance | 19 | $4,795 | $428.63 | 43% |
| Angle | 13 | $4,602 | $384.81 | 42% |
| Ludchurch | 15 | $4,354 | $291.87 | 43% |
| Redberth | 29 | $4,103 | $223.37 | 59% |
| Higher Crackington | 17 | $3,731 | $340.74 | 37% |
| Milverton | 11 | $3,675 | $393.89 | 37% |
| Pennorth | 13 | $3,595 | $417.69 | 37% |
| Gilwern | 22 | $3,505 | $193.56 | 53% |