Lythe Airbnb Market Analysis 2025: Short Term Rental Data & Vacation Rental Statistics in England, United Kingdom
Is Airbnb profitable in Lythe in 2025? Explore comprehensive Airbnb analytics for Lythe, England, United Kingdom to uncover income potential. This 2025 STR market report for Lythe, based on AirROI data from April 2024 to March 2025, reveals key trends in the niche market of 33 active listings.
Whether you're considering an Airbnb investment in Lythe, optimizing your existing vacation rental, or exploring rental arbitrage opportunities, understanding the Lythe Airbnb data is crucial. Leveraging the low regulation environment is key to maximizing your short term rental income potential. Let's dive into the specifics.
Key Lythe Airbnb Performance Metrics Overview
Monthly Airbnb Revenue Variations & Income Potential in Lythe (2025)
Understanding the monthly revenue variations for Airbnb listings in Lythe is key to maximizing your short term rental income potential. Seasonality significantly impacts earnings. Our analysis, based on data from the past 12 months, shows that the peak revenue month for STRs in Lythe is typically August, while March often presents the lowest earnings, highlighting opportunities for strategic pricing adjustments during shoulder and low seasons. Explore the typical Airbnb income in Lythe across different performance tiers:
- Best-in-class properties (Top 10%) achieve $8,249+ monthly, often utilizing dynamic pricing and superior guest experiences.
- Strong performing properties (Top 25%) earn $5,758 or more, indicating effective management and desirable locations/amenities.
- Typical properties (Median) generate around $3,936 per month, representing the average market performance.
- Entry-level properties (Bottom 25%) see earnings around $2,119, often with potential for optimization.
Average Monthly Airbnb Earnings Trend in Lythe
Lythe Airbnb Occupancy Rate Trends (2025)
Maximize your bookings by understanding the Lythe STR occupancy trends. Seasonal demand shifts significantly influence how often properties are booked. Typically, Augustsees the highest demand (peak season occupancy), while March experiences the lowest (low season). Effective strategies, like adjusting minimum stays or offering promotions, can boost occupancy during slower periods. Here's how different property tiers perform in Lythe:
- Best-in-class properties (Top 10%) achieve 81%+ occupancy, indicating high desirability and potentially optimized availability.
- Strong performing properties (Top 25%) maintain 63% or higher occupancy, suggesting good market fit and guest satisfaction.
- Typical properties (Median) have an occupancy rate around 43%.
- Entry-level properties (Bottom 25%) average 22% occupancy, potentially facing higher vacancy.
Average Monthly Occupancy Rate Trend in Lythe
Average Daily Rate (ADR) Airbnb Trends in Lythe (2025)
Effective short term rental pricing strategy in Lythe involves understanding monthly ADR fluctuations. The Average Daily Rate (ADR) for Airbnb in Lythe typically peaks in July and dips lowest during November. Leveraging Airbnb dynamic pricing tools or strategies based on this seasonality can significantly boost revenue. Here's a look at the typical nightly rates achieved:
- Best-in-class properties (Top 10%) command rates of $512+ per night, often due to premium features or locations.
- Strong performing properties (Top 25%) achieve nightly rates of $405 or more.
- Typical properties (Median) charge around $270 per night.
- Entry-level properties (Bottom 25%) earn around $201 per night.
Average Daily Rate (ADR) Trend by Month in Lythe
Get Live Lythe Market Intelligence 👇

Explore Real-time Analytics
Airbnb Seasonality Analysis & Trends in Lythe (2025)
Peak Season (August, July, September)
- Revenue averages $5,910 per month
- Occupancy rates average 57.8%
- Daily rates average $353
Shoulder Season
- Revenue averages $4,191 per month
- Occupancy maintains around 43.8%
- Daily rates hold near $325
Low Season (January, February, March)
- Revenue drops to average $2,834 per month
- Occupancy decreases to average 35.0%
- Daily rates adjust to average $297
Seasonality Insights for Lythe
- The Airbnb seasonality in Lythe shows highly seasonal trends requiring careful strategy. While the sections above show seasonal averages, it's also insightful to look at the extremes:
- During the high season, the absolute peak month showcases Lythe's highest earning potential, with monthly revenues capable of climbing to $7,127, occupancy reaching a high of 67.2%, and ADRs peaking at $358.
- Conversely, the slowest single month of the year, typically falling within the low season, marks the market's lowest point. In this month, revenue might dip to $2,517, occupancy could drop to 30.9%, and ADRs may adjust down to $282.
- Understanding both the seasonal averages and these monthly peaks and troughs in revenue, occupancy, and ADR is crucial for maximizing your Airbnb profit potential in Lythe.
Seasonal Strategies for Maximizing Profit
- Peak Season: Maximize revenue through premium pricing and potentially longer minimum stays. Ensure high availability.
- Low Season: Offer competitive pricing, special promotions (e.g., extended stay discounts), and flexible cancellation policies. Target off-season travelers like remote workers or budget-conscious guests.
- Shoulder Seasons: Implement dynamic pricing that balances peak and low rates. Target weekend travelers or specific events. Offer slightly more flexible terms than peak season.
- Regularly analyze your own performance against these Lythe seasonality benchmarks and adjust your pricing and availability strategy accordingly.
Best Areas for Airbnb Investment in Lythe (2025)
Exploring the top neighborhoods for short-term rentals in Lythe? This section highlights key areas, outlining why they are attractive for hosts and guests, along with notable local attractions. Consider these locations based on your target guest profile and investment strategy.
| Neighborhood / Area | Why Host Here? (Target Guests & Appeal) | Key Attractions & Landmarks |
|---|---|---|
| Lythe Village | Charming village with picturesque streets and a peaceful atmosphere. Ideal for guests looking for a quiet retreat, while still being close to the coast. | St. Oswald's Church, Lythe Beach, North York Moors National Park, Nearby Whitby, Cleveland Way, Local pubs and restaurants |
| Whitby | Popular coastal town known for its beautiful harbor, historic abbey and exciting seaside activities. A top-notch location for tourists and history buffs. | Whitby Abbey, North Yorkshire Moors Railway, Whitby Harbour, Dracula Experience, Captain Cook Memorial Museum, Scarborough Beach |
| Robin Hood's Bay | Stunning coastal village with narrow streets and breathtaking views. A favorite spot for hikers and nature lovers. | Robins Hood's Bay Beach, Coastal Walks, National Trust Sites, Local shops and cafes, Fishing opportunities, Historic buildings |
| Goathland | Famous as the setting for 'Heartbeat' and known for its scenic moorland. Attracts fans of the show and outdoor enthusiasts alike. | Goathland Station, Mallyan Spout Waterfall, North York Moors National Park, Historical walks, Local cafes, Steam railway |
| Sleights | Small village with a community feel, offering peaceful surroundings yet close to larger towns like Whitby. | Fossil hunting, Views of the Esk Valley, Local shops, Nearby Whitby attractions, Walking trails, Village pubs |
| Staithes | Picturesque fishing village famous for its cliffs and art community. Great for coastal walks and charming scenery. | Staithes Harbour, Saltburn Pier, Local art studios, Fishing trips, Beachcombing, Historic sites |
| Saltburn-by-the-Sea | Seaside resort known for its Victorian architecture and sandy beaches. Excellent for families and beach lovers. | Saltburn Pier, Saltburn Beach, Valley Gardens, Local shops and cafes, Surfing activities, Historic cliff lift |
| Marske-by-the-Sea | Coastal village with sandy beaches and a friendly local community, perfect for a family getaway. | Marske Beach, The Old Watermill, Coastal Nature Reserve, Nearby Redcar, Local dining options, Easy access to Middlesbrough |
Understanding Airbnb License Requirements & STR Laws in Lythe (2025)
While Lythe, England, United Kingdom currently shows low STR regulations, specific Airbnb license requirements might still exist or change. Always verify the latest short term rental regulations and Airbnb license requirements directly with local government authorities for Lythe to ensure full compliance before hosting.
(Source: AirROI data, 2025, finding no licensed listings among those analyzed)
Top Performing Airbnb Properties in Lythe (2025)
Benchmark your potential! Explore examples of top-performing Airbnb properties in Lythebased on Trailing Twelve Month (TTM) revenue. Analyze their characteristics, revenue, occupancy rate, and ADR to understand what drives success in this market.
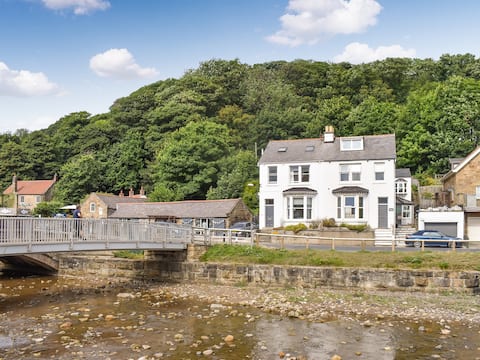
South Villa
Entire Place • 4 bedrooms

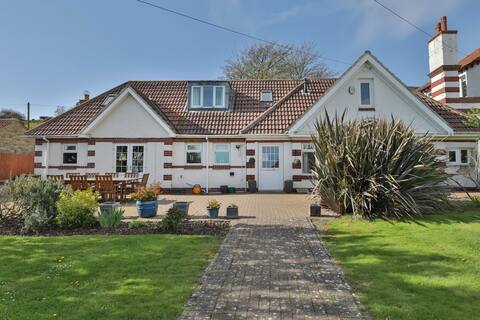
Sea View 5 Bedroom Holiday Let on the Yorks Coast
Entire Place • 5 bedrooms
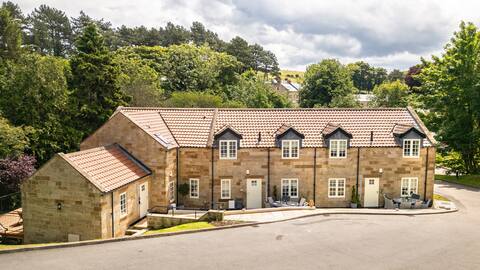
Sandsend House 5 Bedrooms/5 Bathrooms, Sea views.
Entire Place • 5 bedrooms
Sag Harbour
Entire Place • 3 bedrooms
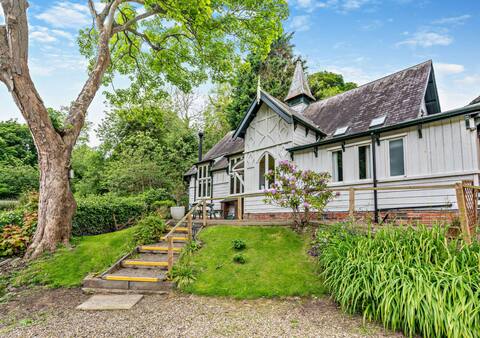
The School House Sandsend
Entire Place • 3 bedrooms
Sunnybank - Sandsend, Whitby, North Yorkshire
Entire Place • 3 bedrooms
Note: Performance varies based on location, size, amenities, seasonality, and management quality. Data reflects the past 12 months.
Top Performing Airbnb Hosts in Lythe (2025)
Learn from the best! This table showcases top-performing Airbnb hosts in Lythe based on the number of properties managed and estimated total revenue over the past year. Analyze their scale and performance metrics.
| Host Name | Properties | Grossing Revenue | Stay Reviews | Avg Rating |
|---|---|---|---|---|
| Ingrid Flute'S Yorks Hol Cotta | 6 | $202,369 | 16 | 3.14/5.0 |
| Cottages | 5 | $198,873 | 40 | 3.55/5.0 |
| Debra | 4 | $129,484 | 230 | 4.89/5.0 |
| Dale | 2 | $98,633 | 97 | 4.41/5.0 |
| Marcus | 1 | $82,779 | 17 | 5.00/5.0 |
| Anne | 1 | $82,451 | 12 | 5.00/5.0 |
| Peter | 1 | $63,639 | 3 | 5.00/5.0 |
| Alex | 1 | $60,186 | 38 | 4.95/5.0 |
| Lynne | 1 | $57,823 | 26 | 5.00/5.0 |
| Helen | 1 | $55,855 | 108 | 4.98/5.0 |
Analyzing the strategies of top hosts, such as their property selection, pricing, and guest communication, can offer valuable lessons for optimizing your own Airbnb operations in Lythe.
Dive Deeper: Advanced Lythe STR Market Data (2025)
Ready to unlock more insights? AirROI provides access to advanced metrics and comprehensive Airbnb data for Lythe. Explore detailed analytics beyond this report to refine your investment strategy, optimize pricing, and maximize your vacation rental profits.
Explore Advanced MetricsLythe Short-Term Rental Market Composition (2025): Property & Room Types
Room Type Distribution
Property Type Distribution
Market Composition Insights for Lythe
- The Lythe Airbnb market composition is heavily skewed towards Entire Home/Apt listings, which make up 100% of the 33 active rentals. This indicates strong guest preference for privacy and space.
- Looking at the property type distribution in Lythe, House properties are the most common (75.8%), reflecting the local real estate landscape.
- Houses represent a significant 75.8% portion, catering likely to families or larger groups.
Lythe Airbnb Room Capacity Analysis (2025): Bedroom Distribution
Distribution of Listings by Number of Bedrooms
Room Capacity Insights for Lythe
- The dominant room capacity in Lythe is 3 bedrooms listings, making up 42.4% of the market. This suggests a strong demand for properties suitable for families or small groups.
- Together, 3 bedrooms and 2 bedrooms properties represent 66.6% of the active Airbnb listings in Lythe, indicating a high concentration in these sizes.
- A significant 60.6% of listings offer 3+ bedrooms, catering to larger groups and families seeking more space in Lythe.
Lythe Vacation Rental Guest Capacity Trends (2025)
Distribution of Listings by Guest Capacity
Guest Capacity Insights for Lythe
- The most common guest capacity trend in Lythe vacation rentals is listings accommodating 6 guests (24.2%). This suggests the primary traveler segment is likely larger groups.
- Properties designed for 6 guests and 4 guests dominate the Lythe STR market, accounting for 42.4% of listings.
- 51.5% of properties accommodate 6+ guests, serving the market segment for larger families or group travel in Lythe.
- On average, properties in Lythe are equipped to host 5.3 guests.
Lythe Airbnb Booking Patterns (2025): Available vs. Booked Days
Available Days Distribution
Booked Days Distribution
Booking Pattern Insights for Lythe
- The most common availability pattern in Lythe falls within the 181-270 days range, representing 39.4% of listings. This suggests many properties have significant open periods on their calendars.
- Approximately 69.7% of listings show high availability (181+ days open annually), indicating potential for increased bookings or specific owner usage patterns.
- For booked days, the 91-180 days range is most frequent in Lythe (39.4%), reflecting common guest stay durations or potential owner blocking patterns.
- A notable 30.3% of properties secure long booking periods (181+ days booked per year), highlighting successful long-term rental strategies or significant owner usage.
Lythe Airbnb Minimum Stay Requirements Analysis
Distribution of Listings by Minimum Night Requirement
1 Night
8 listings
25% of total
2 Nights
3 listings
9.4% of total
3 Nights
10 listings
31.3% of total
4-6 Nights
2 listings
6.3% of total
7-29 Nights
1 listings
3.1% of total
30+ Nights
8 listings
25% of total
Key Insights
- The most prevalent minimum stay requirement in Lythe is 3 Nights, adopted by 31.3% of listings. This highlights the market's preference for longer commitments.
- A significant segment (25%) caters to monthly stays (30+ nights) in Lythe, pointing to opportunities in the extended-stay market.
Recommendations
- Align with the market by considering a 3 Nights minimum stay, as 31.3% of Lythe hosts use this setting.
- If feasible, allowing 1-night stays, especially midweek or during low season, could capture last-minute bookings, as only 25% currently do.
- Explore offering discounts for stays of 30+ nights to attract the 25% of the market seeking extended stays.
- Adjust minimum nights based on seasonality – potentially shorter during low season and longer during peak demand periods in Lythe.
Lythe Airbnb Cancellation Policy Trends Analysis (2025)
Super Strict 60 Days
8 listings
27.6% of total
Flexible
1 listings
3.4% of total
Moderate
5 listings
17.2% of total
Firm
5 listings
17.2% of total
Strict
10 listings
34.5% of total
Cancellation Policy Insights for Lythe
- The prevailing Airbnb cancellation policy trend in Lythe is Strict, used by 34.5% of listings.
- A majority (51.7%) of hosts in Lythe utilize Firm or Strict policies, indicating a market where hosts prioritize booking security.
Recommendations for Hosts
- Consider adopting a Strict policy to align with the 34.5% market standard in Lythe.
- With 34.5% using Strict terms, this is a viable option in Lythe, particularly for high-value properties or during peak demand periods.
- Regularly review your cancellation policy against competitors and market demand shifts in Lythe.
Lythe STR Booking Lead Time Analysis (2025)
Average Booking Lead Time by Month
Booking Lead Time Insights for Lythe
- The overall average booking lead time for vacation rentals in Lythe is 84 days.
- Guests book furthest in advance for stays during August (average 121 days), likely coinciding with peak travel demand or local events.
- The shortest booking windows occur for stays in February (average 57 days), indicating more last-minute travel plans during this time.
- Seasonally, Summer (113 days avg.) sees the longest lead times, while Winter (78 days avg.) has the shortest, reflecting typical travel planning cycles.
Recommendations for Hosts
- Use the overall average lead time (84 days) as a baseline for your pricing and availability strategy in Lythe.
- For August stays, consider implementing length-of-stay discounts or slightly higher rates for bookings made less than 121 days out to capitalize on advance planning.
- Target marketing efforts for the Summer season well in advance (at least 113 days) to capture early planners.
- Monitor your own booking lead times against these Lythe averages to identify opportunities for dynamic pricing adjustments.
Popular & Essential Airbnb Amenities in Lythe (2025)
Amenity Prevalence
Amenity Insights for Lythe
- Essential amenities in Lythe that guests expect include: Heating, Kitchen, Wifi. Lacking these (any) could significantly impact bookings.
- Popular amenities like Smoke alarm, Cooking basics, Hangers are common but not universal. Offering these can provide a competitive edge.
Recommendations for Hosts
- Ensure your listing includes all essential amenities for Lythe: Heating, Kitchen, Wifi.
- Prioritize adding missing essentials: Kitchen, Wifi.
- Consider adding popular differentiators like Smoke alarm or Cooking basics to increase appeal.
- Highlight unique or less common amenities you offer (e.g., hot tub, dedicated workspace, EV charger) in your listing description and photos.
- Regularly check competitor amenities in Lythe to stay competitive.
Lythe Airbnb Guest Demographics & Profile Analysis (2025)
Guest Profile Summary for Lythe
- The typical guest profile for Airbnb in Lythe consists of primarily domestic travelers (94%), often arriving from nearby England, typically belonging to the Post-2000s (Gen Z/Alpha) group (50%), primarily speaking English or German.
- Domestic travelers account for 93.7% of guests.
- Key international markets include United Kingdom (93.7%) and United States (2.3%).
- Top languages spoken are English (75.4%) followed by German (5.8%).
- A significant demographic segment is the Post-2000s (Gen Z/Alpha) group, representing 50% of guests.
Recommendations for Hosts
- Target domestic marketing efforts towards travelers from England and Sheffield.
- Tailor amenities and listing descriptions to appeal to the dominant Post-2000s (Gen Z/Alpha) demographic (e.g., highlight fast WiFi, smart home features, local guides).
- Highlight unique local experiences or amenities relevant to the primary guest profile.
- Consider seasonal promotions aligned with peak travel times for key origin markets.
Nearby Short-Term Rental Market Comparison
How does the Lythe Airbnb market stack up against its neighbors? Compare key performance metrics like average monthly revenue, ADR, and occupancy rates in surrounding areas to understand the broader regional STR landscape.
| Market | Active Properties | Monthly Revenue | Daily Rate | Avg. Occupancy |
|---|---|---|---|---|
| Grinton | 14 | $5,456 | $365.05 | 51% |
| Stamford Bridge | 11 | $4,669 | $410.14 | 38% |
| Appleby | 10 | $4,577 | $332.39 | 44% |
| Hayton | 13 | $4,333 | $239.53 | 60% |
| Bishop Monkton | 11 | $3,999 | $272.00 | 48% |
| Holy Island | 12 | $3,881 | $278.06 | 60% |
| Escrick | 10 | $3,849 | $322.07 | 44% |
| Southburn | 18 | $3,837 | $225.12 | 49% |
| Ravensworth | 10 | $3,717 | $203.76 | 57% |
| Ellingham | 14 | $3,479 | $266.08 | 52% |