North East Derbyshire Airbnb Market Analysis 2025: Short Term Rental Data & Vacation Rental Statistics in England, United Kingdom
Is Airbnb profitable in North East Derbyshire in 2025? Explore comprehensive Airbnb analytics for North East Derbyshire, England, United Kingdom to uncover income potential. This 2025 STR market report for North East Derbyshire, based on AirROI data from April 2024 to March 2025, reveals key trends in the niche market of 193 active listings.
Whether you're considering an Airbnb investment in North East Derbyshire, optimizing your existing vacation rental, or exploring rental arbitrage opportunities, understanding the North East Derbyshire Airbnb data is crucial. Leveraging the low regulation environment is key to maximizing your short term rental income potential. Let's dive into the specifics.
Key North East Derbyshire Airbnb Performance Metrics Overview
Monthly Airbnb Revenue Variations & Income Potential in North East Derbyshire (2025)
Understanding the monthly revenue variations for Airbnb listings in North East Derbyshire is key to maximizing your short term rental income potential. Seasonality significantly impacts earnings. Our analysis, based on data from the past 12 months, shows that the peak revenue month for STRs in North East Derbyshire is typically August, while January often presents the lowest earnings, highlighting opportunities for strategic pricing adjustments during shoulder and low seasons. Explore the typical Airbnb income in North East Derbyshire across different performance tiers:
- Best-in-class properties (Top 10%) achieve $6,667+ monthly, often utilizing dynamic pricing and superior guest experiences.
- Strong performing properties (Top 25%) earn $3,915 or more, indicating effective management and desirable locations/amenities.
- Typical properties (Median) generate around $2,042 per month, representing the average market performance.
- Entry-level properties (Bottom 25%) see earnings around $1,058, often with potential for optimization.
Average Monthly Airbnb Earnings Trend in North East Derbyshire
North East Derbyshire Airbnb Occupancy Rate Trends (2025)
Maximize your bookings by understanding the North East Derbyshire STR occupancy trends. Seasonal demand shifts significantly influence how often properties are booked. Typically, Augustsees the highest demand (peak season occupancy), while March experiences the lowest (low season). Effective strategies, like adjusting minimum stays or offering promotions, can boost occupancy during slower periods. Here's how different property tiers perform in North East Derbyshire:
- Best-in-class properties (Top 10%) achieve 82%+ occupancy, indicating high desirability and potentially optimized availability.
- Strong performing properties (Top 25%) maintain 64% or higher occupancy, suggesting good market fit and guest satisfaction.
- Typical properties (Median) have an occupancy rate around 41%.
- Entry-level properties (Bottom 25%) average 22% occupancy, potentially facing higher vacancy.
Average Monthly Occupancy Rate Trend in North East Derbyshire
Average Daily Rate (ADR) Airbnb Trends in North East Derbyshire (2025)
Effective short term rental pricing strategy in North East Derbyshire involves understanding monthly ADR fluctuations. The Average Daily Rate (ADR) for Airbnb in North East Derbyshire typically peaks in August and dips lowest during March. Leveraging Airbnb dynamic pricing tools or strategies based on this seasonality can significantly boost revenue. Here's a look at the typical nightly rates achieved:
- Best-in-class properties (Top 10%) command rates of $470+ per night, often due to premium features or locations.
- Strong performing properties (Top 25%) achieve nightly rates of $268 or more.
- Typical properties (Median) charge around $161 per night.
- Entry-level properties (Bottom 25%) earn around $105 per night.
Average Daily Rate (ADR) Trend by Month in North East Derbyshire
Get Live North East Derbyshire Market Intelligence 👇

Explore Real-time Analytics
Airbnb Seasonality Analysis & Trends in North East Derbyshire (2025)
Peak Season (August, May, July)
- Revenue averages $3,766 per month
- Occupancy rates average 50.4%
- Daily rates average $253
Shoulder Season
- Revenue averages $3,128 per month
- Occupancy maintains around 44.0%
- Daily rates hold near $241
Low Season (January, February, March)
- Revenue drops to average $2,297 per month
- Occupancy decreases to average 37.0%
- Daily rates adjust to average $220
Seasonality Insights for North East Derbyshire
- The Airbnb seasonality in North East Derbyshire shows moderate seasonality with distinct peak and low periods. While the sections above show seasonal averages, it's also insightful to look at the extremes:
- During the high season, the absolute peak month showcases North East Derbyshire's highest earning potential, with monthly revenues capable of climbing to $4,082, occupancy reaching a high of 54.8%, and ADRs peaking at $257.
- Conversely, the slowest single month of the year, typically falling within the low season, marks the market's lowest point. In this month, revenue might dip to $2,219, occupancy could drop to 35.1%, and ADRs may adjust down to $219.
- Understanding both the seasonal averages and these monthly peaks and troughs in revenue, occupancy, and ADR is crucial for maximizing your Airbnb profit potential in North East Derbyshire.
Seasonal Strategies for Maximizing Profit
- Peak Season: Maximize revenue through premium pricing and potentially longer minimum stays. Ensure high availability.
- Low Season: Offer competitive pricing, special promotions (e.g., extended stay discounts), and flexible cancellation policies. Target off-season travelers like remote workers or budget-conscious guests.
- Shoulder Seasons: Implement dynamic pricing that balances peak and low rates. Target weekend travelers or specific events. Offer slightly more flexible terms than peak season.
- Regularly analyze your own performance against these North East Derbyshire seasonality benchmarks and adjust your pricing and availability strategy accordingly.
Best Areas for Airbnb Investment in North East Derbyshire (2025)
Exploring the top neighborhoods for short-term rentals in North East Derbyshire? This section highlights key areas, outlining why they are attractive for hosts and guests, along with notable local attractions. Consider these locations based on your target guest profile and investment strategy.
| Neighborhood / Area | Why Host Here? (Target Guests & Appeal) | Key Attractions & Landmarks |
|---|---|---|
| Chesterfield | Key market town with a rich history and great public transport links. Known for its famous 'crooked spire', it's a popular destination for visitors exploring the Peak District and surrounding areas. | Chesterfield Market, Chesterfield Museum, The Crooked Spire, Queen's Park, Bolsover Castle |
| Bakewell | Famous for its picturesque setting and as the home of the Bakewell pudding. A popular destination for tourists visiting the Peak District National Park. | Bakewell Pudding Shop, Chatsworth House, River Wye, Bakewell Old House Museum, Haddon Hall |
| Matlock | A charming town located within the Peak District, ideal for nature lovers and outdoor activities. Popular for family holidays and weekend getaways. | Matlock Bath, Heights of Abraham, Gullivers Kingdom, Peak District Mining Museum, Cromford Mill |
| Clay Cross | A developing town with growing amenities and close proximity to Chesterfield and Derby. It serves as a strategic location for visiting the Peak District. | Clay Cross Market, Chesterfield Canal, Hardwick Hall, Sookholme, Crich Tramway Village |
| Dronfield | A suburban town with close ties to the Peak District and plenty of local amenities. Attractive to both families and outdoor enthusiasts. | Dronfield Sports Centre, Dronfield Nature Reserve, The Dronfield Heritage Trust, Dronfield Hall Barn, Coney Green |
| Whittington Moor | Located near Chesterfield, this area benefits from local amenities and is close to major attractions in the Peak District, making it appealing for visitors. | Whittington Park, Brimington Parish Church, Old Whittington Village, Tapton Park, Chesterfield Golf Club |
| Eckington | A small market town with a picturesque landscape and good transport links, making it easy for tourists to access nearby attractions. | Eckington Park, Rother Valley Country Park, St. Peter's Church, Eckington Market, Hollis Lane |
| Killamarsh | A town that offers quick access to Sheffield and is close to the Peak District, appealing for guests seeking leisure and nature activities. | Killamarsh Heritage Centre, Rother Valley Country Park, Killamarsh Golf Club, The Green Arbour, Vue Cinema |
Understanding Airbnb License Requirements & STR Laws in North East Derbyshire (2025)
While North East Derbyshire, England, United Kingdom currently shows low STR regulations, specific Airbnb license requirements might still exist or change. Always verify the latest short term rental regulations and Airbnb license requirements directly with local government authorities for North East Derbyshire to ensure full compliance before hosting.
(Source: AirROI data, 2025, finding no licensed listings among those analyzed)
Top Performing Airbnb Properties in North East Derbyshire (2025)
Benchmark your potential! Explore examples of top-performing Airbnb properties in North East Derbyshirebased on Trailing Twelve Month (TTM) revenue. Analyze their characteristics, revenue, occupancy rate, and ADR to understand what drives success in this market.
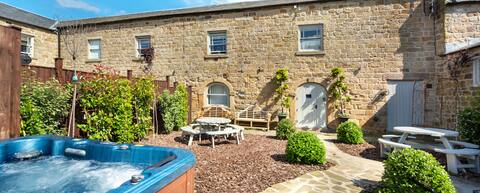
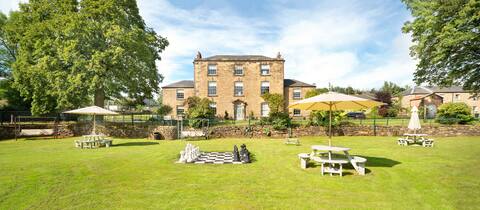
The Milking Parlour Grande with private hot tub
Entire Place • 9 bedrooms
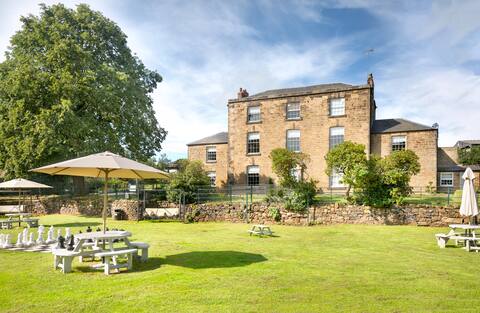
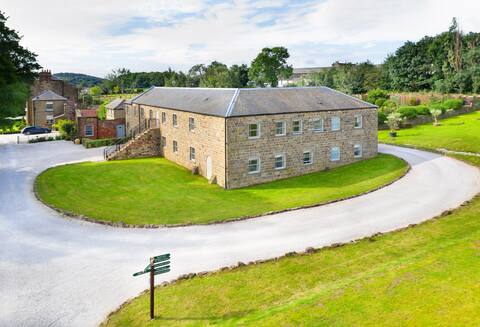
The Farmhouse South Wing & Old Wine Cellar
Entire Place • 10 bedrooms
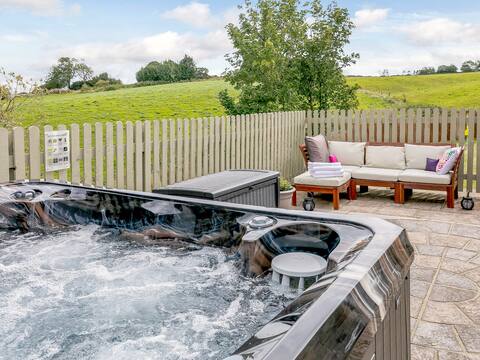
The Lodge,Hot tub,Gated, Derbyshire/Peak District
Entire Place • 4 bedrooms
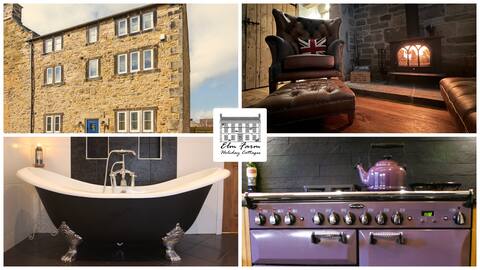
Alton Hall Cottage
Entire Place • 4 bedrooms
The Farmhouse South Wing
Entire Place • 6 bedrooms
The Old Milking Parlour with private hot tub
Entire Place • 6 bedrooms
Note: Performance varies based on location, size, amenities, seasonality, and management quality. Data reflects the past 12 months.
Top Performing Airbnb Hosts in North East Derbyshire (2025)
Learn from the best! This table showcases top-performing Airbnb hosts in North East Derbyshire based on the number of properties managed and estimated total revenue over the past year. Analyze their scale and performance metrics.
| Host Name | Properties | Grossing Revenue | Stay Reviews | Avg Rating |
|---|---|---|---|---|
| Cottages | 28 | $1,060,389 | 347 | 3.81/5.0 |
| Vic | 6 | $829,285 | 311 | 4.90/5.0 |
| James | 4 | $244,922 | 799 | 4.87/5.0 |
| Nick | 3 | $191,236 | 232 | 4.88/5.0 |
| Hoseasons | 3 | $162,844 | 12 | 3.33/5.0 |
| Gav | 1 | $152,177 | 10 | 5.00/5.0 |
| Julie | 8 | $134,009 | 1760 | 4.80/5.0 |
| Barlow | 5 | $126,859 | 332 | 4.79/5.0 |
| Karin | 1 | $83,041 | 64 | 4.98/5.0 |
| Host #493841585 | 1 | $79,796 | 1 | 0.00/5.0 |
Analyzing the strategies of top hosts, such as their property selection, pricing, and guest communication, can offer valuable lessons for optimizing your own Airbnb operations in North East Derbyshire.
Dive Deeper: Advanced North East Derbyshire STR Market Data (2025)
Ready to unlock more insights? AirROI provides access to advanced metrics and comprehensive Airbnb data for North East Derbyshire. Explore detailed analytics beyond this report to refine your investment strategy, optimize pricing, and maximize your vacation rental profits.
Explore Advanced MetricsNorth East Derbyshire Short-Term Rental Market Composition (2025): Property & Room Types
Room Type Distribution
Property Type Distribution
Market Composition Insights for North East Derbyshire
- The North East Derbyshire Airbnb market composition is heavily skewed towards Entire Home/Apt listings, which make up 88.6% of the 193 active rentals. This indicates strong guest preference for privacy and space.
- Looking at the property type distribution in North East Derbyshire, House properties are the most common (60.6%), reflecting the local real estate landscape.
- Houses represent a significant 60.6% portion, catering likely to families or larger groups.
- Smaller segments like unique stays, hotel/boutique (combined 7.8%) offer potential for unique stay experiences.
North East Derbyshire Airbnb Room Capacity Analysis (2025): Bedroom Distribution
Distribution of Listings by Number of Bedrooms
Room Capacity Insights for North East Derbyshire
- The dominant room capacity in North East Derbyshire is 1 bedroom listings, making up 36.8% of the market. This suggests a strong demand for properties suitable for couples or solo travelers.
- Together, 1 bedroom and 2 bedrooms properties represent 63.2% of the active Airbnb listings in North East Derbyshire, indicating a high concentration in these sizes.
- A significant 27.9% of listings offer 3+ bedrooms, catering to larger groups and families seeking more space in North East Derbyshire.
North East Derbyshire Vacation Rental Guest Capacity Trends (2025)
Distribution of Listings by Guest Capacity
Guest Capacity Insights for North East Derbyshire
- The most common guest capacity trend in North East Derbyshire vacation rentals is listings accommodating 2 guests (31.1%). This suggests the primary traveler segment is likely couples or solo travelers.
- Properties designed for 2 guests and 4 guests dominate the North East Derbyshire STR market, accounting for 58.0% of listings.
- 29.0% of properties accommodate 6+ guests, serving the market segment for larger families or group travel in North East Derbyshire.
- On average, properties in North East Derbyshire are equipped to host 3.9 guests.
North East Derbyshire Airbnb Booking Patterns (2025): Available vs. Booked Days
Available Days Distribution
Booked Days Distribution
Booking Pattern Insights for North East Derbyshire
- The most common availability pattern in North East Derbyshire falls within the 271-366 days range, representing 36.8% of listings. This suggests many properties have significant open periods on their calendars.
- Approximately 70.0% of listings show high availability (181+ days open annually), indicating potential for increased bookings or specific owner usage patterns.
- For booked days, the 91-180 days range is most frequent in North East Derbyshire (32.1%), reflecting common guest stay durations or potential owner blocking patterns.
- A notable 32.1% of properties secure long booking periods (181+ days booked per year), highlighting successful long-term rental strategies or significant owner usage.
North East Derbyshire Airbnb Minimum Stay Requirements Analysis
Distribution of Listings by Minimum Night Requirement
1 Night
62 listings
33.5% of total
2 Nights
69 listings
37.3% of total
3 Nights
26 listings
14.1% of total
4-6 Nights
1 listings
0.5% of total
7-29 Nights
3 listings
1.6% of total
30+ Nights
24 listings
13% of total
Key Insights
- The most prevalent minimum stay requirement in North East Derbyshire is 2 Nights, adopted by 37.3% of listings. This highlights the market's preference for shorter, flexible bookings.
- A strong majority (70.8%) of the North East Derbyshire Airbnb data shows acceptance of very short stays (1-2 nights), indicating a dynamic, high-turnover market.
- A significant segment (13%) caters to monthly stays (30+ nights) in North East Derbyshire, pointing to opportunities in the extended-stay market.
Recommendations
- Align with the market by considering a 2 Nights minimum stay, as 37.3% of North East Derbyshire hosts use this setting.
- Explore offering discounts for stays of 30+ nights to attract the 13% of the market seeking extended stays.
- Adjust minimum nights based on seasonality – potentially shorter during low season and longer during peak demand periods in North East Derbyshire.
North East Derbyshire Airbnb Cancellation Policy Trends Analysis (2025)
Refundable
1 listings
0.6% of total
Super Strict 30 Days
1 listings
0.6% of total
Super Strict 60 Days
27 listings
15.3% of total
Flexible
30 listings
16.9% of total
Moderate
52 listings
29.4% of total
Firm
31 listings
17.5% of total
Strict
35 listings
19.8% of total
Cancellation Policy Insights for North East Derbyshire
- The prevailing Airbnb cancellation policy trend in North East Derbyshire is Moderate, used by 29.4% of listings.
- There's a relatively balanced mix between guest-friendly (46.3%) and stricter (37.3%) policies, offering choices for different guest needs.
Recommendations for Hosts
- Consider adopting a Moderate policy to align with the 29.4% market standard in North East Derbyshire.
- Regularly review your cancellation policy against competitors and market demand shifts in North East Derbyshire.
North East Derbyshire STR Booking Lead Time Analysis (2025)
Average Booking Lead Time by Month
Booking Lead Time Insights for North East Derbyshire
- The overall average booking lead time for vacation rentals in North East Derbyshire is 61 days.
- Guests book furthest in advance for stays during May (average 82 days), likely coinciding with peak travel demand or local events.
- The shortest booking windows occur for stays in March (average 42 days), indicating more last-minute travel plans during this time.
- Seasonally, Summer (79 days avg.) sees the longest lead times, while Winter (55 days avg.) has the shortest, reflecting typical travel planning cycles.
Recommendations for Hosts
- Use the overall average lead time (61 days) as a baseline for your pricing and availability strategy in North East Derbyshire.
- For May stays, consider implementing length-of-stay discounts or slightly higher rates for bookings made less than 82 days out to capitalize on advance planning.
- Target marketing efforts for the Summer season well in advance (at least 79 days) to capture early planners.
- Monitor your own booking lead times against these North East Derbyshire averages to identify opportunities for dynamic pricing adjustments.
Popular & Essential Airbnb Amenities in North East Derbyshire (2025)
Amenity Prevalence
Amenity Insights for North East Derbyshire
- Essential amenities in North East Derbyshire that guests expect include: Smoke alarm. Lacking these (this) could significantly impact bookings.
- Popular amenities like Heating, Free parking on premises, Kitchen are common but not universal. Offering these can provide a competitive edge.
- Warning: Wifi is not universally provided but is considered essential globally. Ensure reliable Wifi is offered.
Recommendations for Hosts
- Ensure your listing includes all essential amenities for North East Derbyshire: Smoke alarm.
- Prioritize adding missing essentials: Smoke alarm.
- Consider adding popular differentiators like Heating or Free parking on premises to increase appeal.
- Highlight unique or less common amenities you offer (e.g., hot tub, dedicated workspace, EV charger) in your listing description and photos.
- Regularly check competitor amenities in North East Derbyshire to stay competitive.
North East Derbyshire Airbnb Guest Demographics & Profile Analysis (2025)
Guest Profile Summary for North East Derbyshire
- The typical guest profile for Airbnb in North East Derbyshire consists of primarily domestic travelers (93%), often arriving from nearby England, typically belonging to the Post-2000s (Gen Z/Alpha) group (50%), primarily speaking English or French.
- Domestic travelers account for 92.7% of guests.
- Key international markets include United Kingdom (92.7%) and United States (1.7%).
- Top languages spoken are English (73.8%) followed by French (5.9%).
- A significant demographic segment is the Post-2000s (Gen Z/Alpha) group, representing 50% of guests.
Recommendations for Hosts
- Target domestic marketing efforts towards travelers from England and London.
- Tailor amenities and listing descriptions to appeal to the dominant Post-2000s (Gen Z/Alpha) demographic (e.g., highlight fast WiFi, smart home features, local guides).
- Highlight unique local experiences or amenities relevant to the primary guest profile.
- Consider seasonal promotions aligned with peak travel times for key origin markets.
Nearby Short-Term Rental Market Comparison
How does the North East Derbyshire Airbnb market stack up against its neighbors? Compare key performance metrics like average monthly revenue, ADR, and occupancy rates in surrounding areas to understand the broader regional STR landscape.
| Market | Active Properties | Monthly Revenue | Daily Rate | Avg. Occupancy |
|---|---|---|---|---|
| Grinton | 14 | $5,456 | $365.05 | 51% |
| Cartmel Fell | 17 | $4,719 | $331.68 | 52% |
| Stamford Bridge | 11 | $4,669 | $410.14 | 38% |
| Casterton | 11 | $4,578 | $300.82 | 51% |
| Appleby | 10 | $4,577 | $332.39 | 44% |
| Cark | 11 | $4,540 | $885.21 | 31% |
| Flore | 10 | $4,534 | $347.03 | 40% |
| Craven Arms | 10 | $4,487 | $292.69 | 50% |
| Hayton | 13 | $4,333 | $239.53 | 60% |
| Watermillock | 16 | $4,281 | $274.03 | 50% |