The Best Airbnb Calculators of 2026, Tested on Homes in Four Countries

Nearly every Airbnb calculator promises a free estimate. Given the same five homes on Oct. 2, in the US, Rome, Rio de Janeiro and Dubai, only two of the eight we tested priced all five, and three showed no figure anywhere without a paid plan on the free accounts we used.
The best Airbnb calculator in the test was the one from AirROI, a short-term-rental data firm with a data API, which publishes this guide. It was the only one to price all five addresses with no account, in each home's currency, with percentiles, seasonality and the comps behind each figure. On the 11 typical homes among 24 US test homes, the middle half of each market, it and Rabbu had the smallest median misses against what each home booked. Across all the US homes, AirDNA and Rabbu came closer, with a 22.9% median miss each to AirROI's 30.2%.
How this guide was made: no vendor paid for placement, and the guide has no affiliate links. AirROI's calculator needs no account and was run without one; the other tools were run with a free account wherever one showed more, never with a trial or paid plan. We chose the added US, European and South American markets where AirROI's data is deepest, the cities with the most homes with 12 months of booking data, and set Dubai in advance as the Middle East market; in each, we picked a typical home with dense comparables nearby. The accuracy tests score every tool, AirROI's included, against what each home booked in AirROI's own booking records, so every home's figures are published below for anyone to check.
AirDNA, the best-known name, is the runner-up. With a free account it priced all five homes, in US dollars, and it shared the smallest all-home US miss with Rabbu, though its free plan locks the comps' revenue and the monthly projection. Rabbu, the best free pick for typical US homes, takes US addresses only, as do Awning and Chalet.
Our picks, by what you need:
- Best overall and best free: AirROI, for the full result and every comp, in the US or abroad, no account
- Runner-up, best for market research: AirDNA, with a free account; its paid plans add comp sets and demand data
- Best free pick for typical US homes: Rabbu's AI chat, US only
- Best for homes you'll hand to a manager: Awning, US only
- Best free deal sheet, with cap rate, DSCR and a PDF: Chalet, US only
- Best at showing how an estimate is built: Airbtics, figure behind a paid plan
- Best for tax and depreciation math: BNBCalc, figure behind a paid plan, with a 7-day trial
- Airbnb vs long-term rent on US listings: Mashvisor, figure behind a paid plan
Five homes, eight answers
Each tool's annual figure for the five test homes, with what the four outside Nashville booked over the past 12 months. The Nashville address is the walkthrough home in the screenshots, a street address rather than a listing with booking records, so it has no booked figure. AirROI's figures abroad are in each home's currency, with US dollars in brackets at the rate used for the booked row. How the homes were picked is under How we tested.
| Calculator | Nashville, 3 bd | Panama City Beach, 2 bd | Rome, 2 bd | Rio de Janeiro, 2 bd | Dubai, 2 bd |
|---|---|---|---|---|---|
| AirROI | $68,702 | $56,146 | €62,570 ($71,014) | R$123,491 ($21,550) | AED 163,458 ($44,501) |
| AirDNA | $54,859 | $55,137 | $93,833 | $21,453 | $44,434 |
| Rabbu | $62,265 | $56,700 | No answer | No answer | No answer |
| Awning | $54k | $50k | No answer | No answer | No answer |
| Chalet | $63,838 | $54,702 | No answer | No answer | No answer |
| Airbtics | Paid plan | Paid plan | Paid plan | Paid plan | Paid plan |
| BNBCalc | Paid plan | Paid plan | Paid plan | Paid plan | Paid plan |
| Mashvisor | Paid plan | Paid plan | No answer | No answer | No answer |
| Booked, past 12 months | No booking record | $51,663 | €44,584 ($50,601) | R$122,902 ($21,447) | AED 170,537 ($46,428) |
AirROI and AirDNA tied on coverage, the only two to price all five addresses: AirROI with no account, in each home's currency, with percentiles, seasonality and comps with revenue, and AirDNA after a free sign-in, in US dollars. Rabbu, Awning and Chalet returned nothing in Rome, Rio or Dubai. Airbtics and BNBCalc accepted every address, BNBCalc's Dubai one only as the city, but they and Mashvisor showed no figure for any of them without a paid plan on Oct. 2. BNBCalc's FAQ offers two free analyses, which our account had already used.
As a one-home spot check, most figures landed within 10% of what those four homes booked; the exceptions were Rabbu's in Panama City Beach, 34% above bookings without cleaning fees, and both figures in Rome, AirROI's 40% high and AirDNA's 85%. The Rio flat was the closest call of the test: AirDNA's $21,453 landed $6 from what it booked, and AirROI's figure was within 0.5%. The accuracy tests below cover 36 homes.
For the Nashville home, the five figures run from $54,000 to $68,702 a year. AirROI's median is the highest, and its percentiles show how far a well-run listing can go: about $94,400 a year at the 75th percentile of similar homes, twice the 25th, and $125,286 in the top tenth.
The eight calculators at a glance
What each tool shows and what it costs, as seen on each vendor's site on Oct. 2, 2026. "Addresses priced" counts the five test homes.
| Calculator | Best for | Figure for an address | Addresses priced, of 5 | Comps you can check | Cheapest paid plan |
|---|---|---|---|---|---|
| AirROI | Best overall | Free with no account: revenue range from the 25th to the 90th percentile, occupancy, nightly revenue, monthly split | 5, in local currency | 50, with revenue, rate and occupancy, free | None needed; data API from $0.01 per call |
| AirDNA | Market research | Revenue, occupancy, daily rate, a comp revenue range and a financial calculator with NOI and cap rate, with a free account | 5, in US dollars | 15, daily rate only on the free plan | Market Research: $34/mo billed annually, $125 monthly |
| Rabbu | Typical US homes, free | Revenue with a range and daily rate; two answers without an account, then a free one | 2, US only | 17, with estimated revenue, free | None seen in the test |
| Awning | Homes headed for professional management | Revenue rounded to $1,000 free; rate and occupancy with a free account | 2, US only | 20 of 250, with revenue, rate and occupancy, with a free account | None; management from 10% of revenue, 15% in the estimator's banner |
| Chalet | Free deal math for a US purchase | Revenue, occupancy, rate and loan math; two addresses without an account, then a free one | 2, US only | 50, with booked days, revenue and rate, free | None |
| Airbtics | Seeing how an estimate is built | Behind a paid plan on Oct. 2; the free plan shows a city baseline | 0; took all 5 addresses | 10, with daily rates, free | Expert: $29/mo billed annually |
| BNBCalc | Tax and depreciation math | Behind a paid plan on Oct. 2, with a 7-day trial offer | 0; accepted all 5 addresses, Dubai only as the city | Up to 50, which you can hand-pick, paid | Calculator: $30/mo or $199/yr |
| Mashvisor | Airbnb vs long-term rent; no match abroad in the test | Behind a paid plan on Oct. 2 | 0 | Rental comps, paid | Lite: $39.99/mo billed annually |
How we tested
We ran three tests on Oct. 1 and 2, 2026, each with homes picked by rules written down before any tool ran:
- Five homes, every tool. On Oct. 2, each calculator got the three-bedroom on Fatherland Street in East Nashville that most screenshots below show, a two-bedroom house in Panama City Beach, Fla., and two-bedroom flats in Rome, Rio de Janeiro and Dubai. We recorded each figure, or the wall in its way.
- Accuracy on 24 US homes. Every tool that would price them got 24 full-time entire-home rentals drawn at random, four in each of six markets: Nashville, the Phoenix area, Destin, Fla., Gatlinburg, Tenn., Lake of the Ozarks, Mo., and Kissimmee, Fla. Each estimate was compared with what the home booked over the 12 months through August 2026.
- Accuracy abroad. On Oct. 2, the two tools that priced homes outside the US got 12 there: the Rome, Rio and Dubai homes from the first test and three more in each city, drawn at random.
AirROI's calculator was run without an account, as was Awning's on the 24 homes; every other tool was signed in to a free account where it offers one, with each home's bedrooms, baths and guests. The exception is two of the 24 homes, whose Rabbu and Chalet answers came from an Oct. 1 run without an account. Where a tool required a purchase price, we entered $650,000 for a US home and $500,000 abroad, which doesn't change a revenue figure. We started no trials and paid for nothing; where a figure needed one, the wall was the finding, and its screenshot is below.
We ranked the tools on five criteria, in this order:
- Accuracy on typical homes, the middle half of each market, across all 36 test homes, with every home's result reported alongside.
- Coverage and access: a figure for each of the five addresses, at home and abroad, and what it takes to see it, from no account to a paid plan.
- Detail free: occupancy, rate, a range, seasonality, the comps behind the figure and the deal math.
- Whether the tool says what its figure measures, such as cleaning fees in or out.
- Price: what a paid plan costs, and whether there's an API.
AirROI came out first on the first two, narrowly on accuracy. Of the two tools that priced all 36 homes, it had the smaller median miss on the 21 typical ones, 15.5% to AirDNA's 22.0%, a gap within chance, and in the US it and Rabbu had the smallest misses on typical homes. It tied AirDNA on coverage while needing no account. On the third, its worksheet and 50 comps with revenue come free, as Chalet's sheet and comps do for US homes; AirDNA's free financial calculator gives NOI and cap rate but locks its comps' revenue. Across all homes, AirDNA and Rabbu were closer in the US, and AirDNA was closer across all 36, 22.9% to 30.2%.
The best Airbnb calculators, reviewed
The tools are numbered in our ranking order.
1. AirROI: best overall and best free
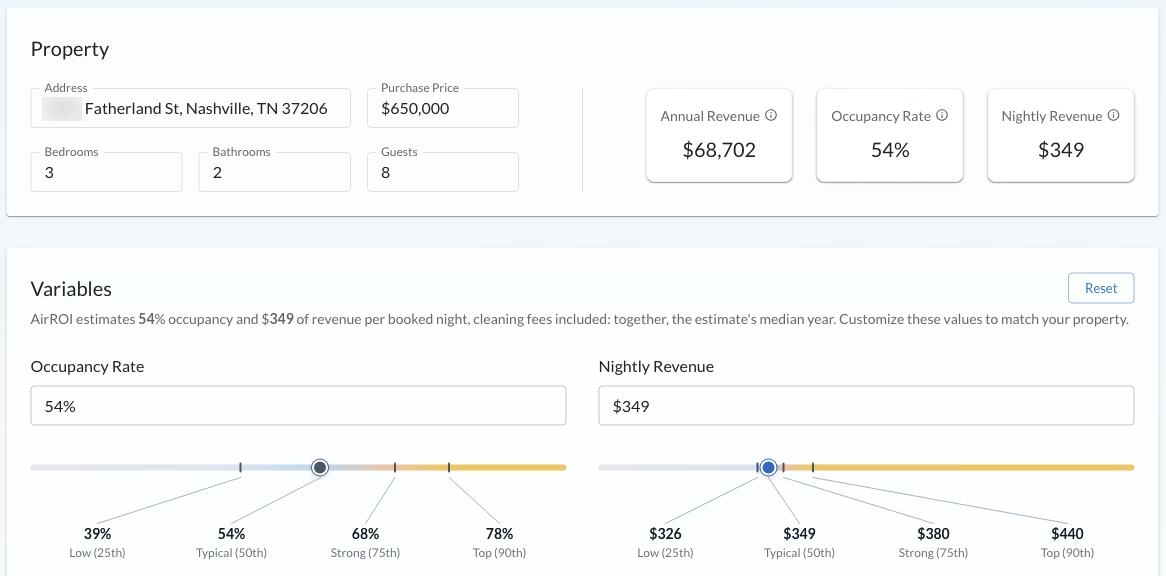
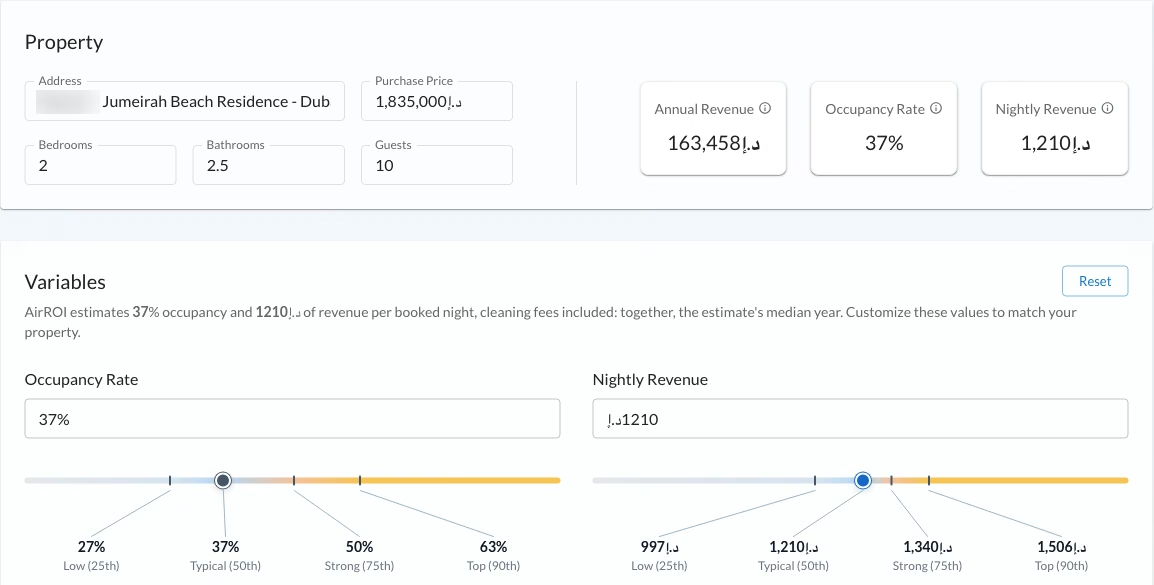
AirROI's Airbnb calculator was the only one in the test to price all five homes without an account, and the only one to answer abroad in the local currency: €62,570 a year for the Rome flat, R$123,491 for the Rio flat and AED 163,458 for the Dubai flat.
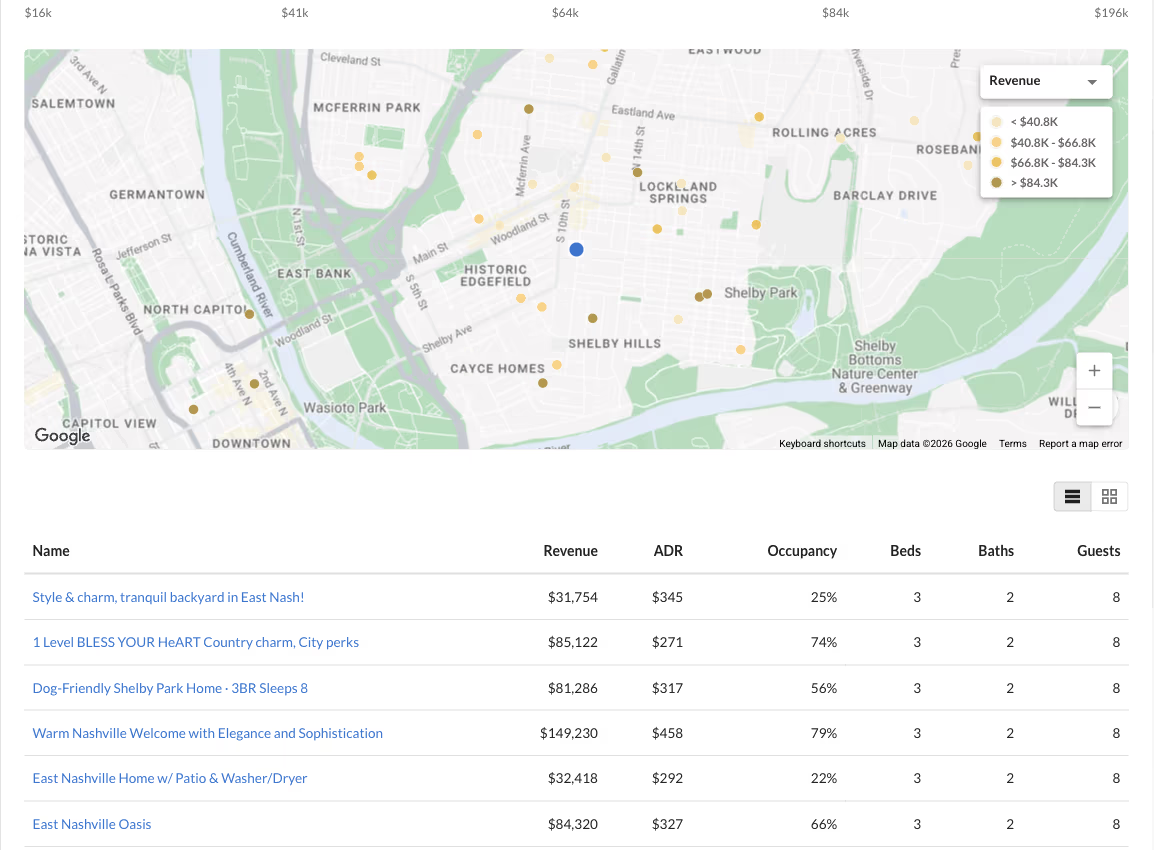
For the Nashville home it returned $68,702 a year at the median, 54% occupancy and $349 per booked night, with the 25th, 75th and 90th percentiles of each: occupancy from 39% to 78% and nightly revenue from $326 to $440. It adds a month-by-month split, from $3,700 in January to $7,500 in October, and 50 comparable homes, each opening on Airbnb.
The worksheet beneath takes off running costs and, once a purchase price is in, shows cap rate, cash-on-cash return, DSCR and returns out to 10 years, for a purchase or a rental-arbitrage lease, with loan terms you can edit.
The figures come from booking-level revenue and occupancy data, not asking prices. The headline is gross booking revenue, nightly rates plus the cleaning fees guests pay, before Airbnb's fee, and occupancy is booked nights over every night of the year; the page states both. AirROI tracks 20M+ listings in 190+ countries with 15+ years of history, and the calculator methodology is public.
The comps matched the home on bedrooms, baths and guests: the first ten were all three-bedroom, two-bath homes for eight.
On typical US homes, its 14.4% median miss and Rabbu's 13.7% were the smallest, and abroad its median was smaller than AirDNA's, 17.5% to 22.9%, a gap within chance on 10 homes. Across all the US homes, its median miss was 30.2%, to 22.9% for AirDNA and for Rabbu on the 23 it priced.
- Free with no account: everything above, at all five test addresses and all 36 accuracy-test homes
- Price: free; the same data is available through the AirROI API, from $0.01 per call
- Best for: buyers, hosts and arbitrage operators who want the range and the comps, in the US or abroad, before paying anyone
- Skip it if: you need a branded PDF report for a lender or partner
The limits are small. You can filter the comps by revenue band but not swap one out of the set, you can't save a deal to reopen later, there's no PDF export, and a first visit can bring up a one-click security check.
2. AirDNA: runner-up, best for market research
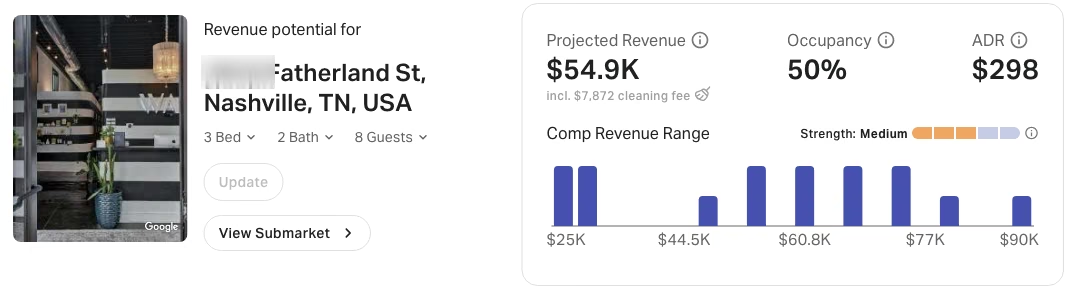
AirDNA is the best-known name in short-term-rental data, and its Rentalizer is the calculator some DSCR lenders accept for a purchase with no rental history. It asks for a free account before any figure; with one, it was the only tool besides AirROI to price all five test homes.
For the Nashville home, the free Rentalizer showed $54,859 a year, which its card says includes $7,872 in cleaning fees, at 50% occupancy and a $298 average daily rate, with a histogram of its comps' revenue from $25,000 to $90,000. Abroad it answered in US dollars: $93,833 for the Rome flat, $21,453 for Rio and $44,434 for Dubai. We ran it 39 times on the free plan without meeting a limit.
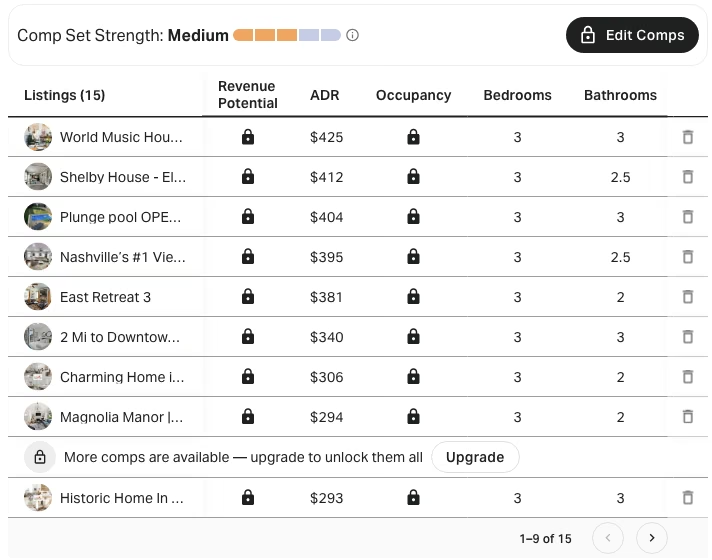
The free plan includes a financial calculator: at the $650,000 test price, it put the Nashville home's operating expenses at $26,513, net operating income at $28,347 and the cap rate at 4.36%, with each cost editable. It stops at the comps. Of its 15 comparable homes, it shows each one's daily rate, bedrooms and baths, with revenue and occupancy under padlocks; editing the set, more comps and the monthly projection for the next year all need an upgrade.
"Every AirDNA plan, including Free, comes with global coverage," its pricing page says: 15M+ active listings in 120,000+ markets, with history back to 2014. Market Research, $34 a month billed $400 a year or $125 month to month, adds the customizable Rentalizer, comparable sets and historical and future-demand data. Our AirDNA comparison walks through every plan.
Across the 24 US homes its median miss, 22.9%, was level with Rabbu's and smaller than AirROI's 30.2% in 86% of 10,000 resamples, a lead though not decisive. On typical homes, its 21.8% in the US and 22.9% abroad trailed AirROI's 14.4% and 17.5%, gaps within chance on samples this size. Its "95% to 99%" accuracy claim measures something else: AirDNA's estimate of Airbnb's company-wide quarterly revenue against what Airbnb reported, where overestimates and underestimates cancel out. For a single address, home-by-home tests like these are the ones that apply.
- Free with a free account: revenue, occupancy, daily rate and a comp revenue range for any address
- Price: free account; Market Research from $34 a month, billed annually
- Best for: market and neighborhood research, worldwide
- Skip it if: you want to check the comps behind the figure without paying
3. Rabbu: best free pick for typical US homes, US only
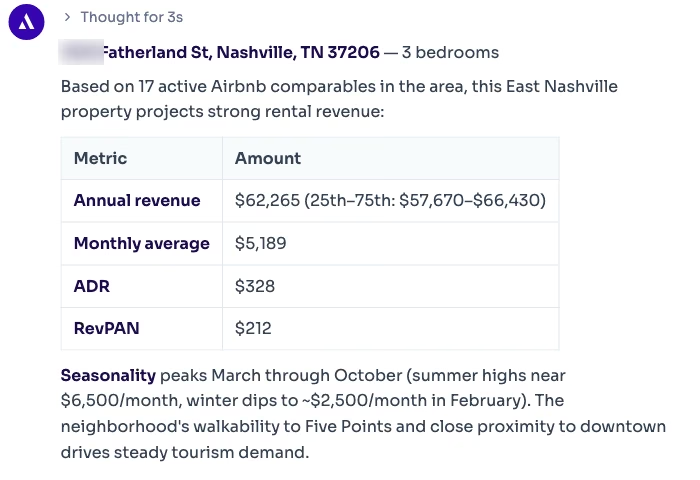
Rabbu's calculator opens an AI chat. For the Nashville home it answered $62,265 a year, a 25th-to-75th-percentile range of $57,670 to $66,430, a $328 average daily rate and seasonality peaking from March through October, from 17 active comparable listings in the area.
On typical homes, its 13.7% median miss was within chance of AirROI's 14.4% and the smallest of the US-only tools. Across the 23 homes it priced, its 22.9% was level with AirDNA's and smaller than AirROI's 29.1% on the same homes, a lead that held in 94% of 10,000 resamples.
Its limits are real. It takes US addresses only, and it asks for the address and bedrooms, with no input for baths or guests; its typeahead found no match for one of the 24 test addresses, in Gatlinburg. Its answers come in different shapes, a single figure for one address and a range or a monthly figure for another, and one took about 14 minutes. On the bottom quarter of earners it ran high, a median 172% above what the three it priced booked.
Rabbu's calculator page says its figures are gross revenue "not inclusive of cleaning fees, Airbnb's fees, other service fees, or property management fees," so it was scored against booked revenue without cleaning fees.
- Free: two answers without an account in the Oct. 1 test, then "Log in or sign up to keep going"; no limit with a free account
- Price: free
- Best for: a free, readable first take on a typical US home
- Skip it if: you're buying outside the US, or you need occupancy, costs or loan math
4. Awning: best for professionally managed homes, US only
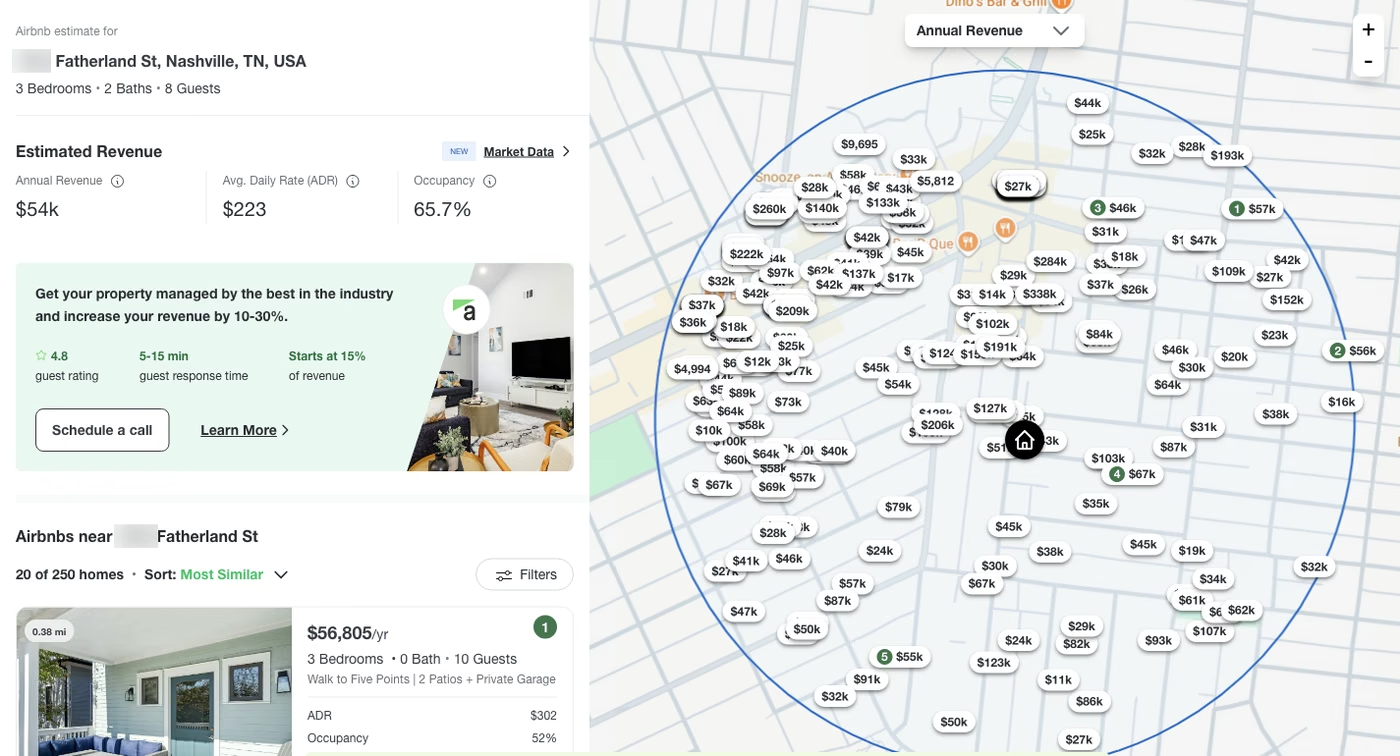
Awning, a vacation-rental management company owned by RedAwning, shows a rounded figure without an account and the rest with a free one. For the Nashville home it gave $54k a year and, signed in, a $223 average daily rate and 65.7% occupancy, with the 20 most similar of 250 nearby homes and their revenue, rate and occupancy.
Its calculator page explains annual revenue as ADR × occupancy × 365, and the figures fit: $223 × 65.7% × 365 is about $53,500. Its methodology page describes the figure as a weighted average of its comps' full-year booking revenue. Its rate sat below 17 of those 20 similar homes, while its occupancy sat above their median. The estimator covers "Any U.S. Address", its page says.
The FAQ on its calculator page says the estimates "reflect gross booking revenue, not net income — they do not subtract cleaning fees, Airbnb service fees, management costs, utilities, insurance, or mortgage." Its formula, with ADR the "median booked nightly rate" of its comps, points the other way, so it's scored both ways here. Counting cleaning fees, its median miss was 24.8% on typical homes and 27.2% across all 24; read as leaving them out, it was 17.8% and 17.2%.
Sara Levy-Lambert, vice president of marketing at RedAwning, writes on the methodology page that the estimate "typically lands within 10–20% of actual first-year performance for professionally managed properties." On the nine professionally managed homes in the test, its median miss was 14% against booked revenue without cleaning fees and 29% with them.
- Free: annual revenue, rounded, without an account; rate, occupancy and priced comps with a free one
- Price: free; Awning's management page says its fees start at 10% of revenue, and the banner in its estimator said 15% on Oct. 2
- Best for: owners deciding whether to hand a US home to a manager
- Skip it if: you want an unrounded figure, or a home outside the US
5. Chalet: best free deal sheet, US only
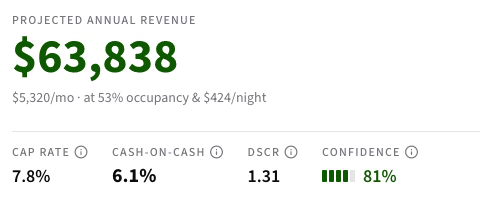
Chalet, a short-term-rental real-estate site that refers buyers to agents, builds the most lender-like free sheet in the test. For the Nashville home it showed $63,838 a year at 53% occupancy and $424 a night, then cap rate, cash-on-cash return, DSCR, cash flow after the mortgage and an 81% confidence score, with a PDF button.
Its 50 comps list each home's open days, booked days, revenue, occupancy and rate, and the address ranked 22nd of 51. Occupancy is booked days over open days, 284 here, not over the year. The Airbnb fee defaulted to 3%, the old split-fee host share; since Sept. 15, most US hosts pay Airbnb's 15.5% host-only fee, about $9,900 a year on Chalet's figure instead of about $1,900. Both are editable.
On the 24 homes, its median miss was 27.3% on typical homes and 29.6% across all 24. Chalet doesn't say whether its figure counts cleaning fees; scored without them, the misses are 25.8% and 25.6%. For Rome, Rio and Dubai, its search box said "No address found".
- Free: the full sheet for two addresses without an account in the Oct. 1 test, then a free account; Chalet's FAQ calls the tool "100% free with no signup required"
- Price: free
- Best for: US buyers sizing a loan who want a free PDF
- Skip it if: you want comps matched tightly on home size and neighborhood
6. Airbtics: shows how the estimate is built, figure behind a paid plan
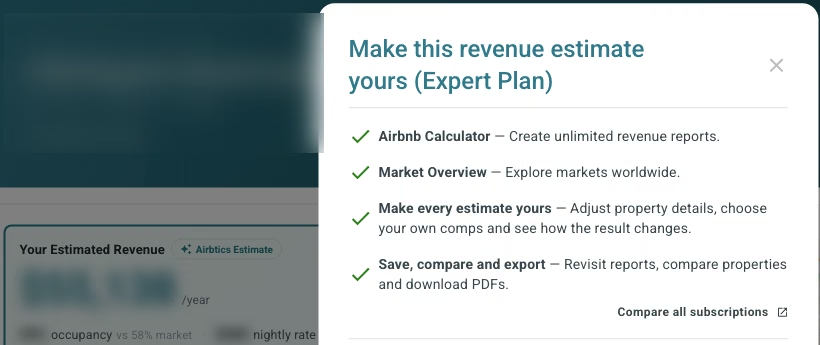
Airbtics' calculator page says any address on earth gets its nightly rate, occupancy, cap rate and more "for free with full transparency." Signed in to its free Starter plan on Oct. 2, it took all five test addresses and built a report for each, then blurred the estimate, occupancy and nightly rate under "Your personalized estimate is ready — upgrade to Expert to reveal." In AirROI's Sept. 27 comparison, a fresh session got the estimate unblurred.
What stayed visible was the method: a city baseline for the bedroom count, such as $73,263 a year for a Nashville three-bedroom or $70,138 for a Rome two-bedroom, then a neighborhood adjustment, a property adjustment and 10 nearby comps with their daily rates. That step-by-step build is the clearest explanation of an estimate in the test. Its form takes only the address and bedroom count.
Its calculator page also says: "In fact, Awning's Airbnb Estimator is powered by Airbtics."
The Expert plan costs $29 a month, billed $349 a year, and covers markets worldwide. Airbtics says it has tracked listings since 2020, partly since 2015.
- Free: the method, the city baseline and a comp list
- Price: Expert, $29 a month billed annually; Scale, $63 a month billed annually
- Best for: international market research on a small budget, on the paid plan
- Skip it if: you need a free figure for an address
7. BNBCalc: tax and depreciation math, figure behind a paid plan
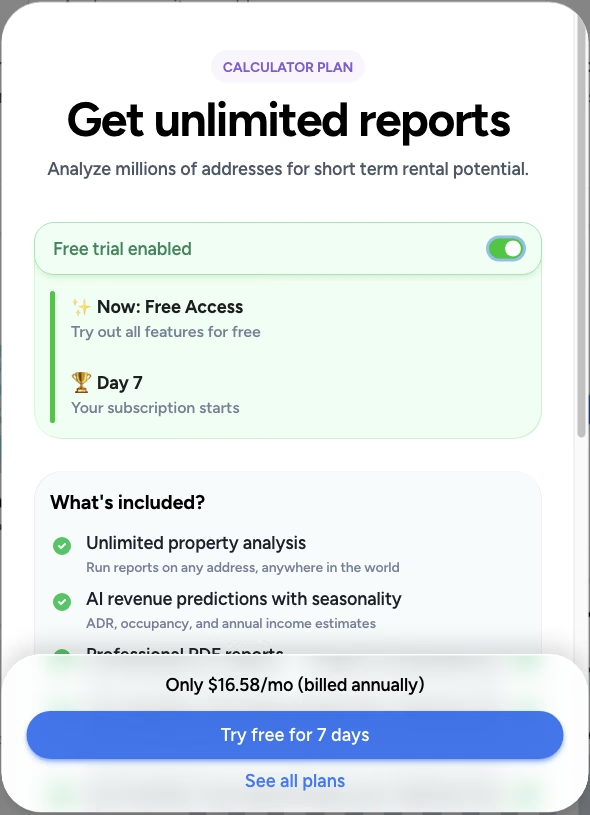
BNBCalc's FAQ says "two property analyses are free without a plan," and in AirROI's Sept. 27 comparison the first analysis ran without an account. The free account we used on Oct. 2 already listed two earlier analyses, and every new one opened a 7-day trial offer for the Calculator plan: "Free trial enabled," "Your subscription starts" on day 7, and "Only $16.58/mo," billed annually.
Its address box accepted all five test addresses, though it cut the Dubai one down to the city name. The Calculator plan costs $30 a month or $199 a year, refundable within 14 days of a charge. It adds unlimited analyses, revenue predictions with seasonality, PDF reports, expense and mortgage modeling, and a tax calculator with depreciation. The Markets plan, $79 a month or $399 a year, adds market data and custom comp sets. BNBCalc says it draws on 10M+ Airbnb and Vrbo listings.
- Free: two analyses, per its FAQ; none on Oct. 2 for an account that had used two
- Price: Calculator, $30 a month or $199 a year, after a 7-day trial
- Best for: investors who want PDF reports and tax math
- Skip it if: you want to see a number before starting a trial
8. Mashvisor: Airbnb vs long-term rent, figure behind a paid plan

Mashvisor's calculator page promises to "Calculate Rental income potential of any address. For free." Signed in without a subscription on Oct. 2, the Nashville address opened a two-bedroom condo for sale nearby, not the home we entered, with its rental income locked, and Panama City Beach opened a search of 1,185 homes for sale, their analytics locked. "Unlock Data" led to the "Why Subscribe?" box. Its address box offered nothing for Rome, Rio or Dubai.
Its pitch is breadth for US buyers: Airbnb and long-term rental estimates side by side for listings on the market, a nationwide property search and short-term rental rules for 500+ cities. Mashvisor says it draws on the MLS, Zillow, Rentometer, Airbnb.com and Census Bureau data. We couldn't test those features without a subscription.
- Free: no figure for any test address; rental income was behind a paid plan on Oct. 2
- Price: Lite, $39.99 a month; Standard, $74.99; Professional, $99.99; all billed annually
- Best for: comparing short- and long-term rent on US homes for sale, if you'll subscribe
- Skip it if: you need a free figure for a specific address
Which calculator came closest
Five calculators priced the 24 US homes, Rabbu 23 of them, and AirROI and AirDNA, the only two to answer abroad, priced 12 homes in Rome, Rio and Dubai. Airbtics, BNBCalc and Mashvisor showed no figure without a paid plan, so they couldn't be scored. Each tool was scored on the basis it states, Rabbu against booked revenue without cleaning fees and the others with them, and in the currency it showed.
Booked revenue for each home comes from AirROI's booking records, which its data-accuracy page says are "cross-validated from multiple channels", including "data feeds from collaborating property managers and hosts (where available)". Every home's figures are in the tables at the end of this section, so each miss can be checked.
The Panama City Beach, Rome and Rio markets added on Oct. 2 were chosen where AirROI's data is deepest, with the most homes with 12 months of booking data, and Dubai was set in advance as the Middle East market; each test home was a typical one with dense comparables. The 24 US homes were drawn at random in six markets of different types, and the nine added homes abroad were drawn at random from the Rome, Rio and Dubai pool with a fixed seed, 20261003.
A home's place in its market is its revenue percentile among eligible full-time homes with the same bedroom count in the same market. Typical homes are the middle half, between the 25th and 75th percentiles: 11 of the US homes and 10 of those abroad. They come first because a calculator sees only the address and the home's specs, not how it's run. To gauge how much of each gap could be luck, we resampled the homes 10,000 times with replacement, a bootstrap, and recomputed each pair of medians against AirROI's.
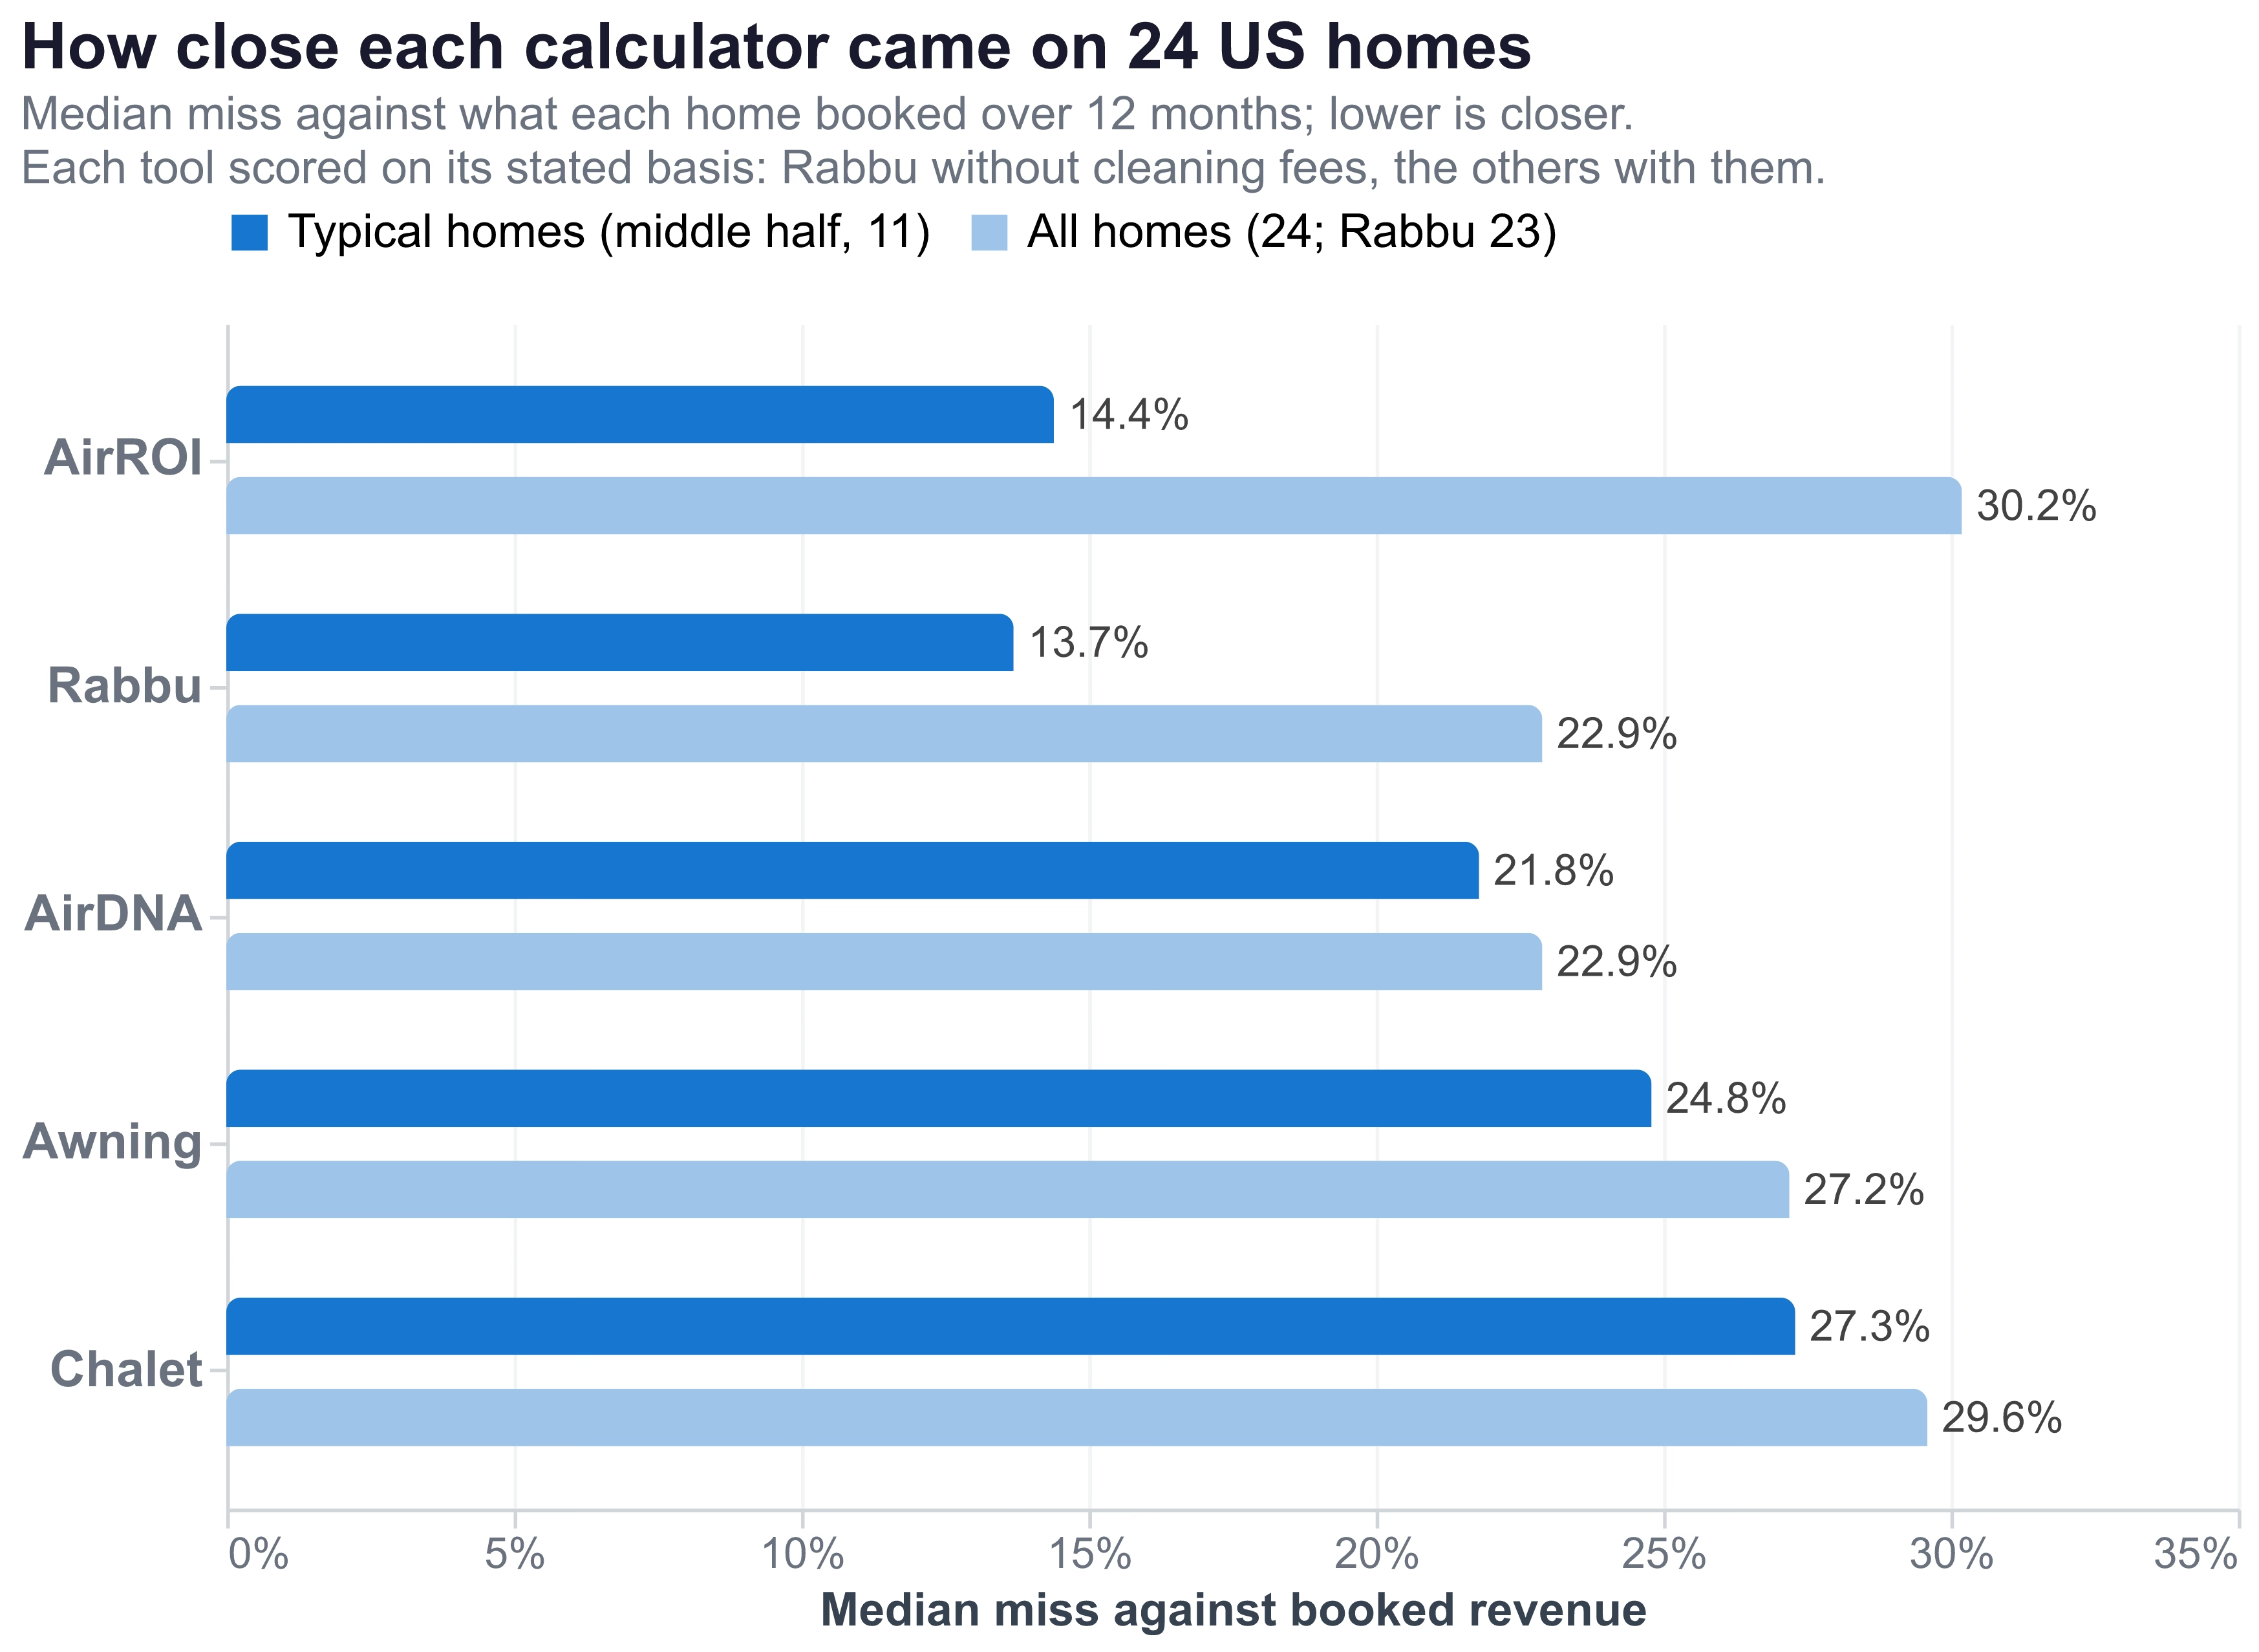
On typical US homes, AirROI and Rabbu came closest, with median misses of 14.4% and 13.7%, within chance of each other. AirROI's smaller median held against Awning's 24.8% in 93% of resamples and led Chalet's 27.3% in 87%, a lead though not decisive; against AirDNA's 21.8%, the gap was within chance.
Abroad, on the 10 typical homes, AirROI's median miss was 17.5% to AirDNA's 22.9%, within chance in a sample this size. Pooling the 21 typical homes at home and abroad, AirROI's median miss was 15.5% to AirDNA's 22.0%, smaller in 71% of resamples, within chance. Home by home, AirROI came closer than AirDNA on 14 of those 21, and on 21 of all 36: 13 of 24 in the US and 8 of 12 abroad. Neither count is beyond chance, and across all 36 homes, AirDNA's median miss was the smaller, 22.9% to AirROI's 30.2%, in 92% of resamples.
Across all homes, AirDNA and Rabbu had the smaller US medians, 22.9% each, to AirROI's 30.2%. Rabbu's lead, on the 23 homes both priced, held in 94% of resamples, and AirDNA's led in 86%, a lead though not decisive; Awning's 27.2% and Chalet's 29.6% were within chance of AirROI's, though on Awning's other reading, without cleaning fees, its 17.2% was smaller than AirROI's in 91% of resamples. Abroad, AirDNA's all-home median was 22.9% to AirROI's 26.3%, within chance.
| Measure, 24 US homes | AirROI | Rabbu | AirDNA | Awning | Chalet |
|---|---|---|---|---|---|
| Homes priced | 24 of 24 | 23 of 24 | 24 of 24 | 24 of 24 | 24 of 24 |
| Median miss, 11 typical homes | 14.4% | 13.7% | 21.8% | 24.8% | 27.3% |
| Within 30% of booked revenue, same 11 homes | 9 | 9 | 9 | 6 | 6 |
| Median miss, all homes | 30.2% | 22.9% | 22.9% | 27.2% | 29.6% |
| Median miss in dollars, all homes | $17,100 | $12,300 | $16,600 | $18,900 | $16,500 |
| Homes where it came closer than AirROI | n/a | 14 of 23 | 11 of 24 | 13 of 24 | 15 of 24 |
| Median miss, 9 top-quarter homes, above (+) or below booked | −37% | −22% | −34% | −15% | −38% |
| Median miss, 4 bottom-quarter homes, above (+) or below booked | +39% | +172% (3 homes) | +29% | +21% | +29% |
Read as leaving out cleaning fees, Awning's median misses were 17.8% on typical homes and 17.2% across all 24, the smallest all-home miss of any tool; Chalet's, scored the same way, were 25.8% and 25.6%. The table scores Rabbu without cleaning fees, as its page states, and the others with them.
| Measure, 12 homes abroad | AirROI | AirDNA |
|---|---|---|
| Homes priced | 12 of 12 | 12 of 12 |
| Median miss, 10 typical homes | 17.5% | 22.9% |
| Median miss, all 12 homes | 26.3% | 22.9% |
| Homes where it came closer than the other | 8 | 4 |
AirROI's headline is the median year for similar homes, and its misses follow from that: close on typical homes, under on the top quarter and over on the bottom quarter. For a home you expect to outperform, its 75th- and 90th-percentile figures are the ones to read.
Every tool missed most on homes far from their market's middle. A three-bedroom in Destin near the beach booked about $190,000, and every tool put it below that, by 22% to 57%. A four-bedroom in Kissimmee booked about $10,200, and every tool put it at more than five times that. Abroad, AirROI and AirDNA both put a Dubai flat in the bottom quarter of earners at more than twice its bookings. A calculator sees the address, the bedrooms, the baths and the guest count, not the photos, reviews or pricing that separate a top listing from a weak one.
Every home follows, grouped by its place in its market. A plus means the estimate was above what the home booked; Rabbu's misses are against the figure in brackets, without cleaning fees. PM marks the nine professionally managed US homes. Abroad, AirROI's figures are in each home's currency and AirDNA's in US dollars.
Show all 24 US homes
| Home: booked with cleaning fees (without) | AirROI | AirDNA | Rabbu, vs booked without cleaning | Awning | Chalet |
|---|---|---|---|---|---|
| Middle half, 11 homes | |||||
| Nashville, 3 bd: $82,000 ($65,720) | $70,219 (−14%) | $62,986 (−23%) | $59,710 (−9%) | $64,000 (−22%) | $55,920 (−32%) |
| Nashville, 4 bd: $85,707 ($68,151) | $92,662 (+8%) | $73,703 (−14%) | $66,766 (−2%) | $56,000 (−35%) | $79,621 (−7%) |
| Phoenix area, 2 bd: $30,694 ($24,459) | $26,343 (−14%) | $34,520 (+12%) | $41,858 (+71%) | $32,000 (+4%) | $32,769 (+7%) |
| Phoenix area, 3 bd: $57,663 ($52,263) | $61,664 (+7%) | $63,458 (+10%) | $64,090 (+23%) | $55,000 (−5%) | $65,757 (+14%) |
| Phoenix area, 4 bd: $94,466 ($89,811) | $50,489 (−47%) | $80,211 (−15%) | $102,080 (+14%) | $71,000 (−25%) | $53,008 (−44%) |
| Destin, Fla., 2 bd, PM: $48,960 ($43,920) | $61,061 (+25%) | $50,274 (+3%) | $49,500 (+13%) | $77,000 (+57%) | $64,809 (+32%) |
| Gatlinburg, Tenn., 3 bd: $73,558 ($64,480) | $65,368 (−11%) | $57,150 (−22%) | $68,164 (+6%) | $66,000 (−10%) | $73,505 (0%) |
| Gatlinburg, Tenn., 3 bd, PM: $74,806 ($66,486) | $66,217 (−11%) | $57,940 (−23%) | $63,302 (−5%) | $60,000 (−20%) | $61,124 (−18%) |
| Gatlinburg, Tenn., 4 bd, PM: $104,113 ($81,753) | $79,109 (−24%) | $71,015 (−32%) | $102,000 (+25%) | $69,000 (−34%) | $66,587 (−36%) |
| Lake of the Ozarks, Mo., 2 bd: $16,756 ($14,916) | $31,369 (+87%) | $20,404 (+22%) | $40,515 (+172%) | $36,000 (+115%) | $48,131 (+187%) |
| Lake of the Ozarks, Mo., 3 bd, PM: $39,319 ($34,567) | $50,108 (+27%) | $27,013 (−31%) | $40,829 (+18%) | $52,000 (+32%) | $50,053 (+27%) |
| Top quarter, 9 homes | |||||
| Nashville, 3 bd, PM: $135,656 ($104,681) | $91,272 (−33%) | $66,004 (−51%) | $49,859 (−52%) | $96,000 (−29%) | $84,137 (−38%) |
| Phoenix area, 3 bd: $93,501 ($79,101) | $36,820 (−61%) | $48,805 (−48%) | $44,895 (−43%) | $53,000 (−43%) | $50,081 (−46%) |
| Destin, Fla., 3 bd: $190,199 ($180,523) | $88,730 (−53%) | $81,866 (−57%) | $140,700 (−22%) | $132,000 (−31%) | $93,101 (−51%) |
| Destin, Fla., 3 bd, PM: $136,614 ($110,424) | $96,845 (−29%) | $106,000 (−22%) | $142,076 (+29%) | $126,000 (−8%) | $115,863 (−15%) |
| Lake of the Ozarks, Mo., 3 bd: $51,084 ($44,910) | $60,955 (+19%) | $36,751 (−28%) | $55,400 (+23%) | $90,000 (+76%) | $51,116 (0%) |
| Lake of the Ozarks, Mo., 4 bd, PM: $124,459 ($111,159) | $74,551 (−40%) | $57,829 (−54%) | $107,456 (−3%) | $106,000 (−15%) | $50,470 (−59%) |
| Kissimmee, Fla., 2 bd: $60,149 ($48,899) | $36,065 (−40%) | $41,936 (−30%) | $36,600 (−25%) | $85,000 (+41%) | $36,483 (−39%) |
| Kissimmee, Fla., 3 bd: $61,346 ($53,844) | $38,729 (−37%) | $40,585 (−34%) | $41,500 (−23%) | $57,000 (−7%) | $52,048 (−15%) |
| Kissimmee, Fla., 3 bd, PM: $61,605 ($51,245) | $42,151 (−32%) | $49,828 (−19%) | $50,531 (−1%) | $51,000 (−17%) | $50,522 (−18%) |
| Bottom quarter, 4 homes | |||||
| Nashville, 2 bd: $36,096 ($30,076) | $47,406 (+31%) | $35,121 (−3%) | $53,700 (+79%) | $27,000 (−25%) | $35,048 (−3%) |
| Destin, Fla., 4 bd, PM: $66,472 ($60,172) | $84,398 (+27%) | $97,842 (+47%) | $163,739 (+172%) | $97,000 (+46%) | $83,599 (+26%) |
| Gatlinburg, Tenn., 2 bd: $35,277 ($29,172) | $51,520 (+46%) | $39,267 (+11%) | No answer | $34,000 (−4%) | $46,600 (+32%) |
| Kissimmee, Fla., 4 bd: $10,151 ($8,263) | $52,177 (+414%) | $52,808 (+420%) | $51,600 (+524%) | $56,000 (+452%) | $61,658 (+507%) |
Show all 12 homes abroad
| Home: booked over 12 months | AirROI, local currency | AirDNA, US dollars |
|---|---|---|
| Rome, 2 bd, from the five-home test: €44,584 ($50,601) | €62,570 (+40%) | $93,833 (+85%) |
| Rome, 3 bd: €59,865 ($67,923) | €65,131 (+9%) | $75,114 (+11%) |
| Rome, 2 bd: €40,522 ($45,973) | €37,039 (−9%) | $33,997 (−26%) |
| Rome, 2 bd: €42,676 ($48,443) | €50,991 (+19%) | $37,806 (−22%) |
| Rio, 2 bd, from the five-home test: R$122,902 ($21,447) | R$123,491 (+0.5%) | $21,453 (+0.03%) |
| Rio, 2 bd: R$90,455 ($15,788) | R$142,973 (+58%) | $19,816 (+26%) |
| Rio, 2 bd, top quarter: R$327,917 ($57,235) | R$160,113 (−51%) | $57,355 (+0.2%) |
| Rio, 2 bd: R$89,207 ($15,570) | R$118,778 (+33%) | $38,527 (+147%) |
| Dubai, 2 bd, from the five-home test: AED 170,537 ($46,428) | AED 163,458 (−4%) | $44,434 (−4%) |
| Dubai, 2 bd, bottom quarter: AED 72,670 ($19,787) | AED 153,400 (+111%) | $42,069 (+113%) |
| Dubai, 2 bd: AED 190,561 ($51,881) | AED 125,803 (−34%) | $41,279 (−20%) |
| Dubai, 3 bd: AED 202,335 ($55,087) | AED 171,047 (−15%) | $41,909 (−24%) |
Why the calculators disagree
They measure different things. Some count the cleaning fees guests pay and some leave them out; some take off Airbnb's fee and some don't; occupancy can mean booked nights over the whole year or only over open nights; and each tool picks its own comparable homes and reports its own percentile, from the median to the 70th.
Similar percentages can describe different years. Chalet's 53% occupancy is booked days over the 284 days it assumes the home is open, about 150 booked nights. AirROI's 54% is booked nights over all 365, about 197. The two land within $5,000 of each other because Chalet pairs fewer nights with a higher rate, $424 against $349 per booked night.
Cleaning fees move the headline. AirROI counts the cleaning fees guests pay, and so does AirDNA, whose card for the Nashville home read "incl. $7,872 cleaning fee". Rabbu leaves them out, and Awning's pages read both ways. On a three-bedroom with a cleaning fee on every stay, that alone separates two honest estimates.
Airbnb's fee is the next gap. AirROI's figure comes before Airbnb's cut, Chalet takes a default 3% as a cost, and Awning's pages describe its figure both ways. Under the host-only fee, Airbnb's help center said on Oct. 1, 2026, "the entire fee is deducted from the host's payout. Most hosts pay 15.5%," so a host keeps about $84.50 of every $100 booked.
The comps and the percentile decide the rest. AirROI matched the home on bedrooms, baths and guests; AirDNA picked 15 comps, Rabbu 17 and Chalet 50, some of them downtown condos. AirROI's headline is the median of what similar homes earn, while BNBCalc labeled its figure the "70th revenue percentile" of its comps in AirROI's Sept. 27 run.
A single number hides the biggest variable, the operator. AirROI's 25th-to-75th-percentile band for the Nashville home runs from $46,456 to $94,358, and the difference between the two ends is mostly price level, reviews, photos and the nights a host blocks.
How to pick an Airbnb calculator
Match the tool to the decision in front of you:
- Buying, and want the full read free before anything else: AirROI, then check its comps against the home
- Buying or researching abroad: AirROI, with no account and in the local currency; AirDNA, with a free account and in US dollars
- A free read on a typical US home, in plain English: Rabbu
- Need a PDF for a lender or partner: Chalet, free, for US homes; BNBCalc, on its paid plan
- Thinking of hiring a manager: Awning, whose estimate comes from one
- Weighing Airbnb against a long-term lease on a US home for sale: Mashvisor, on a subscription we didn't test
- Building a product or a model: the AirROI API, from $0.01 per call, with the same data as the calculator
Rabbu vs AirDNA
Rabbu answered in plain English, with a range and 17 comparables. On typical US homes, its median miss was 13.7% to AirDNA's 21.8%; across all the homes, both were 22.9%, Rabbu's against booked revenue without cleaning fees and AirDNA's with them. AirDNA priced homes in Rome, Rio and Dubai, where Rabbu offered no match; its free plan locks the comps' revenue. For one US address, Rabbu is quicker; for market research or a home abroad, AirDNA.
BNBCalc vs AirDNA
BNBCalc's FAQ promises two free analyses, though on Oct. 2 its figure was behind a paid plan, offered with a 7-day trial; AirDNA gives a figure with a free account. Both take addresses outside the US. BNBCalc is the cheaper paid path to unlimited analyses, PDF reports and tax math, at $199 a year. For market data, AirDNA's Market Research plan and BNBCalc's Markets plan cost about the same, $400 and $399 a year, and AirDNA counts 15M+ active listings to BNBCalc's 10M+ Airbnb and Vrbo listings.
Calculator estimates and loans
Check what the lender accepts. Some DSCR lenders take an AirDNA projection; Ridge Street Capital counts 80% of one. For applications dated from Dec. 1, 2026, Fannie Mae counts short-term-rental income on a one-unit investment purchase only from a long-term rent schedule or data on three comparable rentals from the MLS or property managers, at 50% of the gross.
For the Nashville home, the five calculators that answered put a typical year between $54,000 and $68,702, and only AirROI and AirDNA answered at every address. What moves a listing from the low end of its range to the top is how it's run, and no calculator asks about that.
Frequently Asked Questions
It depends on the home: on the 11 typical homes among 24 US test homes, AirROI and Rabbu had the smallest median misses, 14.4% and 13.7%, with AirDNA's 21.8% within chance of both, while across all the US homes, AirDNA and Rabbu were closest, at 22.9% each to AirROI's 30.2%. Pooling the 21 typical homes in the US, Rome, Rio and Dubai, AirROI's median miss was 15.5% to AirDNA's 22.0%, a gap within chance; across all 36, AirDNA's was smaller, 22.9% to 30.2%.
AirROI was the only one to give a full result at every test address with no account. Rabbu and Chalet answered two addresses without one, then asked for a free account; Awning shows a rounded figure free and its rate and occupancy after a free sign-up; AirDNA needs a free account. Airbtics, BNBCalc and Mashvisor showed no figure for any test address without a paid plan on Oct. 2; BNBCalc's FAQ offers two free analyses, which our account had already used.
Partly. With a free account, Rentalizer gave a revenue figure, occupancy and daily rate for every test address, in the US and abroad, across 39 runs without a limit. The comps' revenue and occupancy, comp editing and the monthly projection stay locked. Market Research, $34 a month billed annually or $125 month to month, adds the customizable Rentalizer and comparable sets.
Partly. BNBCalc's FAQ says two property analyses are free without a plan, and the first ran without an account in AirROI's Sept. 27, 2026 comparison. On Oct. 2, a free account that already listed two analyses got a 7-day trial offer for the Calculator plan at all five test addresses, so the figure was behind a paid plan. The Calculator plan costs $30 a month or $199 a year; the Markets plan, $79 a month or $399 a year.
For a typical US home, Rabbu: it answers free in plain English, and its 13.7% median miss on typical US test homes was below AirDNA's 21.8%, though within chance, while across all the US homes each priced, the two tied at 22.9%. For a home outside the US, AirDNA: Rabbu takes US addresses only and leaves out cleaning fees, while AirDNA priced homes in Rome, Rio and Dubai with a free account, with its comps' revenue locked.
For a free figure, AirDNA: with a free account it priced all five test addresses on Oct. 2, while BNBCalc showed its figure only behind a paid plan. If you'll pay, BNBCalc's Calculator plan, $30 a month or $199 a year, is the cheaper path to unlimited analyses, PDF reports and tax and depreciation math; AirDNA's Market Research, $34 a month billed annually, adds comparable sets and demand data.
They measure different things. Some count the cleaning fees guests pay and some leave them out; some take off Airbnb's fee and some don't; occupancy can mean booked nights over the whole year or only over open nights; and each tool picks its own comparable homes and reports its own percentile, from the median to the 70th.
Check what the lender accepts. Some DSCR lenders take an AirDNA projection; Ridge Street Capital counts 80% of one. For applications dated from Dec. 1, 2026, Fannie Mae counts short-term-rental income on a one-unit investment purchase only from a long-term rent schedule or data on three comparable rentals from the MLS or property managers, at 50% of the gross.