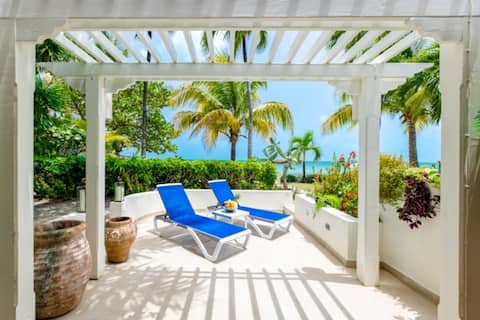
Blue Waters Airbnb Market Analysis 2026: Short Term Rental Data & Vacation Rental Statistics in Antigua, Antigua & Barbuda
Is Airbnb profitable in Blue Waters in 2026? Explore comprehensive Airbnb analytics for Blue Waters, Antigua, Antigua & Barbuda to uncover income potential. This 2026 STR market report for Blue Waters, based on AirROI data from February 2025 to January 2026, reveals key trends in the niche market of 35 active listings.
Whether you're considering an Airbnb investment in Blue Waters, optimizing your existing vacation rental, or exploring rental arbitrage opportunities, understanding the Blue Waters Airbnb data is crucial. Leveraging the low regulation environment is key to maximizing your short term rental income potential. Let's dive into the specifics.
Key Blue Waters Airbnb Performance Metrics Overview
Monthly Airbnb Revenue Variations & Income Potential in Blue Waters (2026)
Understanding the monthly revenue variations for Airbnb listings in Blue Waters is key to maximizing your short term rental income potential. Seasonality significantly impacts earnings. Our analysis, based on data from the past 12 months, shows that the peak revenue month for STRs in Blue Waters is typically February, while October often presents the lowest earnings, highlighting opportunities for strategic pricing adjustments during shoulder and low seasons. Explore the typical Airbnb income in Blue Waters across different performance tiers:
- Best-in-class properties (Top 10%) achieve $6,478+ monthly, often utilizing dynamic pricing and superior guest experiences.
- Strong performing properties (Top 25%) earn $3,969 or more, indicating effective management and desirable locations/amenities.
- Typical properties (Median) generate around $2,486 per month, representing the average market performance.
- Entry-level properties (Bottom 25%) see earnings around $1,433, often with potential for optimization.
Average Monthly Airbnb Earnings Trend in Blue Waters
Blue Waters Airbnb Occupancy Rate Trends (2026)
Maximize your bookings by understanding the Blue Waters STR occupancy trends. Seasonal demand shifts significantly influence how often properties are booked. Typically, Februarysees the highest demand (peak season occupancy), while October experiences the lowest (low season). Effective strategies, like adjusting minimum stays or offering promotions, can boost occupancy during slower periods. Here's how different property tiers perform in Blue Waters:
- Best-in-class properties (Top 10%) achieve 84%+ occupancy, indicating high desirability and potentially optimized availability.
- Strong performing properties (Top 25%) maintain 70% or higher occupancy, suggesting good market fit and guest satisfaction.
- Typical properties (Median) have an occupancy rate around 51%.
- Entry-level properties (Bottom 25%) average 26% occupancy, potentially facing higher vacancy.
Average Monthly Occupancy Rate Trend in Blue Waters
Average Daily Rate (ADR) Airbnb Trends in Blue Waters (2026)
Effective short term rental pricing strategy in Blue Waters involves understanding monthly ADR fluctuations. The Average Daily Rate (ADR) for Airbnb in Blue Waters typically peaks in January and dips lowest during October. Leveraging Airbnb dynamic pricing tools or strategies based on this seasonality can significantly boost revenue. Here's a look at the typical nightly rates achieved:
- Best-in-class properties (Top 10%) command rates of $374+ per night, often due to premium features or locations.
- Strong performing properties (Top 25%) achieve nightly rates of $284 or more.
- Typical properties (Median) charge around $181 per night.
- Entry-level properties (Bottom 25%) earn around $133 per night.
Average Daily Rate (ADR) Trend by Month in Blue Waters
Get Live Blue Waters Market Intelligence 👇

Explore Real-time Analytics
Airbnb Seasonality Analysis & Trends in Blue Waters (2026)
Peak Season (February, March, April)
- Revenue averages $4,255 per month
- Occupancy rates average 65.4%
- Daily rates average $226
Shoulder Season
- Revenue averages $3,079 per month
- Occupancy maintains around 46.8%
- Daily rates hold near $226
Low Season (June, September, October)
- Revenue drops to average $2,338 per month
- Occupancy decreases to average 39.1%
- Daily rates adjust to average $224
Seasonality Insights for Blue Waters
- The Airbnb seasonality in Blue Waters shows highly seasonal trends requiring careful strategy. While the sections above show seasonal averages, it's also insightful to look at the extremes:
- During the high season, the absolute peak month showcases Blue Waters's highest earning potential, with monthly revenues capable of climbing to $4,639, occupancy reaching a high of 71.9%, and ADRs peaking at $233.
- Conversely, the slowest single month of the year, typically falling within the low season, marks the market's lowest point. In this month, revenue might dip to $2,185, occupancy could drop to 37.2%, and ADRs may adjust down to $218.
- Understanding both the seasonal averages and these monthly peaks and troughs in revenue, occupancy, and ADR is crucial for maximizing your Airbnb profit potential in Blue Waters.
Seasonal Strategies for Maximizing Profit
- Peak Season: Maximize revenue through premium pricing and potentially longer minimum stays. Ensure high availability.
- Low Season: Offer competitive pricing, special promotions (e.g., extended stay discounts), and flexible cancellation policies. Target off-season travelers like remote workers or budget-conscious guests.
- Shoulder Seasons: Implement dynamic pricing that balances peak and low rates. Target weekend travelers or specific events. Offer slightly more flexible terms than peak season.
- Regularly analyze your own performance against these Blue Waters seasonality benchmarks and adjust your pricing and availability strategy accordingly.
Best Areas for Airbnb Investment in Blue Waters (2026)
Exploring the top neighborhoods for short-term rentals in Blue Waters? This section highlights key areas, outlining why they are attractive for hosts and guests, along with notable local attractions. Consider these locations based on your target guest profile and investment strategy.
| Neighborhood / Area | Why Host Here? (Target Guests & Appeal) | Key Attractions & Landmarks |
|---|---|---|
| Dickenson Bay | A beautiful and popular beach area with crystal-clear waters and soft white sand. It's perfect for those looking to enjoy a beach vacation, making it a prime location for Airbnb rentals. | Dickenson Bay Beach, Cinnamon Hill, The Beach Bar, Sandals Resort, Diving and Snorkeling spots |
| Jolly Harbour | A vibrant marina community with a mix of residential properties and vacation homes. Ideal for travelers interested in water sports, golf, and lush landscapes. | Jolly Harbour Marina, Jolly Beach, Golf at Jolly Harbour Golf Club, Water sports activities, Restaurants and bars |
| English Harbour | Famous for its historical significance and stunning views, English Harbour attracts sailors and history enthusiasts. Perfect for unique, charming accommodations. | Nelson's Dockyard, Shirley Heights, Pillars of Hercules, Scenic lookout points, Local crafts and markets |
| St. John's | The capital city with a lively atmosphere, great shopping, dining, and cultural sites. Attracts a variety of tourists looking to experience local culture. | St. John's Cathedral, Heritage Quay, Museum of Antigua and Barbuda, Local markets, Shirley Heights lookout |
| Half Moon Bay | Known for its stunning natural beauty and serene environment, it appeals to travelers looking for relaxation and breathtaking landscapes. | Half Moon Bay Beach, Hiking trails, Snorkeling spots, Secluded areas for relaxation |
| Antigua Rainforest Canopy | An adventurous area for nature lovers and thrill-seekers, offering unique visitor experiences such as zip-lining and eco-tours. | Canopy zip-lining tours, Hiking in the rainforest, Wildlife spotting, Eco-tours |
| Falmouth Harbour | A picturesque harbour with a relaxed vibe, it's popular among yachtsmen and travelers looking for a laid-back atmosphere. | Falmouth Harbour Marina, Local restaurants, Beach access, Boat tours |
| Long Bay | A stunning beach known for its tranquility and beauty, ideal for romantic getaways and family vacations, attracting tourists looking for a peaceful retreat. | Long Bay Beach, Water sports, Luxury resorts nearby, Culinary experiences |
Understanding Airbnb License Requirements & STR Laws in Blue Waters (2026)
While Blue Waters, Antigua, Antigua & Barbuda currently shows low STR regulations, specific Airbnb license requirements might still exist or change. Always verify the latest short term rental regulations and Airbnb license requirements directly with local government authorities for Blue Waters to ensure full compliance before hosting.
(Source: AirROI data, 2026, finding no licensed listings among those analyzed)
Top Performing Airbnb Properties in Blue Waters (2026)
Benchmark your potential! Explore examples of top-performing Airbnb properties in Blue Watersbased on Trailing Twelve Month (TTM) revenue. Analyze their characteristics, revenue, occupancy rate, and ADR to understand what drives success in this market.

Villa FantaSea, Upper Floor (Hot Summer Sale!)
Entire Place • 2 bedrooms

Unique Sea View Villa 5 minutes from the Beach
Entire Place • 3 bedrooms
Beachside Condo- Leave Footprints, Take Memories
Entire Place • 1 bedroom

Spring Promo! Vintage 1-Bed Poolside Escape
Entire Place • 1 bedroom
Villa FantaSea, Antigua (Hot Summer Sale!)
Entire Place • 3 bedrooms

Cozy sea view apartment close to the beach
Entire Place • 2 bedrooms
Note: Performance varies based on location, size, amenities, seasonality, and management quality. Data reflects the past 12 months.
Top Performing Airbnb Hosts in Blue Waters (2026)
Learn from the best! This table showcases top-performing Airbnb hosts in Blue Waters based on the number of properties managed and estimated total revenue over the past year. Analyze their scale and performance metrics.
| Host Name | Properties | Grossing Revenue | Stay Reviews | Avg Rating |
|---|---|---|---|---|
| Vanessa | 2 | $181,239 | 48 | 4.99/5.0 |
| Marco | 3 | $93,023 | 424 | 4.90/5.0 |
| Ilaria | 1 | $80,330 | 58 | 4.57/5.0 |
| Gayle | 1 | $77,227 | 62 | 4.95/5.0 |
| Lorraine | 1 | $62,212 | 26 | 4.96/5.0 |
| Simonetta | 2 | $58,856 | 78 | 4.89/5.0 |
| Nicole | 2 | $53,643 | 272 | 4.80/5.0 |
| Lis | 1 | $46,900 | 23 | 4.96/5.0 |
| Marlon | 2 | $39,311 | 73 | 4.83/5.0 |
| Guirong | 1 | $36,213 | 102 | 4.92/5.0 |
Analyzing the strategies of top hosts, such as their property selection, pricing, and guest communication, can offer valuable lessons for optimizing your own Airbnb operations in Blue Waters.
Dive Deeper: Advanced Blue Waters STR Market Data (2026)
Ready to unlock more insights? AirROI provides access to advanced metrics and comprehensive Airbnb data for Blue Waters. Explore detailed analytics beyond this report to refine your investment strategy, optimize pricing, and maximize your vacation rental profits.
Explore Advanced MetricsBlue Waters Short-Term Rental Market Composition (2026): Property & Room Types
Room Type Distribution
Property Type Distribution
Market Composition Insights for Blue Waters
- The Blue Waters Airbnb market composition is heavily skewed towards Entire Home/Apt listings, which make up 91.4% of the 35 active rentals. This indicates strong guest preference for privacy and space.
- Looking at the property type distribution in Blue Waters, Apartment/Condo properties are the most common (62.9%), reflecting the local real estate landscape.
- Houses represent a significant 28.6% portion, catering likely to families or larger groups.
- The presence of 5.7% Hotel/Boutique listings indicates integration with traditional hospitality.
- Smaller segments like others (combined 2.9%) offer potential for unique stay experiences.
Blue Waters Airbnb Room Capacity Analysis (2026): Bedroom Distribution
Distribution of Listings by Number of Bedrooms
Room Capacity Insights for Blue Waters
- The dominant room capacity in Blue Waters is 1 bedroom listings, making up 48.6% of the market. This suggests a strong demand for properties suitable for couples or solo travelers.
- Together, 1 bedroom and 2 bedrooms properties represent 82.9% of the active Airbnb listings in Blue Waters, indicating a high concentration in these sizes.
- Listings with 3+ bedrooms (5.7%) represent a smaller niche, potentially indicating an underserved market for larger group accommodations in Blue Waters.
Blue Waters Vacation Rental Guest Capacity Trends (2026)
Distribution of Listings by Guest Capacity
Guest Capacity Insights for Blue Waters
- The most common guest capacity trend in Blue Waters vacation rentals is listings accommodating 2 guests (45.7%). This suggests the primary traveler segment is likely couples or solo travelers.
- Properties designed for 2 guests and 4 guests dominate the Blue Waters STR market, accounting for 82.8% of listings.
- A significant 45.7% of listings cater specifically to 1-2 guests, highlighting strong demand from couples and solo travelers in Blue Waters.
- 11.4% of properties accommodate 6+ guests, serving the market segment for larger families or group travel in Blue Waters.
- On average, properties in Blue Waters are equipped to host 3.2 guests.
Blue Waters Airbnb Booking Patterns (2026): Available vs. Booked Days
Available Days Distribution
Booked Days Distribution
Booking Pattern Insights for Blue Waters
- The most common availability pattern in Blue Waters falls within the 271-366 days range, representing 42.9% of listings. This suggests many properties have significant open periods on their calendars.
- Approximately 60.0% of listings show high availability (181+ days open annually), indicating potential for increased bookings or specific owner usage patterns.
- For booked days, the 31-90 days range is most frequent in Blue Waters (34.3%), reflecting common guest stay durations or potential owner blocking patterns.
- A notable 40.0% of properties secure long booking periods (181+ days booked per year), highlighting successful long-term rental strategies or significant owner usage.
Blue Waters Airbnb Minimum Stay Requirements Analysis
Distribution of Listings by Minimum Night Requirement
1 Night
9 listings
25.7% of total
2 Nights
4 listings
11.4% of total
3 Nights
7 listings
20% of total
4-6 Nights
7 listings
20% of total
30+ Nights
8 listings
22.9% of total
Key Insights
- The most prevalent minimum stay requirement in Blue Waters is 1 Night, adopted by 25.7% of listings. This highlights the market's preference for shorter, flexible bookings.
- A significant segment (22.9%) caters to monthly stays (30+ nights) in Blue Waters, pointing to opportunities in the extended-stay market.
Recommendations
- Align with the market by considering a 1 Night minimum stay, as 25.7% of Blue Waters hosts use this setting.
- If feasible, allowing 1-night stays, especially midweek or during low season, could capture last-minute bookings, as only 25.7% currently do.
- Explore offering discounts for stays of 30+ nights to attract the 22.9% of the market seeking extended stays.
- Adjust minimum nights based on seasonality – potentially shorter during low season and longer during peak demand periods in Blue Waters.
Blue Waters Airbnb Cancellation Policy Trends Analysis (2026)
Limited
1 listings
2.9% of total
Flexible
7 listings
20% of total
Moderate
13 listings
37.1% of total
Firm
14 listings
40% of total
Cancellation Policy Insights for Blue Waters
- The prevailing Airbnb cancellation policy trend in Blue Waters is Firm, used by 40% of listings.
- There's a relatively balanced mix between guest-friendly (57.1%) and stricter (40.0%) policies, offering choices for different guest needs.
Recommendations for Hosts
- Consider adopting a Firm policy to align with the 40% market standard in Blue Waters.
- Regularly review your cancellation policy against competitors and market demand shifts in Blue Waters.
Blue Waters STR Booking Lead Time Analysis (2026)
Average Booking Lead Time by Month
Booking Lead Time Insights for Blue Waters
- The overall average booking lead time for vacation rentals in Blue Waters is 69 days.
- Guests book furthest in advance for stays during December (average 109 days), likely coinciding with peak travel demand or local events.
- The shortest booking windows occur for stays in June (average 38 days), indicating more last-minute travel plans during this time.
- Seasonally, Winter (101 days avg.) sees the longest lead times, while Summer (52 days avg.) has the shortest, reflecting typical travel planning cycles.
Recommendations for Hosts
- Use the overall average lead time (69 days) as a baseline for your pricing and availability strategy in Blue Waters.
- For December stays, consider implementing length-of-stay discounts or slightly higher rates for bookings made less than 109 days out to capitalize on advance planning.
- Target marketing efforts for the Winter season well in advance (at least 101 days) to capture early planners.
- Monitor your own booking lead times against these Blue Waters averages to identify opportunities for dynamic pricing adjustments.
Popular & Essential Airbnb Amenities in Blue Waters (2026)
Amenity Prevalence
Amenity Insights for Blue Waters
- Essential amenities in Blue Waters that guests expect include: Free parking on premises. Lacking these (this) could significantly impact bookings.
- Popular amenities like Air conditioning, Iron, Wifi are common but not universal. Offering these can provide a competitive edge.
- Warning: Wifi is not universally provided but is considered essential globally. Ensure reliable Wifi is offered.
Recommendations for Hosts
- Ensure your listing includes all essential amenities for Blue Waters: Free parking on premises.
- Prioritize adding missing essentials: Free parking on premises.
- Consider adding popular differentiators like Air conditioning or Iron to increase appeal.
- Highlight unique or less common amenities you offer (e.g., hot tub, dedicated workspace, EV charger) in your listing description and photos.
- Regularly check competitor amenities in Blue Waters to stay competitive.
Blue Waters Airbnb Guest Demographics & Profile Analysis (2026)
Guest Profile Summary for Blue Waters
- The typical guest profile for Airbnb in Blue Waters consists of predominantly international visitors (100%), with top international origins including United Kingdom, typically belonging to the Post-2000s (Gen Z/Alpha) group (50%), primarily speaking English or Spanish.
- Domestic travelers account for 0.0% of guests.
- Key international markets include United States (52.7%) and United Kingdom (24.6%).
- Top languages spoken are English (59.1%) followed by Spanish (14.1%).
- A significant demographic segment is the Post-2000s (Gen Z/Alpha) group, representing 50% of guests.
Recommendations for Hosts
- Focus marketing internationally, particularly towards travelers from United Kingdom.
- Tailor amenities and listing descriptions to appeal to the dominant Post-2000s (Gen Z/Alpha) demographic (e.g., highlight fast WiFi, smart home features, local guides).
- Highlight unique local experiences or amenities relevant to the primary guest profile.
- Consider seasonal promotions aligned with peak travel times for key origin markets.
Nearby Short-Term Rental Market Comparison
How does the Blue Waters Airbnb market stack up against its neighbors? Compare key performance metrics like average monthly revenue, ADR, and occupancy rates in surrounding areas to understand the broader regional STR landscape.
| Market | Active Properties | Monthly Revenue | Daily Rate | Avg. Occupancy |
|---|---|---|---|---|
| Saint Barthélemy | 554 | $5,892 | $1034.64 | 37% |
| Fleming Estate | 15 | $5,884 | $572.58 | 46% |
| Bolans | 81 | $3,659 | $526.19 | 36% |
| Crosbies | 17 | $3,348 | $520.95 | 40% |
| Christian Hill | 13 | $2,641 | $479.55 | 35% |
| Cotton Ground | 34 | $2,575 | $384.15 | 32% |
| The Valley | 37 | $2,538 | $505.36 | 35% |
| English Harbour | 134 | $2,498 | $443.95 | 34% |
| Saint John | 21 | $2,421 | $225.35 | 42% |
| East End | 22 | $2,394 | $413.17 | 34% |