Saint John Airbnb Market Analysis 2026: Short Term Rental Data & Vacation Rental Statistics in Antigua, Antigua & Barbuda
Is Airbnb profitable in Saint John in 2026? Explore comprehensive Airbnb analytics for Saint John, Antigua, Antigua & Barbuda to uncover income potential. This 2026 STR market report for Saint John, based on AirROI data from February 2025 to January 2026, reveals key trends in the niche market of 21 active listings.
Whether you're considering an Airbnb investment in Saint John, optimizing your existing vacation rental, or exploring rental arbitrage opportunities, understanding the Saint John Airbnb data is crucial. Leveraging the low regulation environment is key to maximizing your short term rental income potential. Let's dive into the specifics.
Key Saint John Airbnb Performance Metrics Overview
Monthly Airbnb Revenue Variations & Income Potential in Saint John (2026)
Understanding the monthly revenue variations for Airbnb listings in Saint John is key to maximizing your short term rental income potential. Seasonality significantly impacts earnings. Our analysis, based on data from the past 12 months, shows that the peak revenue month for STRs in Saint John is typically February, while September often presents the lowest earnings, highlighting opportunities for strategic pricing adjustments during shoulder and low seasons. Explore the typical Airbnb income in Saint John across different performance tiers:
- Best-in-class properties (Top 10%) achieve $6,381+ monthly, often utilizing dynamic pricing and superior guest experiences.
- Strong performing properties (Top 25%) earn $4,347 or more, indicating effective management and desirable locations/amenities.
- Typical properties (Median) generate around $2,633 per month, representing the average market performance.
- Entry-level properties (Bottom 25%) see earnings around $1,570, often with potential for optimization.
Average Monthly Airbnb Earnings Trend in Saint John
Saint John Airbnb Occupancy Rate Trends (2026)
Maximize your bookings by understanding the Saint John STR occupancy trends. Seasonal demand shifts significantly influence how often properties are booked. Typically, Februarysees the highest demand (peak season occupancy), while May experiences the lowest (low season). Effective strategies, like adjusting minimum stays or offering promotions, can boost occupancy during slower periods. Here's how different property tiers perform in Saint John:
- Best-in-class properties (Top 10%) achieve 77%+ occupancy, indicating high desirability and potentially optimized availability.
- Strong performing properties (Top 25%) maintain 60% or higher occupancy, suggesting good market fit and guest satisfaction.
- Typical properties (Median) have an occupancy rate around 41%.
- Entry-level properties (Bottom 25%) average 23% occupancy, potentially facing higher vacancy.
Average Monthly Occupancy Rate Trend in Saint John
Average Daily Rate (ADR) Airbnb Trends in Saint John (2026)
Effective short term rental pricing strategy in Saint John involves understanding monthly ADR fluctuations. The Average Daily Rate (ADR) for Airbnb in Saint John typically peaks in January and dips lowest during September. Leveraging Airbnb dynamic pricing tools or strategies based on this seasonality can significantly boost revenue. Here's a look at the typical nightly rates achieved:
- Best-in-class properties (Top 10%) command rates of $319+ per night, often due to premium features or locations.
- Strong performing properties (Top 25%) achieve nightly rates of $273 or more.
- Typical properties (Median) charge around $224 per night.
- Entry-level properties (Bottom 25%) earn around $151 per night.
Average Daily Rate (ADR) Trend by Month in Saint John
Get Live Saint John Market Intelligence 👇

Explore Real-time Analytics
Airbnb Seasonality Analysis & Trends in Saint John (2026)
Peak Season (February, March, April)
- Revenue averages $4,854 per month
- Occupancy rates average 67.4%
- Daily rates average $235
Shoulder Season
- Revenue averages $2,869 per month
- Occupancy maintains around 38.2%
- Daily rates hold near $227
Low Season (May, June, September)
- Revenue drops to average $2,136 per month
- Occupancy decreases to average 30.7%
- Daily rates adjust to average $218
Seasonality Insights for Saint John
- The Airbnb seasonality in Saint John shows highly seasonal trends requiring careful strategy. While the sections above show seasonal averages, it's also insightful to look at the extremes:
- During the high season, the absolute peak month showcases Saint John's highest earning potential, with monthly revenues capable of climbing to $5,157, occupancy reaching a high of 70.5%, and ADRs peaking at $243.
- Conversely, the slowest single month of the year, typically falling within the low season, marks the market's lowest point. In this month, revenue might dip to $2,078, occupancy could drop to 28.5%, and ADRs may adjust down to $205.
- Understanding both the seasonal averages and these monthly peaks and troughs in revenue, occupancy, and ADR is crucial for maximizing your Airbnb profit potential in Saint John.
Seasonal Strategies for Maximizing Profit
- Peak Season: Maximize revenue through premium pricing and potentially longer minimum stays. Ensure high availability.
- Low Season: Offer competitive pricing, special promotions (e.g., extended stay discounts), and flexible cancellation policies. Target off-season travelers like remote workers or budget-conscious guests.
- Shoulder Seasons: Implement dynamic pricing that balances peak and low rates. Target weekend travelers or specific events. Offer slightly more flexible terms than peak season.
- Regularly analyze your own performance against these Saint John seasonality benchmarks and adjust your pricing and availability strategy accordingly.
Best Areas for Airbnb Investment in Saint John (2026)
Exploring the top neighborhoods for short-term rentals in Saint John? This section highlights key areas, outlining why they are attractive for hosts and guests, along with notable local attractions. Consider these locations based on your target guest profile and investment strategy.
| Neighborhood / Area | Why Host Here? (Target Guests & Appeal) | Key Attractions & Landmarks |
|---|---|---|
| Dickenson Bay | One of the most popular beaches in Antigua, known for its beautiful white sand and clear waters. Ideal for beachgoers and tourists looking for water activities. | Dickenson Bay Beach, Watersports, Beachfront restaurants, Sunset cruises, Nearby resorts |
| English Harbour | A historic area known for its stunning harbor views, sailing opportunities, and cultural significance. Attracts yachting enthusiasts and history buffs. | Nelson's Dockyard, Shirley Heights, Pigeon Point Beach, Various sailing events, Art galleries |
| Saint John's | The capital city with vibrant local markets, nightlife, and historic sites. Offers visitors a taste of Antiguan culture and convenience for accessing amenities. | Heritage Quay, St. John's Cathedral, Antigua Market, Museum of Antigua and Barbuda, Fort James Beach |
| Jolly Harbour | A bustling marina area known for its luxurious villas and golf course. Popular for recreational boating and beach activities. | Jolly Harbour Marina, Jolly Beach, Golf course, Water sports activities, Fine dining |
| Half Moon Bay | A picturesque beach known for its breathtaking landscapes and tranquil atmosphere. Preferred by those seeking a quieter, more relaxing vacation. | Half Moon Bay Beach, Nature trails, Secluded spots, Snorkeling, Wildlife watching |
| Cades Reef | Famous for exceptional snorkeling and diving experiences. Appeals to adventure seekers and ocean lovers. | Cades Reef snorkeling, Diving sites, Boat tours, Marine biodiversity, Coral reefs |
| Falmouth Harbour | Known for its upscale yacht community and vibrant nightlife, it attracts affluent travelers and those interested in sailing. | Falmouth Marina, Dining and nightlife, Yacht watching, Beach access, Historical forts |
| Runaway Bay | A beautiful bay with calm waters, perfect for swimming and water sports. Great for families and tourists looking for leisure activities. | Runaway Bay Beach, Water sports rentals, Beach bars, Family-friendly activities, Stunning views |
Understanding Airbnb License Requirements & STR Laws in Saint John (2026)
While Saint John, Antigua, Antigua & Barbuda currently shows low STR regulations, specific Airbnb license requirements might still exist or change. Always verify the latest short term rental regulations and Airbnb license requirements directly with local government authorities for Saint John to ensure full compliance before hosting.
(Source: AirROI data, 2026, finding no licensed listings among those analyzed)
Top Performing Airbnb Properties in Saint John (2026)
Benchmark your potential! Explore examples of top-performing Airbnb properties in Saint Johnbased on Trailing Twelve Month (TTM) revenue. Analyze their characteristics, revenue, occupancy rate, and ADR to understand what drives success in this market.

Spacious 2 BR Oceanfront Villa w/Gorgeous Views
Entire Place • 2 bedrooms

Little Bay Villa 40 Paces from the Caribbean Sea!
Entire Place • 1 bedroom

Beach Front ! Sea Views! Balcony + Pool!
Entire Place • 1 bedroom

Charming One BR Villa on Dickenson Bay
Entire Place • 1 bedroom
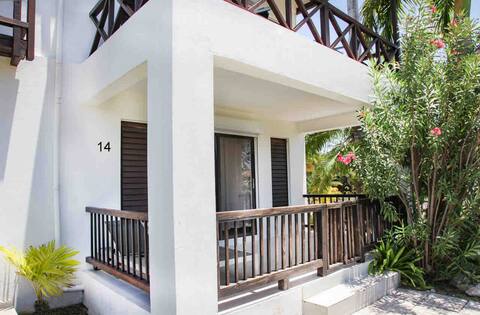
Ground floor apartment #14
Entire Place • 2 bedrooms
Luxurious, Pool, Resort Style! Steps to Beach!
Entire Place • 1 bedroom
Note: Performance varies based on location, size, amenities, seasonality, and management quality. Data reflects the past 12 months.
Top Performing Airbnb Hosts in Saint John (2026)
Learn from the best! This table showcases top-performing Airbnb hosts in Saint John based on the number of properties managed and estimated total revenue over the past year. Analyze their scale and performance metrics.
| Host Name | Properties | Grossing Revenue | Stay Reviews | Avg Rating |
|---|---|---|---|---|
| Avrs Ltd. | 6 | $172,645 | 308 | 4.60/5.0 |
| Sarah | 2 | $120,720 | 80 | 4.97/5.0 |
| Elinor | 3 | $88,416 | 133 | 4.77/5.0 |
| Jasia, Stew & Martina | 1 | $73,758 | 49 | 4.86/5.0 |
| Cathy | 3 | $59,457 | 37 | 4.97/5.0 |
| Leif | 1 | $30,020 | 236 | 4.90/5.0 |
| Elizabeth And Garfield | 1 | $25,663 | 98 | 4.99/5.0 |
| Ernesta | 1 | $20,280 | 96 | 4.89/5.0 |
| Karen | 1 | $8,204 | 26 | 4.81/5.0 |
| Richard | 1 | $7,890 | 4 | 5.00/5.0 |
Analyzing the strategies of top hosts, such as their property selection, pricing, and guest communication, can offer valuable lessons for optimizing your own Airbnb operations in Saint John.
Dive Deeper: Advanced Saint John STR Market Data (2026)
Ready to unlock more insights? AirROI provides access to advanced metrics and comprehensive Airbnb data for Saint John. Explore detailed analytics beyond this report to refine your investment strategy, optimize pricing, and maximize your vacation rental profits.
Explore Advanced MetricsSaint John Short-Term Rental Market Composition (2026): Property & Room Types
Room Type Distribution
Property Type Distribution
Market Composition Insights for Saint John
- The Saint John Airbnb market composition is heavily skewed towards Entire Home/Apt listings, which make up 100% of the 21 active rentals. This indicates strong guest preference for privacy and space.
- Looking at the property type distribution in Saint John, Apartment/Condo properties are the most common (81%), reflecting the local real estate landscape.
- Smaller segments like others (combined 4.8%) offer potential for unique stay experiences.
Saint John Airbnb Room Capacity Analysis (2026): Bedroom Distribution
Distribution of Listings by Number of Bedrooms
Room Capacity Insights for Saint John
- The dominant room capacity in Saint John is 1 bedroom listings, making up 47.6% of the market. This suggests a strong demand for properties suitable for couples or solo travelers.
- Together, 1 bedroom and 2 bedrooms properties represent 80.9% of the active Airbnb listings in Saint John, indicating a high concentration in these sizes.
Saint John Vacation Rental Guest Capacity Trends (2026)
Distribution of Listings by Guest Capacity
Guest Capacity Insights for Saint John
- The most common guest capacity trend in Saint John vacation rentals is listings accommodating 2 guests (47.6%). This suggests the primary traveler segment is likely couples or solo travelers.
- Properties designed for 2 guests and 4 guests dominate the Saint John STR market, accounting for 76.2% of listings.
- A significant 47.6% of listings cater specifically to 1-2 guests, highlighting strong demand from couples and solo travelers in Saint John.
- On average, properties in Saint John are equipped to host 3.0 guests.
Saint John Airbnb Booking Patterns (2026): Available vs. Booked Days
Available Days Distribution
Booked Days Distribution
Booking Pattern Insights for Saint John
- The most common availability pattern in Saint John falls within the 271-366 days range, representing 42.9% of listings. This suggests many properties have significant open periods on their calendars.
- Approximately 76.2% of listings show high availability (181+ days open annually), indicating potential for increased bookings or specific owner usage patterns.
- For booked days, the 91-180 days range is most frequent in Saint John (38.1%), reflecting common guest stay durations or potential owner blocking patterns.
- A notable 23.8% of properties secure long booking periods (181+ days booked per year), highlighting successful long-term rental strategies or significant owner usage.
Saint John Airbnb Minimum Stay Requirements Analysis
Distribution of Listings by Minimum Night Requirement
1 Night
1 listings
4.8% of total
2 Nights
6 listings
28.6% of total
3 Nights
8 listings
38.1% of total
4-6 Nights
1 listings
4.8% of total
30+ Nights
5 listings
23.8% of total
Key Insights
- The most prevalent minimum stay requirement in Saint John is 3 Nights, adopted by 38.1% of listings. This highlights the market's preference for longer commitments.
- A significant segment (23.8%) caters to monthly stays (30+ nights) in Saint John, pointing to opportunities in the extended-stay market.
Recommendations
- Align with the market by considering a 3 Nights minimum stay, as 38.1% of Saint John hosts use this setting.
- If feasible, allowing 1-night stays, especially midweek or during low season, could capture last-minute bookings, as only 4.8% currently do.
- Explore offering discounts for stays of 30+ nights to attract the 23.8% of the market seeking extended stays.
- Adjust minimum nights based on seasonality – potentially shorter during low season and longer during peak demand periods in Saint John.
Saint John Airbnb Cancellation Policy Trends Analysis (2026)
Flexible
10 listings
47.6% of total
Moderate
3 listings
14.3% of total
Firm
8 listings
38.1% of total
Cancellation Policy Insights for Saint John
- The prevailing Airbnb cancellation policy trend in Saint John is Flexible, used by 47.6% of listings.
- There's a relatively balanced mix between guest-friendly (61.9%) and stricter (38.1%) policies, offering choices for different guest needs.
Recommendations for Hosts
- Consider adopting a Flexible policy to align with the 47.6% market standard in Saint John.
- Regularly review your cancellation policy against competitors and market demand shifts in Saint John.
Saint John STR Booking Lead Time Analysis (2026)
Average Booking Lead Time by Month
Booking Lead Time Insights for Saint John
- The overall average booking lead time for vacation rentals in Saint John is 79 days.
- Guests book furthest in advance for stays during December (average 130 days), likely coinciding with peak travel demand or local events.
- The shortest booking windows occur for stays in May (average 34 days), indicating more last-minute travel plans during this time.
- Seasonally, Winter (122 days avg.) sees the longest lead times, while Summer (60 days avg.) has the shortest, reflecting typical travel planning cycles.
Recommendations for Hosts
- Use the overall average lead time (79 days) as a baseline for your pricing and availability strategy in Saint John.
- For December stays, consider implementing length-of-stay discounts or slightly higher rates for bookings made less than 130 days out to capitalize on advance planning.
- Target marketing efforts for the Winter season well in advance (at least 122 days) to capture early planners.
- Monitor your own booking lead times against these Saint John averages to identify opportunities for dynamic pricing adjustments.
Popular & Essential Airbnb Amenities in Saint John (2026)
Amenity Prevalence
Amenity Insights for Saint John
- Essential amenities in Saint John that guests expect include: Free parking on premises, TV, Wifi. Lacking these (any) could significantly impact bookings.
- Popular amenities like Air conditioning, Hangers, Essentials are common but not universal. Offering these can provide a competitive edge.
Recommendations for Hosts
- Ensure your listing includes all essential amenities for Saint John: Free parking on premises, TV, Wifi.
- Prioritize adding missing essentials: TV, Wifi.
- Consider adding popular differentiators like Air conditioning or Hangers to increase appeal.
- Highlight unique or less common amenities you offer (e.g., hot tub, dedicated workspace, EV charger) in your listing description and photos.
- Regularly check competitor amenities in Saint John to stay competitive.
Saint John Airbnb Guest Demographics & Profile Analysis (2026)
Guest Profile Summary for Saint John
- The typical guest profile for Airbnb in Saint John consists of predominantly international visitors (100%), with top international origins including United Kingdom, typically belonging to the Post-2000s (Gen Z/Alpha) group (50%), primarily speaking English or French.
- Domestic travelers account for 0.0% of guests.
- Key international markets include United States (57.3%) and United Kingdom (23.2%).
- Top languages spoken are English (60.8%) followed by French (13.7%).
- A significant demographic segment is the Post-2000s (Gen Z/Alpha) group, representing 50% of guests.
Recommendations for Hosts
- Focus marketing internationally, particularly towards travelers from United Kingdom.
- Tailor amenities and listing descriptions to appeal to the dominant Post-2000s (Gen Z/Alpha) demographic (e.g., highlight fast WiFi, smart home features, local guides).
- Highlight unique local experiences or amenities relevant to the primary guest profile.
- Consider seasonal promotions aligned with peak travel times for key origin markets.
Nearby Short-Term Rental Market Comparison
How does the Saint John Airbnb market stack up against its neighbors? Compare key performance metrics like average monthly revenue, ADR, and occupancy rates in surrounding areas to understand the broader regional STR landscape.
| Market | Active Properties | Monthly Revenue | Daily Rate | Avg. Occupancy |
|---|---|---|---|---|
| Saint Barthélemy | 554 | $5,892 | $1034.64 | 37% |
| Fleming Estate | 15 | $5,884 | $572.58 | 46% |
| Bolans | 81 | $3,659 | $526.19 | 36% |
| Crosbies | 17 | $3,348 | $520.95 | 40% |
| Christian Hill | 13 | $2,641 | $479.55 | 35% |
| Cotton Ground | 34 | $2,575 | $384.15 | 32% |
| The Valley | 37 | $2,538 | $505.36 | 35% |
| English Harbour | 134 | $2,498 | $443.95 | 34% |
| Blue Waters | 35 | $2,467 | $220.39 | 46% |
| East End | 22 | $2,394 | $413.17 | 34% |