Paredones Airbnb Market Analysis 2026: Short Term Rental Data & Vacation Rental Statistics in O'Higgins Region, Chile
Is Airbnb profitable in Paredones in 2026? Explore comprehensive Airbnb analytics for Paredones, O'Higgins Region, Chile to uncover income potential. This 2026 STR market report for Paredones, based on AirROI data from February 2025 to January 2026, reveals key trends in the niche market of 43 active listings.
Whether you're considering an Airbnb investment in Paredones, optimizing your existing vacation rental, or exploring rental arbitrage opportunities, understanding the Paredones Airbnb data is crucial. Leveraging the low regulation environment is key to maximizing your short term rental income potential. Let's dive into the specifics.
Key Paredones Airbnb Performance Metrics Overview
Monthly Airbnb Revenue Variations & Income Potential in Paredones (2026)
Understanding the monthly revenue variations for Airbnb listings in Paredones is key to maximizing your short term rental income potential. Seasonality significantly impacts earnings. Our analysis, based on data from the past 12 months, shows that the peak revenue month for STRs in Paredones is typically February, while April often presents the lowest earnings, highlighting opportunities for strategic pricing adjustments during shoulder and low seasons. Explore the typical Airbnb income in Paredones across different performance tiers:
- Best-in-class properties (Top 10%) achieve $1,288+ monthly, often utilizing dynamic pricing and superior guest experiences.
- Strong performing properties (Top 25%) earn $868 or more, indicating effective management and desirable locations/amenities.
- Typical properties (Median) generate around $454 per month, representing the average market performance.
- Entry-level properties (Bottom 25%) see earnings around $238, often with potential for optimization.
Average Monthly Airbnb Earnings Trend in Paredones
Paredones Airbnb Occupancy Rate Trends (2026)
Maximize your bookings by understanding the Paredones STR occupancy trends. Seasonal demand shifts significantly influence how often properties are booked. Typically, Februarysees the highest demand (peak season occupancy), while August experiences the lowest (low season). Effective strategies, like adjusting minimum stays or offering promotions, can boost occupancy during slower periods. Here's how different property tiers perform in Paredones:
- Best-in-class properties (Top 10%) achieve 63%+ occupancy, indicating high desirability and potentially optimized availability.
- Strong performing properties (Top 25%) maintain 47% or higher occupancy, suggesting good market fit and guest satisfaction.
- Typical properties (Median) have an occupancy rate around 24%.
- Entry-level properties (Bottom 25%) average 11% occupancy, potentially facing higher vacancy.
Average Monthly Occupancy Rate Trend in Paredones
Average Daily Rate (ADR) Airbnb Trends in Paredones (2026)
Effective short term rental pricing strategy in Paredones involves understanding monthly ADR fluctuations. The Average Daily Rate (ADR) for Airbnb in Paredones typically peaks in January and dips lowest during March. Leveraging Airbnb dynamic pricing tools or strategies based on this seasonality can significantly boost revenue. Here's a look at the typical nightly rates achieved:
- Best-in-class properties (Top 10%) command rates of $117+ per night, often due to premium features or locations.
- Strong performing properties (Top 25%) achieve nightly rates of $73 or more.
- Typical properties (Median) charge around $60 per night.
- Entry-level properties (Bottom 25%) earn around $53 per night.
Average Daily Rate (ADR) Trend by Month in Paredones
Get Live Paredones Market Intelligence 👇

Explore Real-time Analytics
Airbnb Seasonality Analysis & Trends in Paredones (2026)
Peak Season (February, January, March)
- Revenue averages $911 per month
- Occupancy rates average 45.6%
- Daily rates average $71
Shoulder Season
- Revenue averages $609 per month
- Occupancy maintains around 26.8%
- Daily rates hold near $74
Low Season (April, May, October)
- Revenue drops to average $477 per month
- Occupancy decreases to average 23.3%
- Daily rates adjust to average $72
Seasonality Insights for Paredones
- The Airbnb seasonality in Paredones shows highly seasonal trends requiring careful strategy. While the sections above show seasonal averages, it's also insightful to look at the extremes:
- During the high season, the absolute peak month showcases Paredones's highest earning potential, with monthly revenues capable of climbing to $1,132, occupancy reaching a high of 60.2%, and ADRs peaking at $78.
- Conversely, the slowest single month of the year, typically falling within the low season, marks the market's lowest point. In this month, revenue might dip to $436, occupancy could drop to 22.4%, and ADRs may adjust down to $67.
- Understanding both the seasonal averages and these monthly peaks and troughs in revenue, occupancy, and ADR is crucial for maximizing your Airbnb profit potential in Paredones.
Seasonal Strategies for Maximizing Profit
- Peak Season: Maximize revenue through premium pricing and potentially longer minimum stays. Ensure high availability.
- Low Season: Offer competitive pricing, special promotions (e.g., extended stay discounts), and flexible cancellation policies. Target off-season travelers like remote workers or budget-conscious guests.
- Shoulder Seasons: Implement dynamic pricing that balances peak and low rates. Target weekend travelers or specific events. Offer slightly more flexible terms than peak season.
- Regularly analyze your own performance against these Paredones seasonality benchmarks and adjust your pricing and availability strategy accordingly.
Best Areas for Airbnb Investment in Paredones (2026)
Exploring the top neighborhoods for short-term rentals in Paredones? This section highlights key areas, outlining why they are attractive for hosts and guests, along with notable local attractions. Consider these locations based on your target guest profile and investment strategy.
| Neighborhood / Area | Why Host Here? (Target Guests & Appeal) | Key Attractions & Landmarks |
|---|---|---|
| Paredones Town Center | The heart of Paredones, offering a mix of local charm and essential services. It attracts both local travelers and tourists looking for a unique cultural experience in a small town setting. | Local artisan shops, Paredones Plaza, Cultural festivals, Traditional Chilean cuisine restaurants |
| Coastal Areas | Proximity to the beautiful Pacific coastline, appealing to beach lovers and those seeking a tranquil getaway. The natural scenery and beach activities draw many visitors. | Paredones Beach, Surfing spots, Coastal hiking trails, Beachfront restaurants |
| Los Lingues | Located near the scenic hills, this area is perfect for nature lovers and those who enjoy outdoor activities like hiking and horseback riding. It provides a peaceful retreat away from urban life. | Hiking trails, Horseback riding experiences, Local wildlife viewing, Stargazing opportunities |
| Nearby Wineries | The O'Higgins Region is known for its wine production, making it attractive for wine enthusiasts. Visitors often seek accommodations near wineries for tours and tastings. | Local vineyards, Wine tasting tours, Wine and food pairing events |
| Cañon del Río Clarillo | A stunning natural canyon area that is popular for eco-tourism. It attracts outdoor enthusiasts for hiking, rock climbing, and enjoying nature's beauty. | Scenic hiking routes, Biking paths, Wildlife observation, Picnic spots |
| Rancagua Day Trips | Close enough for day trips to the capital of the O'Higgins region, Rancagua, which offers urban experiences while guests can return to the tranquility of Paredones in the evening. | Historic sites in Rancagua, Parks, Cafes and restaurants, Cultural events |
| Cultural Heritage Sites | Paredones has rich history and is home to several sites of cultural significance, attracting tourists interested in Chile's heritage. | Historical landmarks, Museums, Local crafts markets |
| Outdoor Adventure Spots | Offering various outdoor activities such as hiking, biking, and birdwatching, attracting adventure seekers and nature lovers to the region. | National parks, Adventure tours, Camping sites |
Understanding Airbnb License Requirements & STR Laws in Paredones (2026)
While Paredones, O'Higgins Region, Chile currently shows low STR regulations, specific Airbnb license requirements might still exist or change. Always verify the latest short term rental regulations and Airbnb license requirements directly with local government authorities for Paredones to ensure full compliance before hosting.
(Source: AirROI data, 2026, finding no licensed listings among those analyzed)
Top Performing Airbnb Properties in Paredones (2026)
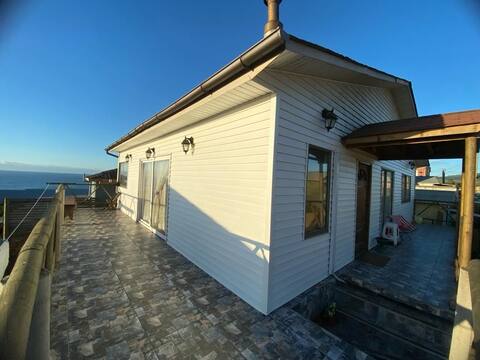
Benchmark your potential! Explore examples of top-performing Airbnb properties in Paredonesbased on Trailing Twelve Month (TTM) revenue. Analyze their characteristics, revenue, occupancy rate, and ADR to understand what drives success in this market.

Ocean View-House 6PAX Bucalemu/Pichilemu+Parking
Entire Place • 3 bedrooms
ocean view house
Entire Place • 3 bedrooms

The best rest in a beachfront loft
Entire Place • 2 bedrooms

Buca Lodge
Entire Place • 1 bedroom

Casa Bucalemu
Entire Place • 2 bedrooms
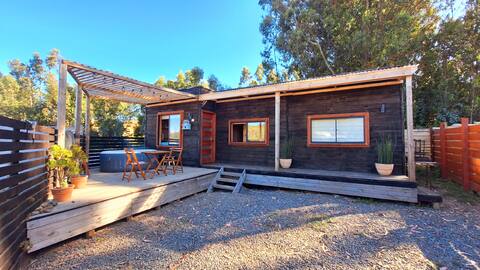
Enjoy between the countryside and the beach
Entire Place • 2 bedrooms
Note: Performance varies based on location, size, amenities, seasonality, and management quality. Data reflects the past 12 months.
Top Performing Airbnb Hosts in Paredones (2026)
Learn from the best! This table showcases top-performing Airbnb hosts in Paredones based on the number of properties managed and estimated total revenue over the past year. Analyze their scale and performance metrics.
| Host Name | Properties | Grossing Revenue | Stay Reviews | Avg Rating |
|---|---|---|---|---|
| Fernanda | 1 | $34,953 | 27 | 4.96/5.0 |
| Magdalena | 3 | $26,677 | 106 | 4.97/5.0 |
| Patricia | 2 | $24,376 | 64 | 4.99/5.0 |
| Fernando Matias | 2 | $21,826 | 109 | 4.84/5.0 |
| Diana | 2 | $19,247 | 307 | 4.95/5.0 |
| María Teresa | 2 | $9,573 | 22 | 4.96/5.0 |
| Marlene | 1 | $8,866 | 31 | 4.68/5.0 |
| Elizabeth | 2 | $7,544 | 12 | 4.82/5.0 |
| Cote | 1 | $7,089 | 16 | 4.88/5.0 |
| Ignacio N. | 2 | $5,733 | 42 | 4.95/5.0 |
Analyzing the strategies of top hosts, such as their property selection, pricing, and guest communication, can offer valuable lessons for optimizing your own Airbnb operations in Paredones.
Dive Deeper: Advanced Paredones STR Market Data (2026)
Ready to unlock more insights? AirROI provides access to advanced metrics and comprehensive Airbnb data for Paredones. Explore detailed analytics beyond this report to refine your investment strategy, optimize pricing, and maximize your vacation rental profits.
Explore Advanced MetricsParedones Short-Term Rental Market Composition (2026): Property & Room Types
Room Type Distribution
Property Type Distribution
Market Composition Insights for Paredones
- The Paredones Airbnb market composition is heavily skewed towards Entire Home/Apt listings, which make up 90.7% of the 43 active rentals. This indicates strong guest preference for privacy and space.
- Looking at the property type distribution in Paredones, Outdoor/Unique properties are the most common (44.2%), reflecting the local real estate landscape.
- Houses represent a significant 34.9% portion, catering likely to families or larger groups.
- The presence of 7% Hotel/Boutique listings indicates integration with traditional hospitality.
Paredones Airbnb Room Capacity Analysis (2026): Bedroom Distribution
Distribution of Listings by Number of Bedrooms
Room Capacity Insights for Paredones
- The dominant room capacity in Paredones is 2 bedrooms listings, making up 34.9% of the market. This suggests a strong demand for properties suitable for couples or solo travelers.
- Together, 2 bedrooms and 1 bedroom properties represent 69.8% of the active Airbnb listings in Paredones, indicating a high concentration in these sizes.
- A significant 30.2% of listings offer 3+ bedrooms, catering to larger groups and families seeking more space in Paredones.
Paredones Vacation Rental Guest Capacity Trends (2026)
Distribution of Listings by Guest Capacity
Guest Capacity Insights for Paredones
- The most common guest capacity trend in Paredones vacation rentals is listings accommodating 2 guests (27.9%). This suggests the primary traveler segment is likely couples or solo travelers.
- Properties designed for 2 guests and 4 guests dominate the Paredones STR market, accounting for 41.9% of listings.
- 37.2% of properties accommodate 6+ guests, serving the market segment for larger families or group travel in Paredones.
- On average, properties in Paredones are equipped to host 4.6 guests.
Paredones Airbnb Booking Patterns (2026): Available vs. Booked Days
Available Days Distribution
Booked Days Distribution
Booking Pattern Insights for Paredones
- The most common availability pattern in Paredones falls within the 271-366 days range, representing 72.1% of listings. This suggests many properties have significant open periods on their calendars.
- Approximately 90.7% of listings show high availability (181+ days open annually), indicating potential for increased bookings or specific owner usage patterns.
- For booked days, the 1-30 days range is most frequent in Paredones (46.5%), reflecting common guest stay durations or potential owner blocking patterns.
- A notable 11.6% of properties secure long booking periods (181+ days booked per year), highlighting successful long-term rental strategies or significant owner usage.
Paredones Airbnb Minimum Stay Requirements Analysis
Distribution of Listings by Minimum Night Requirement
1 Night
11 listings
25.6% of total
2 Nights
18 listings
41.9% of total
3 Nights
1 listings
2.3% of total
30+ Nights
13 listings
30.2% of total
Key Insights
- The most prevalent minimum stay requirement in Paredones is 2 Nights, adopted by 41.9% of listings. This highlights the market's preference for shorter, flexible bookings.
- A strong majority (67.5%) of the Paredones Airbnb data shows acceptance of very short stays (1-2 nights), indicating a dynamic, high-turnover market.
- A significant segment (30.2%) caters to monthly stays (30+ nights) in Paredones, pointing to opportunities in the extended-stay market.
Recommendations
- Align with the market by considering a 2 Nights minimum stay, as 41.9% of Paredones hosts use this setting.
- If feasible, allowing 1-night stays, especially midweek or during low season, could capture last-minute bookings, as only 25.6% currently do.
- Explore offering discounts for stays of 30+ nights to attract the 30.2% of the market seeking extended stays.
- Adjust minimum nights based on seasonality – potentially shorter during low season and longer during peak demand periods in Paredones.
Paredones Airbnb Cancellation Policy Trends Analysis (2026)
Limited
1 listings
2.3% of total
Flexible
18 listings
41.9% of total
Moderate
19 listings
44.2% of total
Firm
5 listings
11.6% of total
Cancellation Policy Insights for Paredones
- The prevailing Airbnb cancellation policy trend in Paredones is Moderate, used by 44.2% of listings.
- The market strongly favors guest-friendly terms, with 86.1% of listings offering Flexible or Moderate policies. This suggests guests in Paredones may expect booking flexibility.
Recommendations for Hosts
- Consider adopting a Moderate policy to align with the 44.2% market standard in Paredones.
- Regularly review your cancellation policy against competitors and market demand shifts in Paredones.
Paredones STR Booking Lead Time Analysis (2026)
Average Booking Lead Time by Month
Booking Lead Time Insights for Paredones
- The overall average booking lead time for vacation rentals in Paredones is 15 days.
- Guests book furthest in advance for stays during September (average 24 days), likely coinciding with peak travel demand or local events.
- The shortest booking windows occur for stays in November (average 8 days), indicating more last-minute travel plans during this time.
- Seasonally, Winter (21 days avg.) sees the longest lead times, while Summer (12 days avg.) has the shortest, reflecting typical travel planning cycles.
Recommendations for Hosts
- Use the overall average lead time (15 days) as a baseline for your pricing and availability strategy in Paredones.
- Target marketing efforts for the Winter season well in advance (at least 21 days) to capture early planners.
- Monitor your own booking lead times against these Paredones averages to identify opportunities for dynamic pricing adjustments.
Popular & Essential Airbnb Amenities in Paredones (2026)
Amenity Prevalence
Amenity Insights for Paredones
- Popular amenities like Free parking on premises, Hot water, Kitchen are common but not universal. Offering these can provide a competitive edge.
Recommendations for Hosts
- Consider adding popular differentiators like Free parking on premises or Hot water to increase appeal.
- Highlight unique or less common amenities you offer (e.g., hot tub, dedicated workspace, EV charger) in your listing description and photos.
- Regularly check competitor amenities in Paredones to stay competitive.
Paredones Airbnb Guest Demographics & Profile Analysis (2026)
Guest Profile Summary for Paredones
- The typical guest profile for Airbnb in Paredones consists of primarily domestic travelers (93%), often arriving from nearby Santiago, typically belonging to the Post-2000s (Gen Z/Alpha) group (50%), primarily speaking Spanish or English.
- Domestic travelers account for 92.5% of guests.
- Key international markets include Chile (92.5%) and Argentina (2.1%).
- Top languages spoken are Spanish (61%) followed by English (34.7%).
- A significant demographic segment is the Post-2000s (Gen Z/Alpha) group, representing 50% of guests.
Recommendations for Hosts
- Target domestic marketing efforts towards travelers from Santiago and Santiago Metropolitan Region.
- Tailor amenities and listing descriptions to appeal to the dominant Post-2000s (Gen Z/Alpha) demographic (e.g., highlight fast WiFi, smart home features, local guides).
- Highlight unique local experiences or amenities relevant to the primary guest profile.
- Consider seasonal promotions aligned with peak travel times for key origin markets.
Nearby Short-Term Rental Market Comparison
How does the Paredones Airbnb market stack up against its neighbors? Compare key performance metrics like average monthly revenue, ADR, and occupancy rates in surrounding areas to understand the broader regional STR landscape.
| Market | Active Properties | Monthly Revenue | Daily Rate | Avg. Occupancy |
|---|---|---|---|---|
| Lo Barnechea | 483 | $2,018 | $372.13 | 42% |
| Litueche | 68 | $1,254 | $224.62 | 26% |
| Peñaflor | 12 | $1,232 | $164.71 | 30% |
| Las Cabras | 179 | $1,137 | $219.49 | 27% |
| Casablanca | 241 | $1,095 | $165.43 | 30% |
| La Estrella | 21 | $1,078 | $288.44 | 24% |
| Vitacura | 257 | $1,062 | $128.87 | 42% |
| Las Condes | 1,652 | $1,007 | $87.62 | 48% |
| Santo Domingo | 228 | $947 | $186.52 | 27% |
| Navidad | 679 | $895 | $140.10 | 27% |