Saint-Jean-d'Arves Airbnb Market Analysis 2026: Short Term Rental Data & Vacation Rental Statistics in Auvergne-Rhône-Alpes, France
Is Airbnb profitable in Saint-Jean-d'Arves in 2026? Explore comprehensive Airbnb analytics for Saint-Jean-d'Arves, Auvergne-Rhône-Alpes, France to uncover income potential. This 2026 STR market report for Saint-Jean-d'Arves, based on AirROI data from February 2025 to January 2026, reveals key trends in the niche market of 91 active listings.
Whether you're considering an Airbnb investment in Saint-Jean-d'Arves, optimizing your existing vacation rental, or exploring rental arbitrage opportunities, understanding the Saint-Jean-d'Arves Airbnb data is crucial. Understanding the local regulations is key to maximizing your short term rental income potential. Let's dive into the specifics.
Key Saint-Jean-d'Arves Airbnb Performance Metrics Overview
Monthly Airbnb Revenue Variations & Income Potential in Saint-Jean-d'Arves (2026)
Understanding the monthly revenue variations for Airbnb listings in Saint-Jean-d'Arves is key to maximizing your short term rental income potential. Seasonality significantly impacts earnings. Our analysis, based on data from the past 12 months, shows that the peak revenue month for STRs in Saint-Jean-d'Arves is typically February, while June often presents the lowest earnings, highlighting opportunities for strategic pricing adjustments during shoulder and low seasons. Explore the typical Airbnb income in Saint-Jean-d'Arves across different performance tiers:
- Best-in-class properties (Top 10%) achieve $4,012+ monthly, often utilizing dynamic pricing and superior guest experiences.
- Strong performing properties (Top 25%) earn $2,119 or more, indicating effective management and desirable locations/amenities.
- Typical properties (Median) generate around $1,189 per month, representing the average market performance.
- Entry-level properties (Bottom 25%) see earnings around $696, often with potential for optimization.
Average Monthly Airbnb Earnings Trend in Saint-Jean-d'Arves
Saint-Jean-d'Arves Airbnb Occupancy Rate Trends (2026)
Maximize your bookings by understanding the Saint-Jean-d'Arves STR occupancy trends. Seasonal demand shifts significantly influence how often properties are booked. Typically, Februarysees the highest demand (peak season occupancy), while June experiences the lowest (low season). Effective strategies, like adjusting minimum stays or offering promotions, can boost occupancy during slower periods. Here's how different property tiers perform in Saint-Jean-d'Arves:
- Best-in-class properties (Top 10%) achieve 71%+ occupancy, indicating high desirability and potentially optimized availability.
- Strong performing properties (Top 25%) maintain 52% or higher occupancy, suggesting good market fit and guest satisfaction.
- Typical properties (Median) have an occupancy rate around 32%.
- Entry-level properties (Bottom 25%) average 20% occupancy, potentially facing higher vacancy.
Average Monthly Occupancy Rate Trend in Saint-Jean-d'Arves
Average Daily Rate (ADR) Airbnb Trends in Saint-Jean-d'Arves (2026)
Effective short term rental pricing strategy in Saint-Jean-d'Arves involves understanding monthly ADR fluctuations. The Average Daily Rate (ADR) for Airbnb in Saint-Jean-d'Arves typically peaks in January and dips lowest during June. Leveraging Airbnb dynamic pricing tools or strategies based on this seasonality can significantly boost revenue. Here's a look at the typical nightly rates achieved:
- Best-in-class properties (Top 10%) command rates of $365+ per night, often due to premium features or locations.
- Strong performing properties (Top 25%) achieve nightly rates of $191 or more.
- Typical properties (Median) charge around $118 per night.
- Entry-level properties (Bottom 25%) earn around $81 per night.
Average Daily Rate (ADR) Trend by Month in Saint-Jean-d'Arves
Get Live Saint-Jean-d'Arves Market Intelligence 👇

Explore Real-time Analytics
Airbnb Seasonality Analysis & Trends in Saint-Jean-d'Arves (2026)
Peak Season (February, March, August)
- Revenue averages $3,114 per month
- Occupancy rates average 57.8%
- Daily rates average $190
Shoulder Season
- Revenue averages $1,617 per month
- Occupancy maintains around 33.4%
- Daily rates hold near $187
Low Season (June, September, October)
- Revenue drops to average $983 per month
- Occupancy decreases to average 24.8%
- Daily rates adjust to average $181
Seasonality Insights for Saint-Jean-d'Arves
- The Airbnb seasonality in Saint-Jean-d'Arves shows highly seasonal trends requiring careful strategy. While the sections above show seasonal averages, it's also insightful to look at the extremes:
- During the high season, the absolute peak month showcases Saint-Jean-d'Arves's highest earning potential, with monthly revenues capable of climbing to $4,242, occupancy reaching a high of 70.6%, and ADRs peaking at $211.
- Conversely, the slowest single month of the year, typically falling within the low season, marks the market's lowest point. In this month, revenue might dip to $920, occupancy could drop to 23.5%, and ADRs may adjust down to $170.
- Understanding both the seasonal averages and these monthly peaks and troughs in revenue, occupancy, and ADR is crucial for maximizing your Airbnb profit potential in Saint-Jean-d'Arves.
Seasonal Strategies for Maximizing Profit
- Peak Season: Maximize revenue through premium pricing and potentially longer minimum stays. Ensure high availability.
- Low Season: Offer competitive pricing, special promotions (e.g., extended stay discounts), and flexible cancellation policies. Target off-season travelers like remote workers or budget-conscious guests.
- Shoulder Seasons: Implement dynamic pricing that balances peak and low rates. Target weekend travelers or specific events. Offer slightly more flexible terms than peak season.
- Regularly analyze your own performance against these Saint-Jean-d'Arves seasonality benchmarks and adjust your pricing and availability strategy accordingly.
Best Areas for Airbnb Investment in Saint-Jean-d'Arves (2026)
Exploring the top neighborhoods for short-term rentals in Saint-Jean-d'Arves? This section highlights key areas, outlining why they are attractive for hosts and guests, along with notable local attractions. Consider these locations based on your target guest profile and investment strategy.
| Neighborhood / Area | Why Host Here? (Target Guests & Appeal) | Key Attractions & Landmarks |
|---|---|---|
| Les Sybelles | A large ski area with over 300 km of slopes, perfect for skiing and snowboarding enthusiasts, attracting tourists throughout the winter season. | Les Sybelles ski area, Ski school services, Mountain hiking trails, Scenic views from the peaks |
| Alp d'Huez | Famous for its ski resort and summer cycling races, it attracts both winter sports and summer adventure tourists. | Alpe d'Huez ski resort, Dutch Corner cycling route, Pic Blanc, Accessibility to multiple ski resorts |
| Le Corbier | A family-friendly ski resort that provides a great range of beginner slopes and activities, suitable for families with children. | Beginner ski slopes, Family activities, Mountain restaurants, Scenic mountain views |
| Saint-Sorlin-d'Arves | Charming village known for its authentic alpine atmosphere and convenient access to ski and hiking trails. | Ski slopes, Hiking trails, Local shops and restaurants, Traditional alpine architecture |
| La Toussuire | Known for its extensive ski area and lively après-ski scene, popular with both young adults and families. | Ski slopes, Après-ski bars, Mountain bike trails, Scenic views |
| Valmeinier | An attractive ski resort that offers a range of slopes suitable for all levels and has a vibrant village atmosphere. | Ski slopes, Shopping areas, Local cuisine, Family activities |
| Saint-Jean-d'Arves village | A picturesque village offering authentic experiences with close proximity to ski and hiking activities. | Traditional village charm, Access to ski lifts, Mountain biking routes, Scenic views |
| Vaujany | A lesser-known gem that offers amazing views and ski access, perfect for those looking for a quieter experience outside of the more crowded resorts. | Ski slopes, Scenic lake, Hiking trails, Village atmosphere |
Understanding Airbnb License Requirements & STR Laws in Saint-Jean-d'Arves (2026)
With 25% of listings showing registration in 2026, understanding potential Airbnb license requirements is crucial in Saint-Jean-d'Arves. Always verify the latest short term rental regulations and Airbnb license requirements directly with local government authorities for Saint-Jean-d'Arves to ensure full compliance before hosting.
(Source: AirROI data, 2026, based on 25% licensed listings)
Top Performing Airbnb Properties in Saint-Jean-d'Arves (2026)
Benchmark your potential! Explore examples of top-performing Airbnb properties in Saint-Jean-d'Arvesbased on Trailing Twelve Month (TTM) revenue. Analyze their characteristics, revenue, occupancy rate, and ADR to understand what drives success in this market.
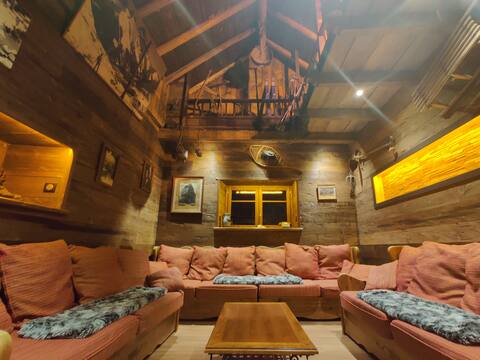
Large chalet 350m from the Sybelles slopes
Entire Place • 7 bedrooms

Family cottage overlooking the mountains
Entire Place • 8 bedrooms
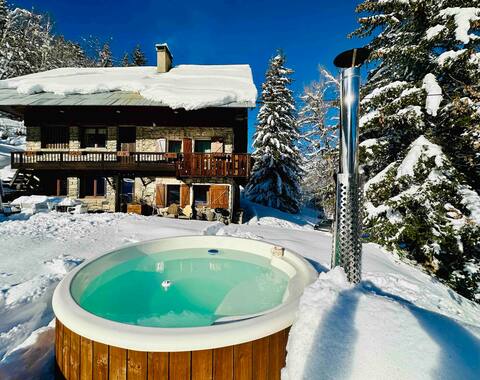
Chalet with panoramic view in absolute quiet, skiing 5 min away
Entire Place • 6 bedrooms
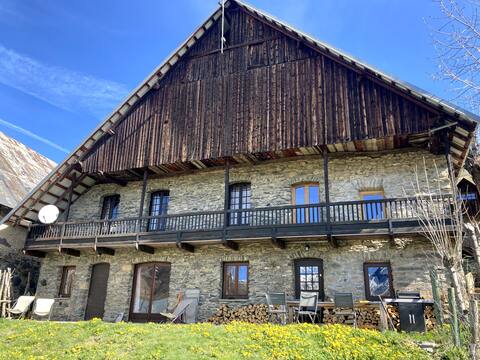
Charming chalet 350 m from the slopes. Very nice view.
Entire Place • 5 bedrooms

Apartment 12 people chalet 2OOm ski slopes
Entire Place • 4 bedrooms

Chalet Les Sybelles (> 300 m2 - sauna)
Entire Place • 5 bedrooms
Note: Performance varies based on location, size, amenities, seasonality, and management quality. Data reflects the past 12 months.
Top Performing Airbnb Hosts in Saint-Jean-d'Arves (2026)
Learn from the best! This table showcases top-performing Airbnb hosts in Saint-Jean-d'Arves based on the number of properties managed and estimated total revenue over the past year. Analyze their scale and performance metrics.
| Host Name | Properties | Grossing Revenue | Stay Reviews | Avg Rating |
|---|---|---|---|---|
| Mathieu | 6 | $123,335 | 167 | 4.92/5.0 |
| Alain | 1 | $75,302 | 33 | 4.97/5.0 |
| Marie-Aimée | 1 | $67,882 | 49 | 4.88/5.0 |
| Clemmie | 1 | $54,114 | 27 | 4.85/5.0 |
| Gwenola | 1 | $53,938 | 36 | 4.75/5.0 |
| Bengrine | 2 | $43,342 | 18 | 4.58/5.0 |
| Sarah | 1 | $41,769 | 44 | 4.91/5.0 |
| Ingrid | 1 | $38,742 | 128 | 4.88/5.0 |
| Kelly Laura | 1 | $32,840 | 5 | 5.00/5.0 |
| Sonia | 1 | $32,305 | 11 | 5.00/5.0 |
Analyzing the strategies of top hosts, such as their property selection, pricing, and guest communication, can offer valuable lessons for optimizing your own Airbnb operations in Saint-Jean-d'Arves.
Dive Deeper: Advanced Saint-Jean-d'Arves STR Market Data (2026)
Ready to unlock more insights? AirROI provides access to advanced metrics and comprehensive Airbnb data for Saint-Jean-d'Arves. Explore detailed analytics beyond this report to refine your investment strategy, optimize pricing, and maximize your vacation rental profits.
Explore Advanced MetricsSaint-Jean-d'Arves Short-Term Rental Market Composition (2026): Property & Room Types
Room Type Distribution
Property Type Distribution
Market Composition Insights for Saint-Jean-d'Arves
- The Saint-Jean-d'Arves Airbnb market composition is heavily skewed towards Entire Home/Apt listings, which make up 98.9% of the 91 active rentals. This indicates strong guest preference for privacy and space.
- Looking at the property type distribution in Saint-Jean-d'Arves, Apartment/Condo properties are the most common (70.3%), reflecting the local real estate landscape.
- Houses represent a significant 28.6% portion, catering likely to families or larger groups.
- Smaller segments like hotel/boutique (combined 1.1%) offer potential for unique stay experiences.
Saint-Jean-d'Arves Airbnb Room Capacity Analysis (2026): Bedroom Distribution
Distribution of Listings by Number of Bedrooms
Room Capacity Insights for Saint-Jean-d'Arves
- The dominant room capacity in Saint-Jean-d'Arves is 2 bedrooms listings, making up 34.1% of the market. This suggests a strong demand for properties suitable for couples or solo travelers.
- Together, 2 bedrooms and 1 bedroom properties represent 56.1% of the active Airbnb listings in Saint-Jean-d'Arves, indicating a high concentration in these sizes.
- A significant 37.4% of listings offer 3+ bedrooms, catering to larger groups and families seeking more space in Saint-Jean-d'Arves.
Saint-Jean-d'Arves Vacation Rental Guest Capacity Trends (2026)
Distribution of Listings by Guest Capacity
Guest Capacity Insights for Saint-Jean-d'Arves
- The most common guest capacity trend in Saint-Jean-d'Arves vacation rentals is listings accommodating 8+ guests (33%). This suggests the primary traveler segment is likely larger groups.
- Properties designed for 8+ guests and 4 guests dominate the Saint-Jean-d'Arves STR market, accounting for 57.2% of listings.
- 62.7% of properties accommodate 6+ guests, serving the market segment for larger families or group travel in Saint-Jean-d'Arves.
- On average, properties in Saint-Jean-d'Arves are equipped to host 5.9 guests.
Saint-Jean-d'Arves Airbnb Booking Patterns (2026): Available vs. Booked Days
Available Days Distribution
Booked Days Distribution
Booking Pattern Insights for Saint-Jean-d'Arves
- The most common availability pattern in Saint-Jean-d'Arves falls within the 271-366 days range, representing 61.5% of listings. This suggests many properties have significant open periods on their calendars.
- Approximately 92.3% of listings show high availability (181+ days open annually), indicating potential for increased bookings or specific owner usage patterns.
- For booked days, the 31-90 days range is most frequent in Saint-Jean-d'Arves (45.1%), reflecting common guest stay durations or potential owner blocking patterns.
- A notable 8.8% of properties secure long booking periods (181+ days booked per year), highlighting successful long-term rental strategies or significant owner usage.
Saint-Jean-d'Arves Airbnb Minimum Stay Requirements Analysis
Distribution of Listings by Minimum Night Requirement
1 Night
6 listings
6.6% of total
2 Nights
7 listings
7.7% of total
3 Nights
5 listings
5.5% of total
4-6 Nights
20 listings
22% of total
7-29 Nights
9 listings
9.9% of total
30+ Nights
44 listings
48.4% of total
Key Insights
- The most prevalent minimum stay requirement in Saint-Jean-d'Arves is 30+ Nights, adopted by 48.4% of listings. This highlights the market's preference for longer commitments.
- Very short stays (1-2 nights) are less common (14.3%), suggesting hosts prefer slightly longer bookings to optimize turnover.
- A significant segment (48.4%) caters to monthly stays (30+ nights) in Saint-Jean-d'Arves, pointing to opportunities in the extended-stay market.
Recommendations
- Align with the market by considering a 30+ Nights minimum stay, as 48.4% of Saint-Jean-d'Arves hosts use this setting.
- If feasible, allowing 1-night stays, especially midweek or during low season, could capture last-minute bookings, as only 6.6% currently do.
- Explore offering discounts for stays of 30+ nights to attract the 48.4% of the market seeking extended stays.
- Adjust minimum nights based on seasonality – potentially shorter during low season and longer during peak demand periods in Saint-Jean-d'Arves.
Saint-Jean-d'Arves Airbnb Cancellation Policy Trends Analysis (2026)
Super Strict 30 Days
3 listings
3.3% of total
Flexible
17 listings
18.7% of total
Moderate
14 listings
15.4% of total
Firm
49 listings
53.8% of total
Strict
8 listings
8.8% of total
Cancellation Policy Insights for Saint-Jean-d'Arves
- The prevailing Airbnb cancellation policy trend in Saint-Jean-d'Arves is Firm, used by 53.8% of listings.
- A majority (62.6%) of hosts in Saint-Jean-d'Arves utilize Firm or Strict policies, indicating a market where hosts prioritize booking security.
- Strict cancellation policies are quite rare (8.8%), potentially making listings with this policy less competitive unless justified by high demand or property type.
Recommendations for Hosts
- Consider adopting a Firm policy to align with the 53.8% market standard in Saint-Jean-d'Arves.
- Using a Strict policy might deter some guests, as only 8.8% of listings use it. Evaluate if potential revenue protection outweighs possible lower booking rates.
- Regularly review your cancellation policy against competitors and market demand shifts in Saint-Jean-d'Arves.
Saint-Jean-d'Arves STR Booking Lead Time Analysis (2026)
Average Booking Lead Time by Month
Booking Lead Time Insights for Saint-Jean-d'Arves
- The overall average booking lead time for vacation rentals in Saint-Jean-d'Arves is 77 days.
- Guests book furthest in advance for stays during December (average 119 days), likely coinciding with peak travel demand or local events.
- The shortest booking windows occur for stays in May (average 33 days), indicating more last-minute travel plans during this time.
- Seasonally, Winter (101 days avg.) sees the longest lead times, while Fall (39 days avg.) has the shortest, reflecting typical travel planning cycles.
Recommendations for Hosts
- Use the overall average lead time (77 days) as a baseline for your pricing and availability strategy in Saint-Jean-d'Arves.
- For December stays, consider implementing length-of-stay discounts or slightly higher rates for bookings made less than 119 days out to capitalize on advance planning.
- Target marketing efforts for the Winter season well in advance (at least 101 days) to capture early planners.
- Monitor your own booking lead times against these Saint-Jean-d'Arves averages to identify opportunities for dynamic pricing adjustments.
Popular & Essential Airbnb Amenities in Saint-Jean-d'Arves (2026)
Amenity Prevalence
Amenity Insights for Saint-Jean-d'Arves
- Essential amenities in Saint-Jean-d'Arves that guests expect include: Kitchen, Heating. Lacking these (any) could significantly impact bookings.
- Popular amenities like TV, Free parking on premises, Smoke alarm are common but not universal. Offering these can provide a competitive edge.
Recommendations for Hosts
- Ensure your listing includes all essential amenities for Saint-Jean-d'Arves: Kitchen, Heating.
- Prioritize adding missing essentials: Kitchen, Heating.
- Consider adding popular differentiators like TV or Free parking on premises to increase appeal.
- Highlight unique or less common amenities you offer (e.g., hot tub, dedicated workspace, EV charger) in your listing description and photos.
- Regularly check competitor amenities in Saint-Jean-d'Arves to stay competitive.
Saint-Jean-d'Arves Airbnb Guest Demographics & Profile Analysis (2026)
Guest Profile Summary for Saint-Jean-d'Arves
- The typical guest profile for Airbnb in Saint-Jean-d'Arves consists of primarily domestic travelers (84%), often arriving from nearby Lyon, typically belonging to the Post-2000s (Gen Z/Alpha) group (50%), primarily speaking French or English.
- Domestic travelers account for 83.8% of guests.
- Key international markets include France (83.8%) and Belgium (5.4%).
- Top languages spoken are French (41.5%) followed by English (33.4%).
- A significant demographic segment is the Post-2000s (Gen Z/Alpha) group, representing 50% of guests.
Recommendations for Hosts
- Target domestic marketing efforts towards travelers from Lyon and Grenoble.
- Tailor amenities and listing descriptions to appeal to the dominant Post-2000s (Gen Z/Alpha) demographic (e.g., highlight fast WiFi, smart home features, local guides).
- Highlight unique local experiences or amenities relevant to the primary guest profile.
- Consider seasonal promotions aligned with peak travel times for key origin markets.
Nearby Short-Term Rental Market Comparison
How does the Saint-Jean-d'Arves Airbnb market stack up against its neighbors? Compare key performance metrics like average monthly revenue, ADR, and occupancy rates in surrounding areas to understand the broader regional STR landscape.
| Market | Active Properties | Monthly Revenue | Daily Rate | Avg. Occupancy |
|---|---|---|---|---|
| Niederried bei Interlaken | 19 | $6,267 | $552.03 | 44% |
| Lauterbrunnen | 552 | $6,108 | $487.83 | 51% |
| Matten bei Interlaken | 64 | $5,607 | $336.51 | 59% |
| Les Clefs | 34 | $5,585 | $314.08 | 47% |
| Monteu Roero | 12 | $5,184 | $403.07 | 41% |
| Wengen | 12 | $5,115 | $595.38 | 46% |
| Oberhofen am Thunersee | 25 | $5,051 | $329.28 | 51% |
| Zermatt | 792 | $5,017 | $504.14 | 46% |
| Interlaken | 346 | $4,947 | $399.71 | 53% |
| Bönigen | 35 | $4,848 | $288.51 | 65% |