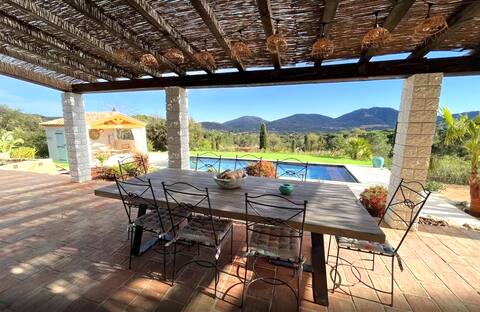
Le Plan-de-la-Tour Airbnb Market Analysis 2026: Short Term Rental Data & Vacation Rental Statistics in Provence-Alpes-Côte d'Azur, France
Is Airbnb profitable in Le Plan-de-la-Tour in 2026? Explore comprehensive Airbnb analytics for Le Plan-de-la-Tour, Provence-Alpes-Côte d'Azur, France to uncover income potential. This 2026 STR market report for Le Plan-de-la-Tour, based on AirROI data from February 2025 to January 2026, reveals key trends in the niche market of 180 active listings.
Whether you're considering an Airbnb investment in Le Plan-de-la-Tour, optimizing your existing vacation rental, or exploring rental arbitrage opportunities, understanding the Le Plan-de-la-Tour Airbnb data is crucial. Navigating the high regulation landscape is key to maximizing your short term rental income potential. Let's dive into the specifics.
Key Le Plan-de-la-Tour Airbnb Performance Metrics Overview
Monthly Airbnb Revenue Variations & Income Potential in Le Plan-de-la-Tour (2026)
Understanding the monthly revenue variations for Airbnb listings in Le Plan-de-la-Tour is key to maximizing your short term rental income potential. Seasonality significantly impacts earnings. Our analysis, based on data from the past 12 months, shows that the peak revenue month for STRs in Le Plan-de-la-Tour is typically August, while January often presents the lowest earnings, highlighting opportunities for strategic pricing adjustments during shoulder and low seasons. Explore the typical Airbnb income in Le Plan-de-la-Tour across different performance tiers:
- Best-in-class properties (Top 10%) achieve $8,268+ monthly, often utilizing dynamic pricing and superior guest experiences.
- Strong performing properties (Top 25%) earn $4,411 or more, indicating effective management and desirable locations/amenities.
- Typical properties (Median) generate around $2,012 per month, representing the average market performance.
- Entry-level properties (Bottom 25%) see earnings around $953, often with potential for optimization.
Average Monthly Airbnb Earnings Trend in Le Plan-de-la-Tour
Le Plan-de-la-Tour Airbnb Occupancy Rate Trends (2026)
Maximize your bookings by understanding the Le Plan-de-la-Tour STR occupancy trends. Seasonal demand shifts significantly influence how often properties are booked. Typically, Augustsees the highest demand (peak season occupancy), while January experiences the lowest (low season). Effective strategies, like adjusting minimum stays or offering promotions, can boost occupancy during slower periods. Here's how different property tiers perform in Le Plan-de-la-Tour:
- Best-in-class properties (Top 10%) achieve 73%+ occupancy, indicating high desirability and potentially optimized availability.
- Strong performing properties (Top 25%) maintain 50% or higher occupancy, suggesting good market fit and guest satisfaction.
- Typical properties (Median) have an occupancy rate around 30%.
- Entry-level properties (Bottom 25%) average 15% occupancy, potentially facing higher vacancy.
Average Monthly Occupancy Rate Trend in Le Plan-de-la-Tour
Average Daily Rate (ADR) Airbnb Trends in Le Plan-de-la-Tour (2026)
Effective short term rental pricing strategy in Le Plan-de-la-Tour involves understanding monthly ADR fluctuations. The Average Daily Rate (ADR) for Airbnb in Le Plan-de-la-Tour typically peaks in August and dips lowest during March. Leveraging Airbnb dynamic pricing tools or strategies based on this seasonality can significantly boost revenue. Here's a look at the typical nightly rates achieved:
- Best-in-class properties (Top 10%) command rates of $666+ per night, often due to premium features or locations.
- Strong performing properties (Top 25%) achieve nightly rates of $404 or more.
- Typical properties (Median) charge around $218 per night.
- Entry-level properties (Bottom 25%) earn around $123 per night.
Average Daily Rate (ADR) Trend by Month in Le Plan-de-la-Tour
Get Live Le Plan-de-la-Tour Market Intelligence 👇

Explore Real-time Analytics
Airbnb Seasonality Analysis & Trends in Le Plan-de-la-Tour (2026)
Peak Season (August, July, September)
- Revenue averages $6,445 per month
- Occupancy rates average 52.5%
- Daily rates average $352
Shoulder Season
- Revenue averages $3,338 per month
- Occupancy maintains around 32.4%
- Daily rates hold near $316
Low Season (January, March, December)
- Revenue drops to average $1,793 per month
- Occupancy decreases to average 22.6%
- Daily rates adjust to average $321
Seasonality Insights for Le Plan-de-la-Tour
- The Airbnb seasonality in Le Plan-de-la-Tour shows highly seasonal trends requiring careful strategy. While the sections above show seasonal averages, it's also insightful to look at the extremes:
- During the high season, the absolute peak month showcases Le Plan-de-la-Tour's highest earning potential, with monthly revenues capable of climbing to $8,052, occupancy reaching a high of 59.9%, and ADRs peaking at $361.
- Conversely, the slowest single month of the year, typically falling within the low season, marks the market's lowest point. In this month, revenue might dip to $1,196, occupancy could drop to 12.5%, and ADRs may adjust down to $293.
- Understanding both the seasonal averages and these monthly peaks and troughs in revenue, occupancy, and ADR is crucial for maximizing your Airbnb profit potential in Le Plan-de-la-Tour.
Seasonal Strategies for Maximizing Profit
- Peak Season: Maximize revenue through premium pricing and potentially longer minimum stays. Ensure high availability.
- Low Season: Offer competitive pricing, special promotions (e.g., extended stay discounts), and flexible cancellation policies. Target off-season travelers like remote workers or budget-conscious guests.
- Shoulder Seasons: Implement dynamic pricing that balances peak and low rates. Target weekend travelers or specific events. Offer slightly more flexible terms than peak season.
- Regularly analyze your own performance against these Le Plan-de-la-Tour seasonality benchmarks and adjust your pricing and availability strategy accordingly.
Best Areas for Airbnb Investment in Le Plan-de-la-Tour (2026)
Exploring the top neighborhoods for short-term rentals in Le Plan-de-la-Tour? This section highlights key areas, outlining why they are attractive for hosts and guests, along with notable local attractions. Consider these locations based on your target guest profile and investment strategy.
| Neighborhood / Area | Why Host Here? (Target Guests & Appeal) | Key Attractions & Landmarks |
|---|---|---|
| Le Plan-de-la-Tour Village | A charming Provençal village known for its rustic beauty and traditional architecture. Attracts visitors looking for an authentic French experience, with proximity to the Mediterranean coast. | Local markets, Historical buildings, Provencal cuisine restaurants, Nearby vineyards, Scenic hiking trails |
| Domaine de La Messardière | A beautiful hillside area just outside of Le Plan-de-la-Tour, known for its luxurious accommodations and stunning views. Attracts tourists seeking relaxation and tranquility in nature. | Private villas, Vineyard tours, Panoramic views, Nature reserves, Golf courses |
| Bormes-les-Mimosas | A picturesque coastal commune with sandy beaches and lush vegetation. Ideal for beachgoers and families looking for summer vacations. | Plage de Bormes, Fort de Bregançon, Mimosas festival, Historical old town, Water sports activities |
| Saint-Tropez | Famed for its glitz and glamour, Saint-Tropez is a hotspot for celebrities and tourists alike, offering vibrant nightlife and luxurious experiences. | Plage de Pampelonne, Saint-Tropez Citadel, Tropical beach clubs, Luxury shopping, Art galleries |
| Cavalaire-sur-Mer | Known for its beautiful beaches and laid-back atmosphere, ideal for families and vacationers looking for sun and sea. | Cavalaire beach, Boat rentals, Markets and local shops, Hiking paths, Water sports |
| Port Grimaud | A unique seaside town designed like a Venetian village with canals and colorful houses. Popular with tourists for its beautiful waterfront. | Canal tours, Beach access, Local dining, Marina activities, Historic architecture |
| Gassin | A hilltop village that offers splendid views of the Bay of Saint-Tropez and a tranquil atmosphere. Attracts visitors looking for stunning views and local charm. | Scenic viewpoints, Wine tasting, Artisan shops, Historic villages nearby, Walking trails |
| Rayol-Canadel-sur-Mer | A serene coastal area with beautiful gardens and nature parks, perfect for those seeking peace and natural beauty. | Le Jardin des Méditerranées, Beaches, Coastal hiking trails, Water sports, Botanical gardens |
Understanding Airbnb License Requirements & STR Laws in Le Plan-de-la-Tour (2026)
Yes, Le Plan-de-la-Tour, Provence-Alpes-Côte d'Azur, France enforces high STR regulations. Obtaining a license and ensuring compliance is almost certainly required according to current 2026 STR laws. Always verify the latest short term rental regulations and Airbnb license requirements directly with local government authorities for Le Plan-de-la-Tour to ensure full compliance before hosting.
(Source: AirROI data, 2026, based on 81% licensed listings)
Top Performing Airbnb Properties in Le Plan-de-la-Tour (2026)
Benchmark your potential! Explore examples of top-performing Airbnb properties in Le Plan-de-la-Tourbased on Trailing Twelve Month (TTM) revenue. Analyze their characteristics, revenue, occupancy rate, and ADR to understand what drives success in this market.
Domaine du Verneton
Entire Place • 4 bedrooms
Luxurious Villa near St Tropez with Heated Pool
Entire Place • 5 bedrooms
Beautiful Provençal Villa
Entire Place • 6 bedrooms

Villa, big secluded property, heated pool, AC
Entire Place • 5 bedrooms
Modern Villa with Pool
Entire Place • 6 bedrooms
Air-conditioned Provençal villa, heated pool
Entire Place • 3 bedrooms
Note: Performance varies based on location, size, amenities, seasonality, and management quality. Data reflects the past 12 months.
Top Performing Airbnb Hosts in Le Plan-de-la-Tour (2026)
Learn from the best! This table showcases top-performing Airbnb hosts in Le Plan-de-la-Tour based on the number of properties managed and estimated total revenue over the past year. Analyze their scale and performance metrics.
| Host Name | Properties | Grossing Revenue | Stay Reviews | Avg Rating |
|---|---|---|---|---|
| Frantz | 1 | $437,243 | 10 | 5.00/5.0 |
| Audrey Maryse | 10 | $374,456 | 240 | 4.84/5.0 |
| Celine | 5 | $351,335 | 65 | 4.85/5.0 |
| Agathe | 3 | $151,745 | 21 | 5.00/5.0 |
| Christopher | 3 | $149,477 | 95 | 4.84/5.0 |
| Elisabeth | 15 | $141,854 | 89 | 4.52/5.0 |
| Emeline | 3 | $134,481 | 47 | 4.98/5.0 |
| Joany | 1 | $122,099 | 19 | 4.89/5.0 |
| Delphine | 4 | $121,731 | 133 | 4.95/5.0 |
| Caroline | 2 | $119,313 | 87 | 4.98/5.0 |
Analyzing the strategies of top hosts, such as their property selection, pricing, and guest communication, can offer valuable lessons for optimizing your own Airbnb operations in Le Plan-de-la-Tour.
Dive Deeper: Advanced Le Plan-de-la-Tour STR Market Data (2026)
Ready to unlock more insights? AirROI provides access to advanced metrics and comprehensive Airbnb data for Le Plan-de-la-Tour. Explore detailed analytics beyond this report to refine your investment strategy, optimize pricing, and maximize your vacation rental profits.
Explore Advanced MetricsLe Plan-de-la-Tour Short-Term Rental Market Composition (2026): Property & Room Types
Room Type Distribution
Property Type Distribution
Market Composition Insights for Le Plan-de-la-Tour
- The Le Plan-de-la-Tour Airbnb market composition is heavily skewed towards Entire Home/Apt listings, which make up 90.6% of the 180 active rentals. This indicates strong guest preference for privacy and space.
- Looking at the property type distribution in Le Plan-de-la-Tour, House properties are the most common (70.6%), reflecting the local real estate landscape.
- Houses represent a significant 70.6% portion, catering likely to families or larger groups.
- The presence of 7.8% Hotel/Boutique listings indicates integration with traditional hospitality.
- Smaller segments like outdoor/unique, unique stays, others (combined 2.3%) offer potential for unique stay experiences.
Le Plan-de-la-Tour Airbnb Room Capacity Analysis (2026): Bedroom Distribution
Distribution of Listings by Number of Bedrooms
Room Capacity Insights for Le Plan-de-la-Tour
- The dominant room capacity in Le Plan-de-la-Tour is 1 bedroom listings, making up 24.4% of the market. This suggests a strong demand for properties suitable for couples or solo travelers.
- Together, 1 bedroom and 3 bedrooms properties represent 42.7% of the active Airbnb listings in Le Plan-de-la-Tour, indicating a high concentration in these sizes.
- A significant 48.3% of listings offer 3+ bedrooms, catering to larger groups and families seeking more space in Le Plan-de-la-Tour.
Le Plan-de-la-Tour Vacation Rental Guest Capacity Trends (2026)
Distribution of Listings by Guest Capacity
Guest Capacity Insights for Le Plan-de-la-Tour
- The most common guest capacity trend in Le Plan-de-la-Tour vacation rentals is listings accommodating 8+ guests (32.8%). This suggests the primary traveler segment is likely larger groups.
- Properties designed for 8+ guests and 4 guests dominate the Le Plan-de-la-Tour STR market, accounting for 55.0% of listings.
- 49.5% of properties accommodate 6+ guests, serving the market segment for larger families or group travel in Le Plan-de-la-Tour.
- On average, properties in Le Plan-de-la-Tour are equipped to host 5.1 guests.
Le Plan-de-la-Tour Airbnb Booking Patterns (2026): Available vs. Booked Days
Available Days Distribution
Booked Days Distribution
Booking Pattern Insights for Le Plan-de-la-Tour
- The most common availability pattern in Le Plan-de-la-Tour falls within the 271-366 days range, representing 63.9% of listings. This suggests many properties have significant open periods on their calendars.
- Approximately 93.9% of listings show high availability (181+ days open annually), indicating potential for increased bookings or specific owner usage patterns.
- For booked days, the 31-90 days range is most frequent in Le Plan-de-la-Tour (36.1%), reflecting common guest stay durations or potential owner blocking patterns.
- A notable 6.7% of properties secure long booking periods (181+ days booked per year), highlighting successful long-term rental strategies or significant owner usage.
Le Plan-de-la-Tour Airbnb Minimum Stay Requirements Analysis
Distribution of Listings by Minimum Night Requirement
1 Night
10 listings
5.6% of total
2 Nights
11 listings
6.1% of total
3 Nights
13 listings
7.2% of total
4-6 Nights
35 listings
19.4% of total
7-29 Nights
32 listings
17.8% of total
30+ Nights
79 listings
43.9% of total
Key Insights
- The most prevalent minimum stay requirement in Le Plan-de-la-Tour is 30+ Nights, adopted by 43.9% of listings. This highlights the market's preference for longer commitments.
- Very short stays (1-2 nights) are less common (11.7%), suggesting hosts prefer slightly longer bookings to optimize turnover.
- A significant segment (43.9%) caters to monthly stays (30+ nights) in Le Plan-de-la-Tour, pointing to opportunities in the extended-stay market.
Recommendations
- Align with the market by considering a 30+ Nights minimum stay, as 43.9% of Le Plan-de-la-Tour hosts use this setting.
- If feasible, allowing 1-night stays, especially midweek or during low season, could capture last-minute bookings, as only 5.6% currently do.
- Explore offering discounts for stays of 30+ nights to attract the 43.9% of the market seeking extended stays.
- Adjust minimum nights based on seasonality – potentially shorter during low season and longer during peak demand periods in Le Plan-de-la-Tour.
Le Plan-de-la-Tour Airbnb Cancellation Policy Trends Analysis (2026)
Non-refundable
2 listings
1.1% of total
Super Strict 30 Days
8 listings
4.4% of total
Limited
5 listings
2.8% of total
Super Strict 60 Days
2 listings
1.1% of total
Flexible
19 listings
10.6% of total
Moderate
17 listings
9.4% of total
Firm
97 listings
53.9% of total
Strict
30 listings
16.7% of total
Cancellation Policy Insights for Le Plan-de-la-Tour
- The prevailing Airbnb cancellation policy trend in Le Plan-de-la-Tour is Firm, used by 53.9% of listings.
- A majority (70.6%) of hosts in Le Plan-de-la-Tour utilize Firm or Strict policies, indicating a market where hosts prioritize booking security.
Recommendations for Hosts
- Consider adopting a Firm policy to align with the 53.9% market standard in Le Plan-de-la-Tour.
- Regularly review your cancellation policy against competitors and market demand shifts in Le Plan-de-la-Tour.
Le Plan-de-la-Tour STR Booking Lead Time Analysis (2026)
Average Booking Lead Time by Month
Booking Lead Time Insights for Le Plan-de-la-Tour
- The overall average booking lead time for vacation rentals in Le Plan-de-la-Tour is 73 days.
- Guests book furthest in advance for stays during August (average 102 days), likely coinciding with peak travel demand or local events.
- The shortest booking windows occur for stays in February (average 30 days), indicating more last-minute travel plans during this time.
- Seasonally, Summer (86 days avg.) sees the longest lead times, while Winter (30 days avg.) has the shortest, reflecting typical travel planning cycles.
Recommendations for Hosts
- Use the overall average lead time (73 days) as a baseline for your pricing and availability strategy in Le Plan-de-la-Tour.
- For August stays, consider implementing length-of-stay discounts or slightly higher rates for bookings made less than 102 days out to capitalize on advance planning.
- Target marketing efforts for the Summer season well in advance (at least 86 days) to capture early planners.
- Monitor your own booking lead times against these Le Plan-de-la-Tour averages to identify opportunities for dynamic pricing adjustments.
Popular & Essential Airbnb Amenities in Le Plan-de-la-Tour (2026)
Amenity Prevalence
Amenity Insights for Le Plan-de-la-Tour
- Essential amenities in Le Plan-de-la-Tour that guests expect include: TV. Lacking these (this) could significantly impact bookings.
- Popular amenities like Free parking on premises, Wifi, Heating are common but not universal. Offering these can provide a competitive edge.
- A pool is a highly desired but not standard amenity, making it a key feature for attracting guests seeking leisure in Le Plan-de-la-Tour.
- Warning: Wifi is not universally provided but is considered essential globally. Ensure reliable Wifi is offered.
Recommendations for Hosts
- Ensure your listing includes all essential amenities for Le Plan-de-la-Tour: TV.
- Prioritize adding missing essentials: TV.
- Consider adding popular differentiators like Free parking on premises or Wifi to increase appeal.
- Highlight unique or less common amenities you offer (e.g., hot tub, dedicated workspace, EV charger) in your listing description and photos.
- Regularly check competitor amenities in Le Plan-de-la-Tour to stay competitive.
Le Plan-de-la-Tour Airbnb Guest Demographics & Profile Analysis (2026)
Guest Profile Summary for Le Plan-de-la-Tour
- The typical guest profile for Airbnb in Le Plan-de-la-Tour consists of a mix of domestic (40%) and international guests, with top international origins including United Kingdom, typically belonging to the Post-2000s (Gen Z/Alpha) group (50%), primarily speaking English or French.
- Domestic travelers account for 39.5% of guests.
- Key international markets include France (39.5%) and United Kingdom (13.3%).
- Top languages spoken are English (38.2%) followed by French (25.5%).
- A significant demographic segment is the Post-2000s (Gen Z/Alpha) group, representing 50% of guests.
Recommendations for Hosts
- Focus marketing internationally, particularly towards travelers from United Kingdom.
- Tailor amenities and listing descriptions to appeal to the dominant Post-2000s (Gen Z/Alpha) demographic (e.g., highlight fast WiFi, smart home features, local guides).
- Highlight unique local experiences or amenities relevant to the primary guest profile.
- Consider seasonal promotions aligned with peak travel times for key origin markets.
Nearby Short-Term Rental Market Comparison
How does the Le Plan-de-la-Tour Airbnb market stack up against its neighbors? Compare key performance metrics like average monthly revenue, ADR, and occupancy rates in surrounding areas to understand the broader regional STR landscape.
| Market | Active Properties | Monthly Revenue | Daily Rate | Avg. Occupancy |
|---|---|---|---|---|
| Monteu Roero | 12 | $5,184 | $403.07 | 41% |
| Ramatuelle | 231 | $4,086 | $662.31 | 40% |
| Saint-Jean-Cap-Ferrat | 114 | $3,894 | $465.00 | 44% |
| Saint-Tropez | 847 | $3,591 | $514.76 | 39% |
| Monaco | 193 | $3,208 | $490.13 | 36% |
| Puget | 30 | $3,152 | $362.65 | 41% |
| Gordes | 251 | $3,129 | $406.17 | 41% |
| Opio | 41 | $3,101 | $542.89 | 41% |
| Villefranche-sur-Mer | 494 | $3,095 | $295.76 | 50% |
| Tourrettes-sur-Loup | 168 | $3,021 | $399.67 | 44% |