Aix-en-Provence Airbnb Market Analysis 2026: Short Term Rental Data & Vacation Rental Statistics in Provence-Alpes-Côte d'Azur, France
Is Airbnb profitable in Aix-en-Provence in 2026? Explore comprehensive Airbnb analytics for Aix-en-Provence, Provence-Alpes-Côte d'Azur, France to uncover income potential. This 2026 STR market report for Aix-en-Provence, based on AirROI data from February 2025 to January 2026, reveals key trends in the bustling market of 2,210 active listings.
Whether you're considering an Airbnb investment in Aix-en-Provence, optimizing your existing vacation rental, or exploring rental arbitrage opportunities, understanding the Aix-en-Provence Airbnb data is crucial. Navigating the high regulation landscape is key to maximizing your short term rental income potential. Let's dive into the specifics.
Key Aix-en-Provence Airbnb Performance Metrics Overview
Monthly Airbnb Revenue Variations & Income Potential in Aix-en-Provence (2026)
Understanding the monthly revenue variations for Airbnb listings in Aix-en-Provence is key to maximizing your short term rental income potential. Seasonality significantly impacts earnings. Our analysis, based on data from the past 12 months, shows that the peak revenue month for STRs in Aix-en-Provence is typically July, while January often presents the lowest earnings, highlighting opportunities for strategic pricing adjustments during shoulder and low seasons. Explore the typical Airbnb income in Aix-en-Provence across different performance tiers:
- Best-in-class properties (Top 10%) achieve $4,505+ monthly, often utilizing dynamic pricing and superior guest experiences.
- Strong performing properties (Top 25%) earn $2,649 or more, indicating effective management and desirable locations/amenities.
- Typical properties (Median) generate around $1,595 per month, representing the average market performance.
- Entry-level properties (Bottom 25%) see earnings around $851, often with potential for optimization.
Average Monthly Airbnb Earnings Trend in Aix-en-Provence
Aix-en-Provence Airbnb Occupancy Rate Trends (2026)
Maximize your bookings by understanding the Aix-en-Provence STR occupancy trends. Seasonal demand shifts significantly influence how often properties are booked. Typically, Septembersees the highest demand (peak season occupancy), while January experiences the lowest (low season). Effective strategies, like adjusting minimum stays or offering promotions, can boost occupancy during slower periods. Here's how different property tiers perform in Aix-en-Provence:
- Best-in-class properties (Top 10%) achieve 85%+ occupancy, indicating high desirability and potentially optimized availability.
- Strong performing properties (Top 25%) maintain 71% or higher occupancy, suggesting good market fit and guest satisfaction.
- Typical properties (Median) have an occupancy rate around 48%.
- Entry-level properties (Bottom 25%) average 25% occupancy, potentially facing higher vacancy.
Average Monthly Occupancy Rate Trend in Aix-en-Provence
Average Daily Rate (ADR) Airbnb Trends in Aix-en-Provence (2026)
Effective short term rental pricing strategy in Aix-en-Provence involves understanding monthly ADR fluctuations. The Average Daily Rate (ADR) for Airbnb in Aix-en-Provence typically peaks in September and dips lowest during February. Leveraging Airbnb dynamic pricing tools or strategies based on this seasonality can significantly boost revenue. Here's a look at the typical nightly rates achieved:
- Best-in-class properties (Top 10%) command rates of $364+ per night, often due to premium features or locations.
- Strong performing properties (Top 25%) achieve nightly rates of $179 or more.
- Typical properties (Median) charge around $110 per night.
- Entry-level properties (Bottom 25%) earn around $78 per night.
Average Daily Rate (ADR) Trend by Month in Aix-en-Provence
Get Live Aix-en-Provence Market Intelligence 👇

Explore Real-time Analytics
Airbnb Seasonality Analysis & Trends in Aix-en-Provence (2026)
Peak Season (July, August, September)
- Revenue averages $3,138 per month
- Occupancy rates average 57.8%
- Daily rates average $175
Shoulder Season
- Revenue averages $2,162 per month
- Occupancy maintains around 48.6%
- Daily rates hold near $168
Low Season (January, February, March)
- Revenue drops to average $1,338 per month
- Occupancy decreases to average 39.0%
- Daily rates adjust to average $160
Seasonality Insights for Aix-en-Provence
- The Airbnb seasonality in Aix-en-Provence shows highly seasonal trends requiring careful strategy. While the sections above show seasonal averages, it's also insightful to look at the extremes:
- During the high season, the absolute peak month showcases Aix-en-Provence's highest earning potential, with monthly revenues capable of climbing to $3,303, occupancy reaching a high of 59.7%, and ADRs peaking at $178.
- Conversely, the slowest single month of the year, typically falling within the low season, marks the market's lowest point. In this month, revenue might dip to $1,161, occupancy could drop to 29.9%, and ADRs may adjust down to $155.
- Understanding both the seasonal averages and these monthly peaks and troughs in revenue, occupancy, and ADR is crucial for maximizing your Airbnb profit potential in Aix-en-Provence.
Seasonal Strategies for Maximizing Profit
- Peak Season: Maximize revenue through premium pricing and potentially longer minimum stays. Ensure high availability.
- Low Season: Offer competitive pricing, special promotions (e.g., extended stay discounts), and flexible cancellation policies. Target off-season travelers like remote workers or budget-conscious guests.
- Shoulder Seasons: Implement dynamic pricing that balances peak and low rates. Target weekend travelers or specific events. Offer slightly more flexible terms than peak season.
- Regularly analyze your own performance against these Aix-en-Provence seasonality benchmarks and adjust your pricing and availability strategy accordingly.
Best Areas for Airbnb Investment in Aix-en-Provence (2026)
Exploring the top neighborhoods for short-term rentals in Aix-en-Provence? This section highlights key areas, outlining why they are attractive for hosts and guests, along with notable local attractions. Consider these locations based on your target guest profile and investment strategy.
| Neighborhood / Area | Why Host Here? (Target Guests & Appeal) | Key Attractions & Landmarks |
|---|---|---|
| Cours Mirabeau | Famous tree-lined avenue in the heart of Aix-en-Provence, bustling with cafes, shops, and markets. Ideal for tourists who want to experience the vibrant local culture and charm. | Cours Mirabeau, Place des Prêcheurs, Saint-Sauveur Cathedral, Les Deux Garçons Café, Aix Market |
| Old Town | The historic center of Aix-en-Provence, filled with charm and character. Narrow streets lined with boutiques and eateries, perfect for travelers seeking an authentic experience. | Old Town Streets, Hotel de Ville, Place des Martyrs, Cours Sextius, Fontaine des Quatre Dauphins |
| Parc Jourdan | A peaceful park area popular with locals and tourists alike, providing a quieter setting away from the hustle and bustle. Great for families and those looking for green spaces. | Parc Jourdan, Café de la Mairie, Statue of Paul Cézanne, Botanical Gardens, Children's Playground |
| Les Milles | A suburban area with a mix of residential and commercial spaces, known for its proximity to the Aix-en-Provence TGV station, making it ideal for business travelers and short-term guests. | Cultural Center, Aix-en-Provence TGV Station, Espace des Sciences, Aix Memorial Museum |
| Avenue Victor Hugo | An elegant street featuring luxury shops and Michelin-starred restaurants, appealing to those looking for a upscale tourist experience in Aix. | Fine Dining Restaurants, Luxury Boutiques, Art Galleries, City Tram |
| Saint-Jean-de-Malte | A historic neighborhood known for its ancient buildings and quaint streets, offering a unique perspective of Aix's history and architecture, ideal for those who appreciate the arts. | Saint-Jean-de-Malte Church, Historical Sites, Artisan Shops, Local Restaurants |
| Aix-en-Provence Market | Home to one of the most famous markets in the region, attracting locals and tourists for its fresh produce and artisanal goods, perfect for foodies. | Main Market, Local Artisans, Culinary Delights, Café Culture |
| Chapelle de la Charité | A serene area known for its artistic vibe and proximity to various galleries, ideal for those who appreciate culture and the arts. | Art Galleries, Local Studios, Scenic Views, Cultural Festivals |
Understanding Airbnb License Requirements & STR Laws in Aix-en-Provence (2026)
Yes, Aix-en-Provence, Provence-Alpes-Côte d'Azur, France enforces high STR regulations. Obtaining a license and ensuring compliance is almost certainly required according to current 2026 STR laws. Always verify the latest short term rental regulations and Airbnb license requirements directly with local government authorities for Aix-en-Provence to ensure full compliance before hosting.
(Source: AirROI data, 2026, based on 83% licensed listings)
Top Performing Airbnb Properties in Aix-en-Provence (2026)
Benchmark your potential! Explore examples of top-performing Airbnb properties in Aix-en-Provencebased on Trailing Twelve Month (TTM) revenue. Analyze their characteristics, revenue, occupancy rate, and ADR to understand what drives success in this market.
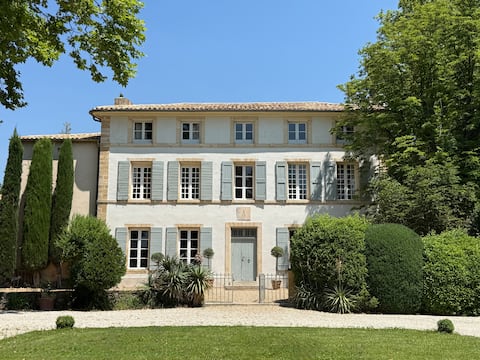
Authentic Bastide du Clos Bonnet
Entire Place • 8 bedrooms
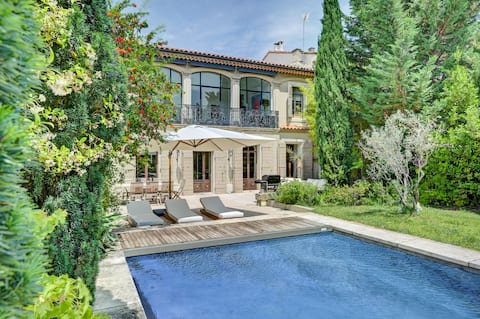
"Villa Chartreux" A 17th Century Town house in Aix
Entire Place • 5 bedrooms
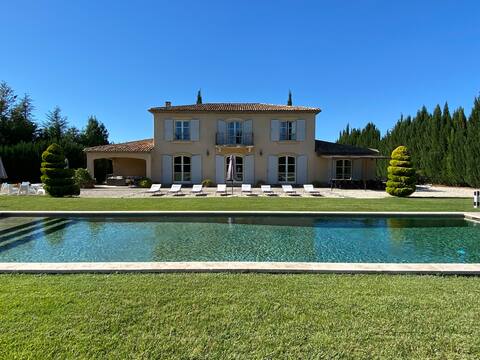
Bastide Aixoise, Luxury and wide open spaces
Entire Place • 8 bedrooms
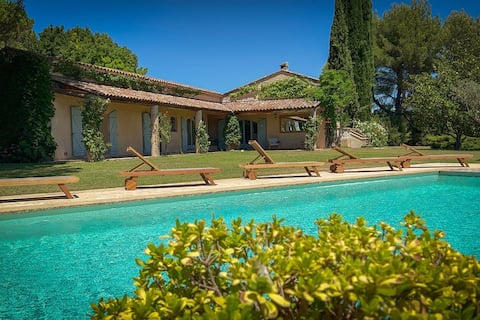
The Villa La Source
Entire Place • 7 bedrooms
Luxurious Modern House Infinit Pool
Entire Place • 8 bedrooms

Magnifique Mas Provençal - Aix-en-Provence
Entire Place • 8 bedrooms
Note: Performance varies based on location, size, amenities, seasonality, and management quality. Data reflects the past 12 months.
Top Performing Airbnb Hosts in Aix-en-Provence (2026)
Learn from the best! This table showcases top-performing Airbnb hosts in Aix-en-Provence based on the number of properties managed and estimated total revenue over the past year. Analyze their scale and performance metrics.
| Host Name | Properties | Grossing Revenue | Stay Reviews | Avg Rating |
|---|---|---|---|---|
| Enguerrand Et Elodie | 30 | $793,657 | 2047 | 4.73/5.0 |
| Valentin | 41 | $596,328 | 1470 | 4.40/5.0 |
| Aurore | 37 | $541,688 | 2831 | 4.49/5.0 |
| Stéphanie | 23 | $456,794 | 933 | 4.72/5.0 |
| APPART AIXQUIS Location Aix En | 19 | $415,504 | 189 | 4.76/5.0 |
| Laurence | 7 | $374,373 | 582 | 4.88/5.0 |
| Jennifer BELPASSI | 15 | $341,563 | 765 | 4.59/5.0 |
| Emma Et Silvio | 9 | $333,391 | 294 | 4.84/5.0 |
| Hélène | 10 | $320,339 | 451 | 4.91/5.0 |
| Rebecca | 32 | $293,832 | 2432 | 4.74/5.0 |
Analyzing the strategies of top hosts, such as their property selection, pricing, and guest communication, can offer valuable lessons for optimizing your own Airbnb operations in Aix-en-Provence.
Dive Deeper: Advanced Aix-en-Provence STR Market Data (2026)
Ready to unlock more insights? AirROI provides access to advanced metrics and comprehensive Airbnb data for Aix-en-Provence. Explore detailed analytics beyond this report to refine your investment strategy, optimize pricing, and maximize your vacation rental profits.
Explore Advanced MetricsAix-en-Provence Short-Term Rental Market Composition (2026): Property & Room Types
Room Type Distribution
Property Type Distribution
Market Composition Insights for Aix-en-Provence
- The Aix-en-Provence Airbnb market composition is heavily skewed towards Entire Home/Apt listings, which make up 91.8% of the 2,210 active rentals. This indicates strong guest preference for privacy and space.
- Looking at the property type distribution in Aix-en-Provence, Apartment/Condo properties are the most common (73.8%), reflecting the local real estate landscape.
- Houses represent a significant 21.9% portion, catering likely to families or larger groups.
- Smaller segments like hotel/boutique, others, unique stays, outdoor/unique (combined 4.2%) offer potential for unique stay experiences.
Aix-en-Provence Airbnb Room Capacity Analysis (2026): Bedroom Distribution
Distribution of Listings by Number of Bedrooms
Room Capacity Insights for Aix-en-Provence
- The dominant room capacity in Aix-en-Provence is 1 bedroom listings, making up 44.1% of the market. This suggests a strong demand for properties suitable for couples or solo travelers.
- Together, 1 bedroom and 2 bedrooms properties represent 61.9% of the active Airbnb listings in Aix-en-Provence, indicating a high concentration in these sizes.
Aix-en-Provence Vacation Rental Guest Capacity Trends (2026)
Distribution of Listings by Guest Capacity
Guest Capacity Insights for Aix-en-Provence
- The most common guest capacity trend in Aix-en-Provence vacation rentals is listings accommodating 2 guests (38.2%). This suggests the primary traveler segment is likely couples or solo travelers.
- Properties designed for 2 guests and 4 guests dominate the Aix-en-Provence STR market, accounting for 63.6% of listings.
- 19.9% of properties accommodate 6+ guests, serving the market segment for larger families or group travel in Aix-en-Provence.
- On average, properties in Aix-en-Provence are equipped to host 3.5 guests.
Aix-en-Provence Airbnb Booking Patterns (2026): Available vs. Booked Days
Available Days Distribution
Booked Days Distribution
Booking Pattern Insights for Aix-en-Provence
- The most common availability pattern in Aix-en-Provence falls within the 271-366 days range, representing 41.9% of listings. This suggests many properties have significant open periods on their calendars.
- Approximately 74.1% of listings show high availability (181+ days open annually), indicating potential for increased bookings or specific owner usage patterns.
- For booked days, the 91-180 days range is most frequent in Aix-en-Provence (32.2%), reflecting common guest stay durations or potential owner blocking patterns.
- A notable 27.4% of properties secure long booking periods (181+ days booked per year), highlighting successful long-term rental strategies or significant owner usage.
Aix-en-Provence Airbnb Minimum Stay Requirements Analysis
Distribution of Listings by Minimum Night Requirement
1 Night
288 listings
13% of total
2 Nights
446 listings
20.2% of total
3 Nights
230 listings
10.4% of total
4-6 Nights
269 listings
12.2% of total
7-29 Nights
119 listings
5.4% of total
30+ Nights
858 listings
38.8% of total
Key Insights
- The most prevalent minimum stay requirement in Aix-en-Provence is 30+ Nights, adopted by 38.8% of listings. This highlights the market's preference for longer commitments.
- A significant segment (38.8%) caters to monthly stays (30+ nights) in Aix-en-Provence, pointing to opportunities in the extended-stay market.
Recommendations
- Align with the market by considering a 30+ Nights minimum stay, as 38.8% of Aix-en-Provence hosts use this setting.
- If feasible, allowing 1-night stays, especially midweek or during low season, could capture last-minute bookings, as only 13% currently do.
- Explore offering discounts for stays of 30+ nights to attract the 38.8% of the market seeking extended stays.
- Adjust minimum nights based on seasonality – potentially shorter during low season and longer during peak demand periods in Aix-en-Provence.
Aix-en-Provence Airbnb Cancellation Policy Trends Analysis (2026)
Super Strict 60 Days
4 listings
0.2% of total
Limited
23 listings
1% of total
Super Strict 30 Days
1 listings
0% of total
Flexible
559 listings
25.4% of total
Moderate
699 listings
31.7% of total
Firm
699 listings
31.7% of total
Strict
217 listings
9.9% of total
Cancellation Policy Insights for Aix-en-Provence
- The prevailing Airbnb cancellation policy trend in Aix-en-Provence is Moderate, used by 31.7% of listings.
- There's a relatively balanced mix between guest-friendly (57.1%) and stricter (41.6%) policies, offering choices for different guest needs.
- Strict cancellation policies are quite rare (9.9%), potentially making listings with this policy less competitive unless justified by high demand or property type.
Recommendations for Hosts
- Consider adopting a Moderate policy to align with the 31.7% market standard in Aix-en-Provence.
- Using a Strict policy might deter some guests, as only 9.9% of listings use it. Evaluate if potential revenue protection outweighs possible lower booking rates.
- Regularly review your cancellation policy against competitors and market demand shifts in Aix-en-Provence.
Aix-en-Provence STR Booking Lead Time Analysis (2026)
Average Booking Lead Time by Month
Booking Lead Time Insights for Aix-en-Provence
- The overall average booking lead time for vacation rentals in Aix-en-Provence is 51 days.
- Guests book furthest in advance for stays during May (average 63 days), likely coinciding with peak travel demand or local events.
- The shortest booking windows occur for stays in February (average 27 days), indicating more last-minute travel plans during this time.
- Seasonally, Summer (58 days avg.) sees the longest lead times, while Winter (32 days avg.) has the shortest, reflecting typical travel planning cycles.
Recommendations for Hosts
- Use the overall average lead time (51 days) as a baseline for your pricing and availability strategy in Aix-en-Provence.
- For May stays, consider implementing length-of-stay discounts or slightly higher rates for bookings made less than 63 days out to capitalize on advance planning.
- Target marketing efforts for the Summer season well in advance (at least 58 days) to capture early planners.
- Monitor your own booking lead times against these Aix-en-Provence averages to identify opportunities for dynamic pricing adjustments.
Popular & Essential Airbnb Amenities in Aix-en-Provence (2026)
Amenity Prevalence
Amenity Insights for Aix-en-Provence
- Popular amenities like Kitchen, Wifi, Heating are common but not universal. Offering these can provide a competitive edge.
- Warning: Wifi is not universally provided but is considered essential globally. Ensure reliable Wifi is offered.
Recommendations for Hosts
- Consider adding popular differentiators like Kitchen or Wifi to increase appeal.
- Highlight unique or less common amenities you offer (e.g., hot tub, dedicated workspace, EV charger) in your listing description and photos.
- Regularly check competitor amenities in Aix-en-Provence to stay competitive.
Aix-en-Provence Airbnb Guest Demographics & Profile Analysis (2026)
Guest Profile Summary for Aix-en-Provence
- The typical guest profile for Airbnb in Aix-en-Provence consists of a mix of domestic (50%) and international guests, often arriving from nearby Paris, typically belonging to the Post-2000s (Gen Z/Alpha) group (50%), primarily speaking English or French.
- Domestic travelers account for 50.4% of guests.
- Key international markets include France (50.4%) and United States (14.7%).
- Top languages spoken are English (38.8%) followed by French (30.7%).
- A significant demographic segment is the Post-2000s (Gen Z/Alpha) group, representing 50% of guests.
Recommendations for Hosts
- Balance marketing efforts between domestic and international channels based on the guest mix.
- Tailor amenities and listing descriptions to appeal to the dominant Post-2000s (Gen Z/Alpha) demographic (e.g., highlight fast WiFi, smart home features, local guides).
- Highlight unique local experiences or amenities relevant to the primary guest profile.
- Consider seasonal promotions aligned with peak travel times for key origin markets.
Nearby Short-Term Rental Market Comparison
How does the Aix-en-Provence Airbnb market stack up against its neighbors? Compare key performance metrics like average monthly revenue, ADR, and occupancy rates in surrounding areas to understand the broader regional STR landscape.
| Market | Active Properties | Monthly Revenue | Daily Rate | Avg. Occupancy |
|---|---|---|---|---|
| Ramatuelle | 231 | $4,086 | $662.31 | 40% |
| Saint-Tropez | 847 | $3,591 | $514.76 | 39% |
| Cavillargues | 12 | $3,274 | $342.99 | 43% |
| Eygalières | 82 | $3,206 | $417.97 | 39% |
| Puget | 30 | $3,152 | $362.65 | 41% |
| Gordes | 251 | $3,129 | $406.17 | 41% |
| Opio | 41 | $3,101 | $542.89 | 41% |
| Divajeu | 20 | $3,061 | $421.97 | 32% |
| Goult | 88 | $2,994 | $342.26 | 44% |
| Suzette | 12 | $2,973 | $415.98 | 37% |