Annavascha Airbnb Market Analysis 2026: Short Term Rental Data & Vacation Rental Statistics in Provence-Alpes-Côte d'Azur, France
Is Airbnb profitable in Annavascha in 2026? Explore comprehensive Airbnb analytics for Annavascha, Provence-Alpes-Côte d'Azur, France to uncover income potential. This 2026 STR market report for Annavascha, based on AirROI data from February 2025 to January 2026, reveals key trends in the niche market of 71 active listings.
Whether you're considering an Airbnb investment in Annavascha, optimizing your existing vacation rental, or exploring rental arbitrage opportunities, understanding the Annavascha Airbnb data is crucial. Leveraging the low regulation environment is key to maximizing your short term rental income potential. Let's dive into the specifics.
Key Annavascha Airbnb Performance Metrics Overview
Monthly Airbnb Revenue Variations & Income Potential in Annavascha (2026)
Understanding the monthly revenue variations for Airbnb listings in Annavascha is key to maximizing your short term rental income potential. Seasonality significantly impacts earnings. Our analysis, based on data from the past 12 months, shows that the peak revenue month for STRs in Annavascha is typically August, while April often presents the lowest earnings, highlighting opportunities for strategic pricing adjustments during shoulder and low seasons. Explore the typical Airbnb income in Annavascha across different performance tiers:
- Best-in-class properties (Top 10%) achieve $2,908+ monthly, often utilizing dynamic pricing and superior guest experiences.
- Strong performing properties (Top 25%) earn $1,953 or more, indicating effective management and desirable locations/amenities.
- Typical properties (Median) generate around $1,277 per month, representing the average market performance.
- Entry-level properties (Bottom 25%) see earnings around $794, often with potential for optimization.
Average Monthly Airbnb Earnings Trend in Annavascha
Annavascha Airbnb Occupancy Rate Trends (2026)
Maximize your bookings by understanding the Annavascha STR occupancy trends. Seasonal demand shifts significantly influence how often properties are booked. Typically, Augustsees the highest demand (peak season occupancy), while December experiences the lowest (low season). Effective strategies, like adjusting minimum stays or offering promotions, can boost occupancy during slower periods. Here's how different property tiers perform in Annavascha:
- Best-in-class properties (Top 10%) achieve 80%+ occupancy, indicating high desirability and potentially optimized availability.
- Strong performing properties (Top 25%) maintain 60% or higher occupancy, suggesting good market fit and guest satisfaction.
- Typical properties (Median) have an occupancy rate around 43%.
- Entry-level properties (Bottom 25%) average 25% occupancy, potentially facing higher vacancy.
Average Monthly Occupancy Rate Trend in Annavascha
Average Daily Rate (ADR) Airbnb Trends in Annavascha (2026)
Effective short term rental pricing strategy in Annavascha involves understanding monthly ADR fluctuations. The Average Daily Rate (ADR) for Airbnb in Annavascha typically peaks in July and dips lowest during April. Leveraging Airbnb dynamic pricing tools or strategies based on this seasonality can significantly boost revenue. Here's a look at the typical nightly rates achieved:
- Best-in-class properties (Top 10%) command rates of $228+ per night, often due to premium features or locations.
- Strong performing properties (Top 25%) achieve nightly rates of $155 or more.
- Typical properties (Median) charge around $116 per night.
- Entry-level properties (Bottom 25%) earn around $82 per night.
Average Daily Rate (ADR) Trend by Month in Annavascha
Get Live Annavascha Market Intelligence 👇

Explore Real-time Analytics
Airbnb Seasonality Analysis & Trends in Annavascha (2026)
Peak Season (August, July, February)
- Revenue averages $2,513 per month
- Occupancy rates average 66.7%
- Daily rates average $137
Shoulder Season
- Revenue averages $1,348 per month
- Occupancy maintains around 40.3%
- Daily rates hold near $128
Low Season (April, November, December)
- Revenue drops to average $935 per month
- Occupancy decreases to average 31.2%
- Daily rates adjust to average $128
Seasonality Insights for Annavascha
- The Airbnb seasonality in Annavascha shows highly seasonal trends requiring careful strategy. While the sections above show seasonal averages, it's also insightful to look at the extremes:
- During the high season, the absolute peak month showcases Annavascha's highest earning potential, with monthly revenues capable of climbing to $2,835, occupancy reaching a high of 73.1%, and ADRs peaking at $139.
- Conversely, the slowest single month of the year, typically falling within the low season, marks the market's lowest point. In this month, revenue might dip to $809, occupancy could drop to 27.6%, and ADRs may adjust down to $122.
- Understanding both the seasonal averages and these monthly peaks and troughs in revenue, occupancy, and ADR is crucial for maximizing your Airbnb profit potential in Annavascha.
Seasonal Strategies for Maximizing Profit
- Peak Season: Maximize revenue through premium pricing and potentially longer minimum stays. Ensure high availability.
- Low Season: Offer competitive pricing, special promotions (e.g., extended stay discounts), and flexible cancellation policies. Target off-season travelers like remote workers or budget-conscious guests.
- Shoulder Seasons: Implement dynamic pricing that balances peak and low rates. Target weekend travelers or specific events. Offer slightly more flexible terms than peak season.
- Regularly analyze your own performance against these Annavascha seasonality benchmarks and adjust your pricing and availability strategy accordingly.
Best Areas for Airbnb Investment in Annavascha (2026)
Exploring the top neighborhoods for short-term rentals in Annavascha? This section highlights key areas, outlining why they are attractive for hosts and guests, along with notable local attractions. Consider these locations based on your target guest profile and investment strategy.
| Neighborhood / Area | Why Host Here? (Target Guests & Appeal) | Key Attractions & Landmarks |
|---|---|---|
| Avignon | A historic city known for its stunning architecture, rich history, and vibrant culture. Great for tourists interested in exploring the Palais des Papes and the famous bridge. | Palais des Papes, Pont Saint-Bénézet, Avignon Museum, Place de l'Horloge, Rue de la République |
| Aix-en-Provence | Famous for its beautiful architecture and art scene, Aix-en-Provence attracts those looking for culture, good food, and stunning landscapes. | Cours Mirabeau, Saint-Sauveur Cathedral, Atelier Cézanne, Pavillon de Vendôme, Landscape of Montagne Sainte-Victoire |
| Marseille | France's second-largest city, known for its vibrant mix of cultures, beautiful port, and Mediterranean beaches. A popular destination for both leisure and business travelers. | Old Port of Marseille, Basilique Notre-Dame de la Garde, Château d'If, Calanques National Park, Le Panier district |
| Saint-Tropez | Renowned for its beaches and vibrant nightlife, Saint-Tropez is a favorite among celebrities and tourists. Perfect for those looking for luxury experiences by the sea. | Pampelonne Beach, Citadel of Saint-Tropez, Place des Lices, Museum of Maritime History, Les Salins Beach |
| Cannes | Famed for its film festival and luxury hotels, Cannes offers beautiful beaches and high-end shopping, attracting tourists year-round. | Boulevard de la Croisette, Palais des Festivals, Cannes Film Festival, Îles de Lérins, Marche Forville |
| Nice | Known for its stunning waterfront, beautiful Mediterranean climate, and rich artistic heritage. A hot spot for vacationers and those seeking a vibrant city life. | Promenade des Anglais, Old Town (Vieux Nice), Castle Hill, Marc Chagall National Museum, Nice Carnival |
| Gorges du Verdon | One of the most beautiful natural sites in France, known for its stunning canyon views and outdoor activities, making it a great spot for nature enthusiasts. | Gorges du Verdon, Lake of Ste. Croix, Verdon Natural Regional Park, Kayaking and hiking opportunities, Château de Gréoux-les-Bains |
| Moustiers-Sainte-Marie | A picturesque village known for its pottery and stunning location near the Verdon canyon. Attractive to tourists looking for charm and beauty in nature. | Notre-Dame de Beauvoir Chapel, Moustiers Pottery shops, Lavender fields, Cascades de l'Issalette, Cycling routes through the countryside |
Understanding Airbnb License Requirements & STR Laws in Annavascha (2026)
While Annavascha, Provence-Alpes-Côte d'Azur, France currently shows low STR regulations, specific Airbnb license requirements might still exist or change. Always verify the latest short term rental regulations and Airbnb license requirements directly with local government authorities for Annavascha to ensure full compliance before hosting.
(Source: AirROI data, 2026, based on 6% licensed listings)
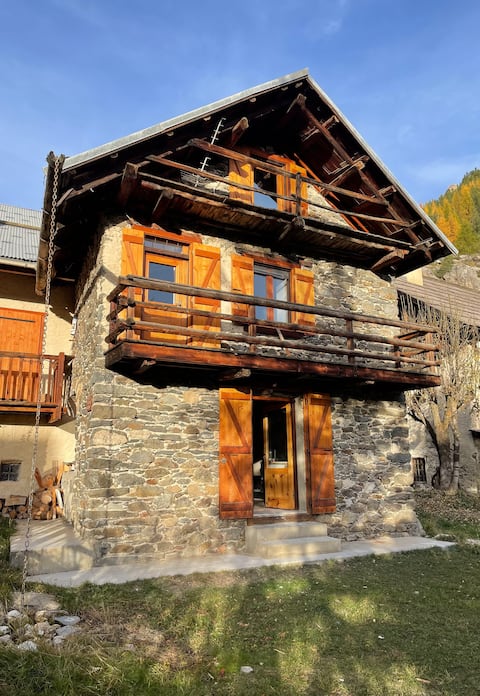
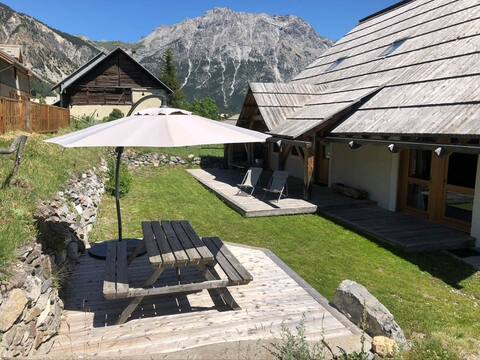
Top Performing Airbnb Properties in Annavascha (2026)
Benchmark your potential! Explore examples of top-performing Airbnb properties in Annavaschabased on Trailing Twelve Month (TTM) revenue. Analyze their characteristics, revenue, occupancy rate, and ADR to understand what drives success in this market.
typical country house
Entire Place • 5 bedrooms
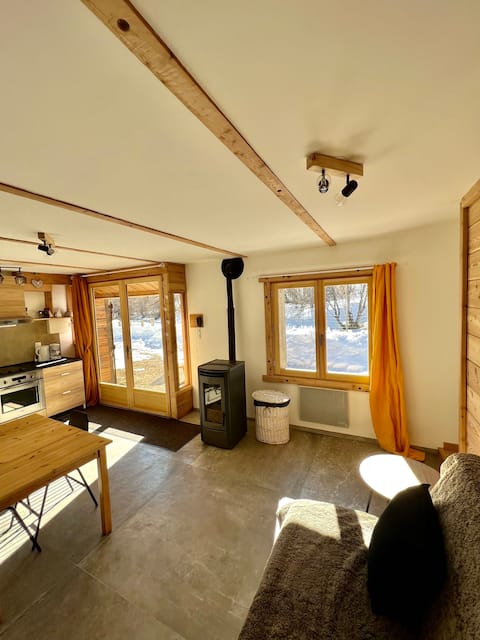
Casa Vallée Apartment in a chalet in Névache
Entire Place • 2 bedrooms
Peaceful house with garden - hiking trails start here
Entire Place • 4 bedrooms
Chalet Dounia
Entire Place • 4 bedrooms

2-room apartment/2 pers. in Névache
Entire Place • 1 bedroom
Charming single-story garden house in Clarée
Entire Place • 1 bedroom
Note: Performance varies based on location, size, amenities, seasonality, and management quality. Data reflects the past 12 months.
Top Performing Airbnb Hosts in Annavascha (2026)
Learn from the best! This table showcases top-performing Airbnb hosts in Annavascha based on the number of properties managed and estimated total revenue over the past year. Analyze their scale and performance metrics.
| Host Name | Properties | Grossing Revenue | Stay Reviews | Avg Rating |
|---|---|---|---|---|
| NevacheLocation | 13 | $107,015 | 62 | 4.83/5.0 |
| Cécile | 1 | $46,510 | 16 | 4.69/5.0 |
| Brigitte | 4 | $38,398 | 15 | 4.83/5.0 |
| Robin | 3 | $28,560 | 7 | 5.00/5.0 |
| Frédéric Et Véronique | 1 | $28,014 | 57 | 4.96/5.0 |
| Bruno | 1 | $27,506 | 12 | 4.83/5.0 |
| Genevieve | 2 | $26,520 | 29 | 4.67/5.0 |
| Robin | 4 | $26,203 | 22 | 4.87/5.0 |
| Corinne | 2 | $24,868 | 70 | 4.80/5.0 |
| Andrea | 2 | $24,784 | 80 | 4.84/5.0 |
Analyzing the strategies of top hosts, such as their property selection, pricing, and guest communication, can offer valuable lessons for optimizing your own Airbnb operations in Annavascha.
Dive Deeper: Advanced Annavascha STR Market Data (2026)
Ready to unlock more insights? AirROI provides access to advanced metrics and comprehensive Airbnb data for Annavascha. Explore detailed analytics beyond this report to refine your investment strategy, optimize pricing, and maximize your vacation rental profits.
Explore Advanced MetricsAnnavascha Short-Term Rental Market Composition (2026): Property & Room Types
Room Type Distribution
Property Type Distribution
Market Composition Insights for Annavascha
- The Annavascha Airbnb market composition is heavily skewed towards Entire Home/Apt listings, which make up 98.6% of the 71 active rentals. This indicates strong guest preference for privacy and space.
- Looking at the property type distribution in Annavascha, Apartment/Condo properties are the most common (54.9%), reflecting the local real estate landscape.
- Houses represent a significant 45.1% portion, catering likely to families or larger groups.
Annavascha Airbnb Room Capacity Analysis (2026): Bedroom Distribution
Distribution of Listings by Number of Bedrooms
Room Capacity Insights for Annavascha
- The dominant room capacity in Annavascha is 1 bedroom listings, making up 35.2% of the market. This suggests a strong demand for properties suitable for couples or solo travelers.
- Together, 1 bedroom and 2 bedrooms properties represent 64.8% of the active Airbnb listings in Annavascha, indicating a high concentration in these sizes.
- A significant 28.2% of listings offer 3+ bedrooms, catering to larger groups and families seeking more space in Annavascha.
Annavascha Vacation Rental Guest Capacity Trends (2026)
Distribution of Listings by Guest Capacity
Guest Capacity Insights for Annavascha
- The most common guest capacity trend in Annavascha vacation rentals is listings accommodating 4 guests (33.8%). This suggests the primary traveler segment is likely small families or groups.
- Properties designed for 4 guests and 8+ guests dominate the Annavascha STR market, accounting for 54.9% of listings.
- 42.2% of properties accommodate 6+ guests, serving the market segment for larger families or group travel in Annavascha.
- On average, properties in Annavascha are equipped to host 5.1 guests.
Annavascha Airbnb Booking Patterns (2026): Available vs. Booked Days
Available Days Distribution
Booked Days Distribution
Booking Pattern Insights for Annavascha
- The most common availability pattern in Annavascha falls within the 181-270 days range, representing 45.1% of listings. This suggests many properties have significant open periods on their calendars.
- Approximately 87.4% of listings show high availability (181+ days open annually), indicating potential for increased bookings or specific owner usage patterns.
- For booked days, the 91-180 days range is most frequent in Annavascha (45.1%), reflecting common guest stay durations or potential owner blocking patterns.
- A notable 12.7% of properties secure long booking periods (181+ days booked per year), highlighting successful long-term rental strategies or significant owner usage.
Annavascha Airbnb Minimum Stay Requirements Analysis
Distribution of Listings by Minimum Night Requirement
1 Night
2 listings
2.8% of total
2 Nights
3 listings
4.2% of total
3 Nights
6 listings
8.5% of total
4-6 Nights
17 listings
23.9% of total
7-29 Nights
13 listings
18.3% of total
30+ Nights
30 listings
42.3% of total
Key Insights
- The most prevalent minimum stay requirement in Annavascha is 30+ Nights, adopted by 42.3% of listings. This highlights the market's preference for longer commitments.
- Very short stays (1-2 nights) are less common (7.0%), suggesting hosts prefer slightly longer bookings to optimize turnover.
- A significant segment (42.3%) caters to monthly stays (30+ nights) in Annavascha, pointing to opportunities in the extended-stay market.
Recommendations
- Align with the market by considering a 30+ Nights minimum stay, as 42.3% of Annavascha hosts use this setting.
- If feasible, allowing 1-night stays, especially midweek or during low season, could capture last-minute bookings, as only 2.8% currently do.
- Explore offering discounts for stays of 30+ nights to attract the 42.3% of the market seeking extended stays.
- Adjust minimum nights based on seasonality – potentially shorter during low season and longer during peak demand periods in Annavascha.
Annavascha Airbnb Cancellation Policy Trends Analysis (2026)
Limited
1 listings
1.4% of total
Super Strict 30 Days
16 listings
22.5% of total
Flexible
6 listings
8.5% of total
Moderate
11 listings
15.5% of total
Firm
25 listings
35.2% of total
Strict
12 listings
16.9% of total
Cancellation Policy Insights for Annavascha
- The prevailing Airbnb cancellation policy trend in Annavascha is Firm, used by 35.2% of listings.
- A majority (52.1%) of hosts in Annavascha utilize Firm or Strict policies, indicating a market where hosts prioritize booking security.
Recommendations for Hosts
- Consider adopting a Firm policy to align with the 35.2% market standard in Annavascha.
- Regularly review your cancellation policy against competitors and market demand shifts in Annavascha.
Annavascha STR Booking Lead Time Analysis (2026)
Average Booking Lead Time by Month
Booking Lead Time Insights for Annavascha
- The overall average booking lead time for vacation rentals in Annavascha is 91 days.
- Guests book furthest in advance for stays during August (average 136 days), likely coinciding with peak travel demand or local events.
- The shortest booking windows occur for stays in November (average 39 days), indicating more last-minute travel plans during this time.
- Seasonally, Summer (114 days avg.) sees the longest lead times, while Spring (60 days avg.) has the shortest, reflecting typical travel planning cycles.
Recommendations for Hosts
- Use the overall average lead time (91 days) as a baseline for your pricing and availability strategy in Annavascha.
- For August stays, consider implementing length-of-stay discounts or slightly higher rates for bookings made less than 136 days out to capitalize on advance planning.
- Target marketing efforts for the Summer season well in advance (at least 114 days) to capture early planners.
- Monitor your own booking lead times against these Annavascha averages to identify opportunities for dynamic pricing adjustments.
Popular & Essential Airbnb Amenities in Annavascha (2026)
Amenity Prevalence
Amenity Insights for Annavascha
- Essential amenities in Annavascha that guests expect include: Kitchen. Lacking these (this) could significantly impact bookings.
- Popular amenities like Coffee maker, Dishes and silverware, Microwave are common but not universal. Offering these can provide a competitive edge.
Recommendations for Hosts
- Ensure your listing includes all essential amenities for Annavascha: Kitchen.
- Prioritize adding missing essentials: Kitchen.
- Consider adding popular differentiators like Coffee maker or Dishes and silverware to increase appeal.
- Highlight unique or less common amenities you offer (e.g., hot tub, dedicated workspace, EV charger) in your listing description and photos.
- Regularly check competitor amenities in Annavascha to stay competitive.
Annavascha Airbnb Guest Demographics & Profile Analysis (2026)
Guest Profile Summary for Annavascha
- The typical guest profile for Airbnb in Annavascha consists of primarily domestic travelers (90%), often arriving from nearby Paris, typically belonging to the Post-2000s (Gen Z/Alpha) group (50%), primarily speaking French or English.
- Domestic travelers account for 89.5% of guests.
- Key international markets include France (89.5%) and Italy (3.5%).
- Top languages spoken are French (43.4%) followed by English (34.6%).
- A significant demographic segment is the Post-2000s (Gen Z/Alpha) group, representing 50% of guests.
Recommendations for Hosts
- Target domestic marketing efforts towards travelers from Paris and Lyon.
- Tailor amenities and listing descriptions to appeal to the dominant Post-2000s (Gen Z/Alpha) demographic (e.g., highlight fast WiFi, smart home features, local guides).
- Highlight unique local experiences or amenities relevant to the primary guest profile.
- Consider seasonal promotions aligned with peak travel times for key origin markets.
Nearby Short-Term Rental Market Comparison
How does the Annavascha Airbnb market stack up against its neighbors? Compare key performance metrics like average monthly revenue, ADR, and occupancy rates in surrounding areas to understand the broader regional STR landscape.
| Market | Active Properties | Monthly Revenue | Daily Rate | Avg. Occupancy |
|---|---|---|---|---|
| Niederried bei Interlaken | 19 | $6,267 | $552.03 | 44% |
| Lauterbrunnen | 552 | $6,108 | $487.83 | 51% |
| Matten bei Interlaken | 64 | $5,607 | $336.51 | 59% |
| Les Clefs | 34 | $5,585 | $314.08 | 47% |
| Monteu Roero | 12 | $5,184 | $403.07 | 41% |
| Wengen | 12 | $5,115 | $595.38 | 46% |
| Oberhofen am Thunersee | 25 | $5,051 | $329.28 | 51% |
| Zermatt | 792 | $5,017 | $504.14 | 46% |
| Interlaken | 346 | $4,947 | $399.71 | 53% |
| Bönigen | 35 | $4,848 | $288.51 | 65% |