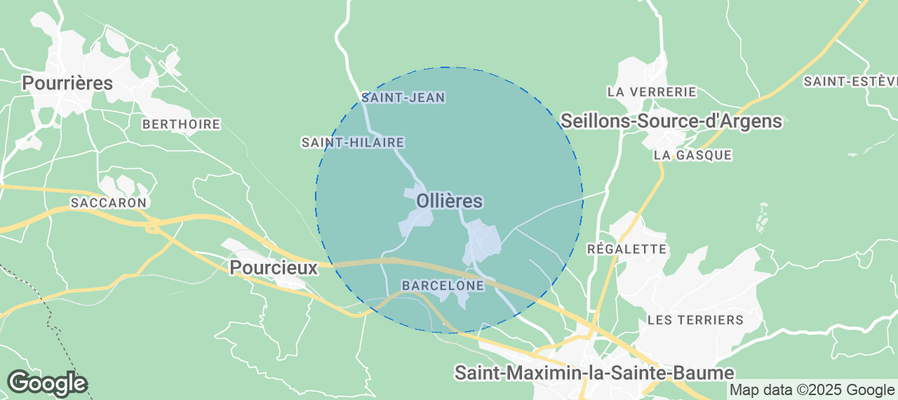
Ollières Airbnb Market Analysis 2026: Short Term Rental Data & Vacation Rental Statistics in Provence-Alpes-Côte d'Azur, France
Is Airbnb profitable in Ollières in 2026? Explore comprehensive Airbnb analytics for Ollières, Provence-Alpes-Côte d'Azur, France to uncover income potential. This 2026 STR market report for Ollières, based on AirROI data from January 2025 to December 2025, reveals key trends in the niche market of 18 active listings.
Whether you're considering an Airbnb investment in Ollières, optimizing your existing vacation rental, or exploring rental arbitrage opportunities, understanding the Ollières Airbnb data is crucial. Navigating the high regulation landscape is key to maximizing your short term rental income potential. Let's dive into the specifics.
Key Ollières Airbnb Performance Metrics Overview
Monthly Airbnb Revenue Variations & Income Potential in Ollières (2026)
Understanding the monthly revenue variations for Airbnb listings in Ollières is key to maximizing your short term rental income potential. Seasonality significantly impacts earnings. Our analysis, based on data from the past 12 months, shows that the peak revenue month for STRs in Ollières is typically August, while November often presents the lowest earnings, highlighting opportunities for strategic pricing adjustments during shoulder and low seasons. Explore the typical Airbnb income in Ollières across different performance tiers:
- Best-in-class properties (Top 10%) achieve $2,099+ monthly, often utilizing dynamic pricing and superior guest experiences.
- Strong performing properties (Top 25%) earn $1,227 or more, indicating effective management and desirable locations/amenities.
- Typical properties (Median) generate around $753 per month, representing the average market performance.
- Entry-level properties (Bottom 25%) see earnings around $385, often with potential for optimization.
Average Monthly Airbnb Earnings Trend in Ollières
Ollières Airbnb Occupancy Rate Trends (2026)
Maximize your bookings by understanding the Ollières STR occupancy trends. Seasonal demand shifts significantly influence how often properties are booked. Typically, Marchsees the highest demand (peak season occupancy), while January experiences the lowest (low season). Effective strategies, like adjusting minimum stays or offering promotions, can boost occupancy during slower periods. Here's how different property tiers perform in Ollières:
- Best-in-class properties (Top 10%) achieve 57%+ occupancy, indicating high desirability and potentially optimized availability.
- Strong performing properties (Top 25%) maintain 42% or higher occupancy, suggesting good market fit and guest satisfaction.
- Typical properties (Median) have an occupancy rate around 21%.
- Entry-level properties (Bottom 25%) average 15% occupancy, potentially facing higher vacancy.
Average Monthly Occupancy Rate Trend in Ollières
Average Daily Rate (ADR) Airbnb Trends in Ollières (2026)
Effective short term rental pricing strategy in Ollières involves understanding monthly ADR fluctuations. The Average Daily Rate (ADR) for Airbnb in Ollières typically peaks in August and dips lowest during February. Leveraging Airbnb dynamic pricing tools or strategies based on this seasonality can significantly boost revenue. Here's a look at the typical nightly rates achieved:
- Best-in-class properties (Top 10%) command rates of $609+ per night, often due to premium features or locations.
- Strong performing properties (Top 25%) achieve nightly rates of $521 or more.
- Typical properties (Median) charge around $130 per night.
- Entry-level properties (Bottom 25%) earn around $83 per night.
Average Daily Rate (ADR) Trend by Month in Ollières
Get Live Ollières Market Intelligence 👇
Explore Real-time Analytics
Airbnb Seasonality Analysis & Trends in Ollières (2025)
Peak Season (August, July, September)
- Revenue averages $3,839 per month
- Occupancy rates average 34.0%
- Daily rates average $308
Shoulder Season
- Revenue averages $1,045 per month
- Occupancy maintains around 30.6%
- Daily rates hold near $287
Low Season (January, April, November)
- Revenue drops to average $453 per month
- Occupancy decreases to average 19.5%
- Daily rates adjust to average $287
Seasonality Insights for Ollières
- The Airbnb seasonality in Ollières shows highly seasonal trends requiring careful strategy. While the sections above show seasonal averages, it's also insightful to look at the extremes:
- During the high season, the absolute peak month showcases Ollières's highest earning potential, with monthly revenues capable of climbing to $4,721, occupancy reaching a high of 45.2%, and ADRs peaking at $320.
- Conversely, the slowest single month of the year, typically falling within the low season, marks the market's lowest point. In this month, revenue might dip to $313, occupancy could drop to 14.5%, and ADRs may adjust down to $272.
- Understanding both the seasonal averages and these monthly peaks and troughs in revenue, occupancy, and ADR is crucial for maximizing your Airbnb profit potential in Ollières.
Seasonal Strategies for Maximizing Profit
- Peak Season: Maximize revenue through premium pricing and potentially longer minimum stays. Ensure high availability.
- Low Season: Offer competitive pricing, special promotions (e.g., extended stay discounts), and flexible cancellation policies. Target off-season travelers like remote workers or budget-conscious guests.
- Shoulder Seasons: Implement dynamic pricing that balances peak and low rates. Target weekend travelers or specific events. Offer slightly more flexible terms than peak season.
- Regularly analyze your own performance against these Ollières seasonality benchmarks and adjust your pricing and availability strategy accordingly.
Best Areas for Airbnb Investment in Ollières (2026)
Exploring the top neighborhoods for short-term rentals in Ollières? This section highlights key areas, outlining why they are attractive for hosts and guests, along with notable local attractions. Consider these locations based on your target guest profile and investment strategy.
| Neighborhood / Area | Why Host Here? (Target Guests & Appeal) | Key Attractions & Landmarks |
|---|---|---|
| Ollières Village | Charming Provençal village known for its picturesque landscapes and serene atmosphere. Ideal for guests looking for a tranquil getaway while exploring the French countryside. | Local vineyards, Nature trails, Historic village center, Nearby lavender fields, Provence-style markets |
| Aix-en-Provence | Famous for its vibrant markets, historic architecture, and cultural scene. A hot spot for tourists seeking art, history, and Provence charm, making it an ideal location for Airbnb hosting. | Cézanne's Studio, Saint-Sauveur Cathedral, Cours Mirabeau, Aix Market, Grand Théâtre de Provence |
| Toulon | A harbor city with rich maritime history and beautiful coastlines. Attracts tourists for sun-soaked beach holidays and cultural experiences, perfect for short-term rentals. | Toulon Harbor, Mont Faron, Beautiful beaches, Museums, Historic forts |
| Cassis | Picturesque coastal town known for its stunning cliffs and crystal-clear waters. Popular among tourists for sailing, beaches, and local seafood cuisine. | Cassis Calanques, Cassis Port, Local wine tasting, Beaches, Hiking trails |
| Les Baux-de-Provence | An enchanting village perched atop a rocky outcrop, known for its historic ruins and breathtaking views. A must-visit for tourists interested in history and medieval architecture. | Château des Baux, Carrières de Lumières, Historic artisan shops, Panoramic viewpoints, Olive groves |
| Saint-Rémy-de-Provence | Birthplace of Nostradamus, this town is famous for its Roman ruins and vibrant markets. Popular with visitors for its artistic heritage and proximity to the Alpilles mountains. | Saint-Paul-de-Mausole, Roman ruins, Weekly markets, Van Gogh's inspirations, Charming cafés |
| Marseille | France's second-largest city, known for its dynamic multicultural atmosphere, historic Vieux Port, and beautiful coastline. Attracting diverse travelers looking for culture and nightlife. | Old Port of Marseille, Notre-Dame de la Garde, Calanques National Park, Château d'If, Marseille's markets |
| Aubagne | A delightful town surrounded by the limestone hills of the Sainte-Baume, famous for its local pottery and craft traditions. A quieter base for exploring the region with an authentic vibe. | Local ceramic shops, Historic town center, Nearby hiking trails, Cultural heritage sites, Provençal markets |
Understanding Airbnb License Requirements & STR Laws in Ollières (2026)
Yes, Ollières, Provence-Alpes-Côte d'Azur, France enforces high STR regulations. Obtaining a license and ensuring compliance is almost certainly required according to current 2026 STR laws. Always verify the latest short term rental regulations and Airbnb license requirements directly with local government authorities for Ollières to ensure full compliance before hosting.
(Source: AirROI data, 2026, based on 44% licensed listings)
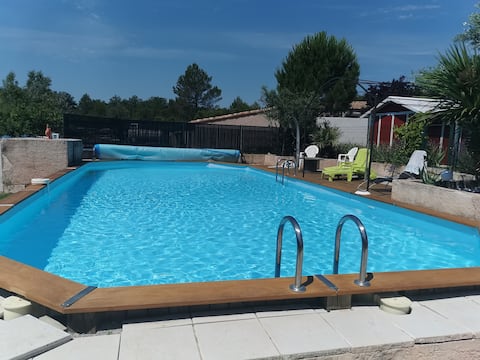
Top Performing Airbnb Properties in Ollières (2026)
Benchmark your potential! Explore examples of top-performing Airbnb properties in Ollièresbased on Trailing Twelve Month (TTM) revenue. Analyze their characteristics, revenue, occupancy rate, and ADR to understand what drives success in this market.
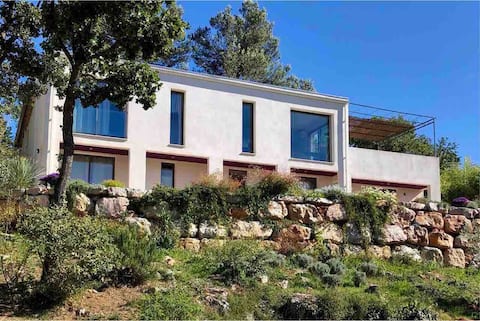
Provence - Luxurious villa for 16 - Swimming pool
Entire Place • 7 bedrooms

Villa
Entire Place • 2 bedrooms
Rental in Provence-Verte
Private Room • 1 bedroom
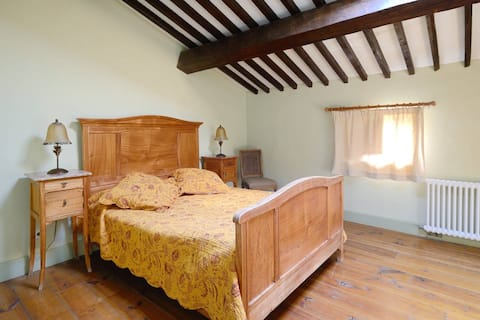
JUJUBE
Entire Place • 4 bedrooms
Chambre
Private Room • N/A
CIBOULETTE
Entire Place • 4 bedrooms
Note: Performance varies based on location, size, amenities, seasonality, and management quality. Data reflects the past 12 months.
Top Performing Airbnb Hosts in Ollières (2026)
Learn from the best! This table showcases top-performing Airbnb hosts in Ollières based on the number of properties managed and estimated total revenue over the past year. Analyze their scale and performance metrics.
| Host Name | Properties | Grossing Revenue | Stay Reviews | Avg Rating |
|---|---|---|---|---|
| Arnaud | 1 | $110,068 | 51 | 4.96/5.0 |
| Les Terres De | 12 | $62,800 | 68 | 4.79/5.0 |
| Nathalie | 3 | $31,281 | 38 | 5.00/5.0 |
| Jean-Pierre | 1 | $10,832 | 154 | 4.85/5.0 |
| Nathalie | 1 | $649 | 3 | 4.67/5.0 |
Analyzing the strategies of top hosts, such as their property selection, pricing, and guest communication, can offer valuable lessons for optimizing your own Airbnb operations in Ollières.
Dive Deeper: Advanced Ollières STR Market Data (2026)
Ready to unlock more insights? AirROI provides access to advanced metrics and comprehensive Airbnb data for Ollières. Explore detailed analytics beyond this report to refine your investment strategy, optimize pricing, and maximize your vacation rental profits.
Explore Advanced MetricsOllières Short-Term Rental Market Composition (2026): Property & Room Types
Room Type Distribution
Property Type Distribution
Market Composition Insights for Ollières
- The Ollières Airbnb market composition is heavily skewed towards Private Room listings, which make up 55.6% of the 18 active rentals. This indicates strong guest preference for privacy and space.
- Looking at the property type distribution in Ollières, Hotel/Boutique properties are the most common (38.9%), reflecting the local real estate landscape.
- Houses represent a significant 27.8% portion, catering likely to families or larger groups.
- The presence of 38.9% Hotel/Boutique listings indicates integration with traditional hospitality.
Ollières Airbnb Room Capacity Analysis (2026): Bedroom Distribution
Distribution of Listings by Number of Bedrooms
Room Capacity Insights for Ollières
- The dominant room capacity in Ollières is 1 bedroom listings, making up 33.3% of the market. This suggests a strong demand for properties suitable for couples or solo travelers.
- Together, 1 bedroom and 2 bedrooms properties represent 50.0% of the active Airbnb listings in Ollières, indicating a high concentration in these sizes.
- A significant 27.8% of listings offer 3+ bedrooms, catering to larger groups and families seeking more space in Ollières.
Ollières Vacation Rental Guest Capacity Trends (2026)
Distribution of Listings by Guest Capacity
Guest Capacity Insights for Ollières
- The most common guest capacity trend in Ollières vacation rentals is listings accommodating 2 guests (22.2%). This suggests the primary traveler segment is likely couples or solo travelers.
- Properties designed for 2 guests and 8+ guests dominate the Ollières STR market, accounting for 44.4% of listings.
- 27.8% of properties accommodate 6+ guests, serving the market segment for larger families or group travel in Ollières.
- On average, properties in Ollières are equipped to host 3.2 guests.
Ollières Airbnb Booking Patterns (2026): Available vs. Booked Days
Available Days Distribution
Booked Days Distribution
Booking Pattern Insights for Ollières
- The most common availability pattern in Ollières falls within the 271-366 days range, representing 77.8% of listings. This suggests many properties have significant open periods on their calendars.
- Approximately 94.5% of listings show high availability (181+ days open annually), indicating potential for increased bookings or specific owner usage patterns.
- For booked days, the 1-30 days range is most frequent in Ollières (38.9%), reflecting common guest stay durations or potential owner blocking patterns.
- A notable 5.6% of properties secure long booking periods (181+ days booked per year), highlighting successful long-term rental strategies or significant owner usage.
Ollières Airbnb Minimum Stay Requirements Analysis
Distribution of Listings by Minimum Night Requirement
1 Night
10 listings
55.6% of total
2 Nights
1 listings
5.6% of total
4-6 Nights
1 listings
5.6% of total
7-29 Nights
1 listings
5.6% of total
30+ Nights
5 listings
27.8% of total
Key Insights
- The most prevalent minimum stay requirement in Ollières is 1 Night, adopted by 55.6% of listings. This highlights the market's preference for shorter, flexible bookings.
- A strong majority (61.2%) of the Ollières Airbnb data shows acceptance of very short stays (1-2 nights), indicating a dynamic, high-turnover market.
- A significant segment (27.8%) caters to monthly stays (30+ nights) in Ollières, pointing to opportunities in the extended-stay market.
Recommendations
- Align with the market by considering a 1 Night minimum stay, as 55.6% of Ollières hosts use this setting.
- Explore offering discounts for stays of 30+ nights to attract the 27.8% of the market seeking extended stays.
- Adjust minimum nights based on seasonality – potentially shorter during low season and longer during peak demand periods in Ollières.
Ollières Airbnb Cancellation Policy Trends Analysis (2026)
Super Strict 30 Days
6 listings
33.3% of total
Flexible
3 listings
16.7% of total
Moderate
7 listings
38.9% of total
Firm
2 listings
11.1% of total
Cancellation Policy Insights for Ollières
- The prevailing Airbnb cancellation policy trend in Ollières is Moderate, used by 38.9% of listings.
- There's a relatively balanced mix between guest-friendly (55.6%) and stricter (11.1%) policies, offering choices for different guest needs.
Recommendations for Hosts
- Consider adopting a Moderate policy to align with the 38.9% market standard in Ollières.
- Regularly review your cancellation policy against competitors and market demand shifts in Ollières.
Ollières STR Booking Lead Time Analysis (2026)
Average Booking Lead Time by Month
Booking Lead Time Insights for Ollières
- The overall average booking lead time for vacation rentals in Ollières is 75 days.
- Guests book furthest in advance for stays during May (average 176 days), likely coinciding with peak travel demand or local events.
- The shortest booking windows occur for stays in November (average 19 days), indicating more last-minute travel plans during this time.
- Seasonally, Summer (107 days avg.) sees the longest lead times, while Winter (44 days avg.) has the shortest, reflecting typical travel planning cycles.
Recommendations for Hosts
- Use the overall average lead time (75 days) as a baseline for your pricing and availability strategy in Ollières.
- For May stays, consider implementing length-of-stay discounts or slightly higher rates for bookings made less than 176 days out to capitalize on advance planning.
- Target marketing efforts for the Summer season well in advance (at least 107 days) to capture early planners.
- Monitor your own booking lead times against these Ollières averages to identify opportunities for dynamic pricing adjustments.
Popular & Essential Airbnb Amenities in Ollières (2026)
Amenity Prevalence
Amenity Insights for Ollières
- Essential amenities in Ollières that guests expect include: Smoke alarm, Iron, TV, Wifi, Free parking on premises. Lacking these (any) could significantly impact bookings.
- Popular amenities like Hangers, Heating, Coffee maker are common but not universal. Offering these can provide a competitive edge.
Recommendations for Hosts
- Ensure your listing includes all essential amenities for Ollières: Smoke alarm, Iron, TV, Wifi, Free parking on premises.
- Consider adding popular differentiators like Hangers or Heating to increase appeal.
- Highlight unique or less common amenities you offer (e.g., hot tub, dedicated workspace, EV charger) in your listing description and photos.
- Regularly check competitor amenities in Ollières to stay competitive.
Ollières Airbnb Guest Demographics & Profile Analysis (2026)
Guest Profile Summary for Ollières
- The typical guest profile for Airbnb in Ollières consists of primarily domestic travelers (83%), often arriving from nearby Lightwater, typically belonging to the Post-2000s (Gen Z/Alpha) group (50%), primarily speaking French or English.
- Domestic travelers account for 82.6% of guests.
- Key international markets include France (82.6%) and Belgium (8.7%).
- Top languages spoken are French (41.2%) followed by English (29.4%).
- A significant demographic segment is the Post-2000s (Gen Z/Alpha) group, representing 50% of guests.
Recommendations for Hosts
- Target domestic marketing efforts towards travelers from Lightwater and Frontonas.
- Tailor amenities and listing descriptions to appeal to the dominant Post-2000s (Gen Z/Alpha) demographic (e.g., highlight fast WiFi, smart home features, local guides).
- Highlight unique local experiences or amenities relevant to the primary guest profile.
- Consider seasonal promotions aligned with peak travel times for key origin markets.
Nearby Short-Term Rental Market Comparison
How does the Ollières Airbnb market stack up against its neighbors? Compare key performance metrics like average monthly revenue, ADR, and occupancy rates in surrounding areas to understand the broader regional STR landscape.
| Market | Active Properties | Monthly Revenue | Daily Rate | Avg. Occupancy |
|---|---|---|---|---|
| Ramatuelle | 225 | $3,977 | $644.68 | 39% |
| Saint-Tropez | 807 | $3,635 | $513.55 | 39% |
| Eygalières | 84 | $3,457 | $457.46 | 40% |
| Cavillargues | 12 | $3,429 | $342.91 | 43% |
| Puget | 31 | $3,248 | $352.07 | 42% |
| Gordes | 245 | $3,217 | $403.41 | 41% |
| Goult | 86 | $3,110 | $345.88 | 44% |
| Ménerbes | 92 | $3,032 | $384.92 | 45% |
| Suzette | 12 | $2,982 | $414.50 | 38% |
| Divajeu | 21 | $2,945 | $414.03 | 34% |