Monte Sant'Angelo Airbnb Market Analysis 2026: Short Term Rental Data & Vacation Rental Statistics in Apulia, Italy
Is Airbnb profitable in Monte Sant'Angelo in 2026? Explore comprehensive Airbnb analytics for Monte Sant'Angelo, Apulia, Italy to uncover income potential. This 2026 STR market report for Monte Sant'Angelo, based on AirROI data from February 2025 to January 2026, reveals key trends in the niche market of 66 active listings.
Whether you're considering an Airbnb investment in Monte Sant'Angelo, optimizing your existing vacation rental, or exploring rental arbitrage opportunities, understanding the Monte Sant'Angelo Airbnb data is crucial. Navigating the high regulation landscape is key to maximizing your short term rental income potential. Let's dive into the specifics.
Key Monte Sant'Angelo Airbnb Performance Metrics Overview
Monthly Airbnb Revenue Variations & Income Potential in Monte Sant'Angelo (2026)
Understanding the monthly revenue variations for Airbnb listings in Monte Sant'Angelo is key to maximizing your short term rental income potential. Seasonality significantly impacts earnings. Our analysis, based on data from the past 12 months, shows that the peak revenue month for STRs in Monte Sant'Angelo is typically August, while January often presents the lowest earnings, highlighting opportunities for strategic pricing adjustments during shoulder and low seasons. Explore the typical Airbnb income in Monte Sant'Angelo across different performance tiers:
- Best-in-class properties (Top 10%) achieve $2,839+ monthly, often utilizing dynamic pricing and superior guest experiences.
- Strong performing properties (Top 25%) earn $1,673 or more, indicating effective management and desirable locations/amenities.
- Typical properties (Median) generate around $802 per month, representing the average market performance.
- Entry-level properties (Bottom 25%) see earnings around $369, often with potential for optimization.
Average Monthly Airbnb Earnings Trend in Monte Sant'Angelo
Monte Sant'Angelo Airbnb Occupancy Rate Trends (2026)
Maximize your bookings by understanding the Monte Sant'Angelo STR occupancy trends. Seasonal demand shifts significantly influence how often properties are booked. Typically, Augustsees the highest demand (peak season occupancy), while January experiences the lowest (low season). Effective strategies, like adjusting minimum stays or offering promotions, can boost occupancy during slower periods. Here's how different property tiers perform in Monte Sant'Angelo:
- Best-in-class properties (Top 10%) achieve 62%+ occupancy, indicating high desirability and potentially optimized availability.
- Strong performing properties (Top 25%) maintain 45% or higher occupancy, suggesting good market fit and guest satisfaction.
- Typical properties (Median) have an occupancy rate around 27%.
- Entry-level properties (Bottom 25%) average 12% occupancy, potentially facing higher vacancy.
Average Monthly Occupancy Rate Trend in Monte Sant'Angelo
Average Daily Rate (ADR) Airbnb Trends in Monte Sant'Angelo (2026)
Effective short term rental pricing strategy in Monte Sant'Angelo involves understanding monthly ADR fluctuations. The Average Daily Rate (ADR) for Airbnb in Monte Sant'Angelo typically peaks in August and dips lowest during November. Leveraging Airbnb dynamic pricing tools or strategies based on this seasonality can significantly boost revenue. Here's a look at the typical nightly rates achieved:
- Best-in-class properties (Top 10%) command rates of $203+ per night, often due to premium features or locations.
- Strong performing properties (Top 25%) achieve nightly rates of $138 or more.
- Typical properties (Median) charge around $102 per night.
- Entry-level properties (Bottom 25%) earn around $74 per night.
Average Daily Rate (ADR) Trend by Month in Monte Sant'Angelo
Get Live Monte Sant'Angelo Market Intelligence 👇

Explore Real-time Analytics
Airbnb Seasonality Analysis & Trends in Monte Sant'Angelo (2026)
Peak Season (August, July, June)
- Revenue averages $2,318 per month
- Occupancy rates average 44.0%
- Daily rates average $136
Shoulder Season
- Revenue averages $1,070 per month
- Occupancy maintains around 29.3%
- Daily rates hold near $118
Low Season (January, February, December)
- Revenue drops to average $606 per month
- Occupancy decreases to average 20.0%
- Daily rates adjust to average $117
Seasonality Insights for Monte Sant'Angelo
- The Airbnb seasonality in Monte Sant'Angelo shows highly seasonal trends requiring careful strategy. While the sections above show seasonal averages, it's also insightful to look at the extremes:
- During the high season, the absolute peak month showcases Monte Sant'Angelo's highest earning potential, with monthly revenues capable of climbing to $3,048, occupancy reaching a high of 55.9%, and ADRs peaking at $147.
- Conversely, the slowest single month of the year, typically falling within the low season, marks the market's lowest point. In this month, revenue might dip to $444, occupancy could drop to 14.5%, and ADRs may adjust down to $111.
- Understanding both the seasonal averages and these monthly peaks and troughs in revenue, occupancy, and ADR is crucial for maximizing your Airbnb profit potential in Monte Sant'Angelo.
Seasonal Strategies for Maximizing Profit
- Peak Season: Maximize revenue through premium pricing and potentially longer minimum stays. Ensure high availability.
- Low Season: Offer competitive pricing, special promotions (e.g., extended stay discounts), and flexible cancellation policies. Target off-season travelers like remote workers or budget-conscious guests.
- Shoulder Seasons: Implement dynamic pricing that balances peak and low rates. Target weekend travelers or specific events. Offer slightly more flexible terms than peak season.
- Regularly analyze your own performance against these Monte Sant'Angelo seasonality benchmarks and adjust your pricing and availability strategy accordingly.
Best Areas for Airbnb Investment in Monte Sant'Angelo (2026)
Exploring the top neighborhoods for short-term rentals in Monte Sant'Angelo? This section highlights key areas, outlining why they are attractive for hosts and guests, along with notable local attractions. Consider these locations based on your target guest profile and investment strategy.
| Neighborhood / Area | Why Host Here? (Target Guests & Appeal) | Key Attractions & Landmarks |
|---|---|---|
| Historic Center | The heart of Monte Sant'Angelo, famous for its medieval architecture and rich history. A prime spot for tourists visiting the Sanctuary of Monte Sant'Angelo and exploring ancient streets. | Sanctuary of Monte Sant'Angelo, Castle of Monte Sant'Angelo, Via dei Pellegrini, Church of Santa Maria Maggiore, Piazza della Libertà, Archaeological Park of Monte Sant'Angelo |
| Sanctuary Neighborhood | Close to the famous pilgrimage site, this area attracts religious tourists and those interested in history and spirituality, providing a peaceful environment. | Sanctuary of Monte Sant'Angelo, Chiesa di San Giovanni, Pilgrimage routes, Local artisan shops, Cafés and eateries |
| Nature Trails | Surrounding the town, these trails are ideal for outdoor enthusiasts, hikers, and nature lovers, making it a great spot for eco-tourism. | Gargano National Park, Hiking Trails, Scenic viewpoints, Flora and fauna diversity, Picnic areas |
| Rural Monte Sant'Angelo | This area offers a rural experience with traditional Apulian charm, perfect for guests looking to escape the city and enjoy countryside living. | Traditional masserie, Olive groves, Local farms, Hiking opportunities, Local cuisine experiences |
| Cultural District | Home to local artisans and cultural events, ideal for visitors interested in the local culture and arts scene, including workshops and festivals. | Local craft shops, Art galleries, Music festivals, Cultural events, Food fairs |
| Coastal Access | Close to the coast, providing easy access for day trips to the beaches of the Gargano coast, popular with families and beachgoers. | Peschici Beaches, Vieste Beaches, Boat tours, Water sports activities, Coastal restaurants |
| Gastronomy Hub | Known for its delicious local cuisine, this area attracts food lovers and those looking for authentic Apulian culinary experiences. | Local trattorias, Food markets, Wine tasting, Cooking classes, Food festivals |
| Wellness Retreats | A peaceful area ideal for wellness tourism with spas and retreats, attracting guests interested in relaxation and health-oriented activities. | Spas and wellness centers, Yoga retreats, Meditation areas, Nature immersion programs, Health workshops |
Understanding Airbnb License Requirements & STR Laws in Monte Sant'Angelo (2026)
Yes, Monte Sant'Angelo, Apulia, Italy enforces high STR regulations. Obtaining a license and ensuring compliance is almost certainly required according to current 2026 STR laws. Always verify the latest short term rental regulations and Airbnb license requirements directly with local government authorities for Monte Sant'Angelo to ensure full compliance before hosting.
(Source: AirROI data, 2026, based on 92% licensed listings)
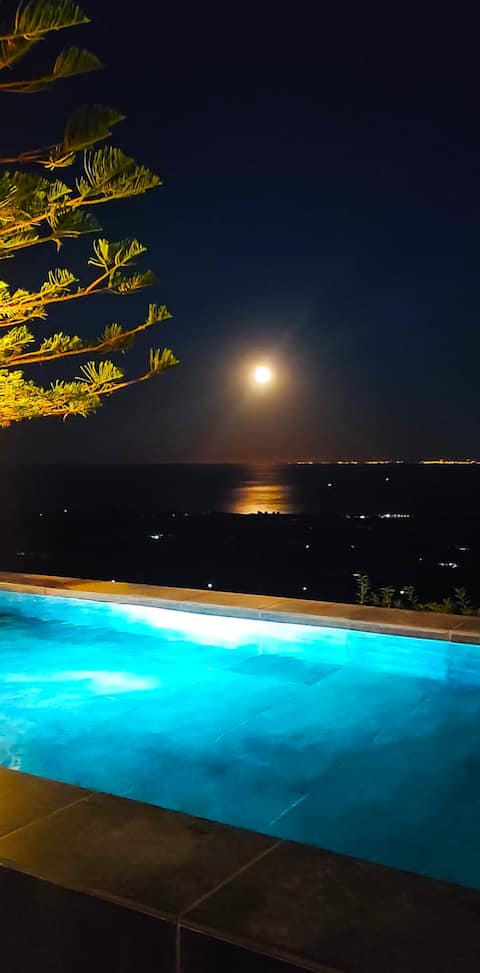
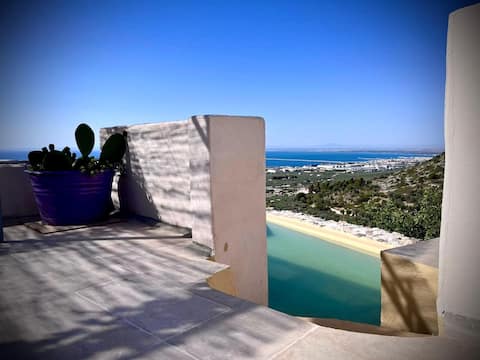
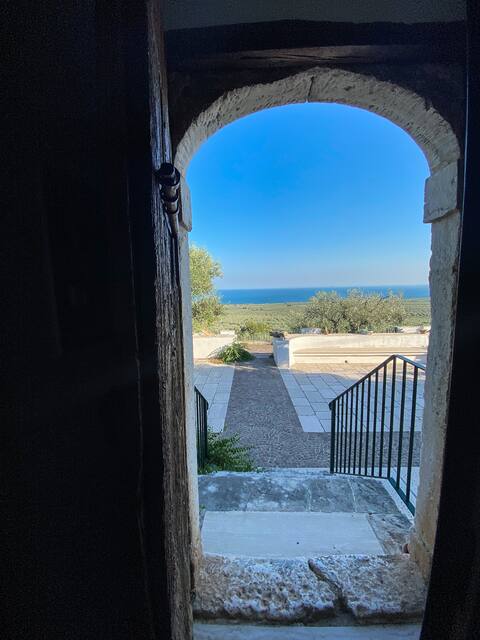
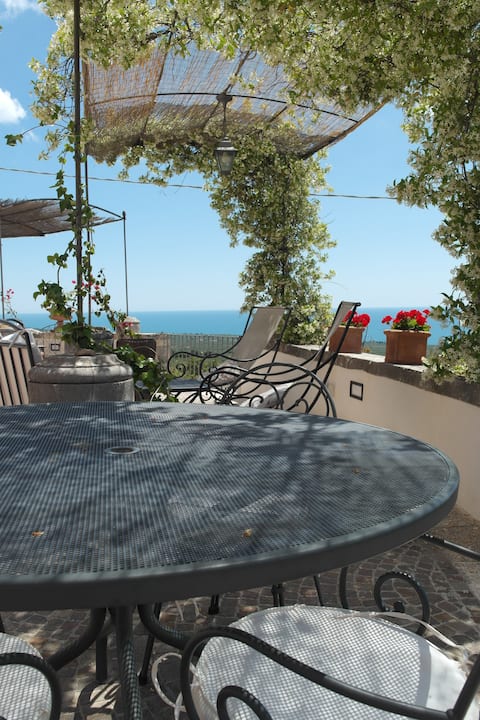
Top Performing Airbnb Properties in Monte Sant'Angelo (2026)
Benchmark your potential! Explore examples of top-performing Airbnb properties in Monte Sant'Angelobased on Trailing Twelve Month (TTM) revenue. Analyze their characteristics, revenue, occupancy rate, and ADR to understand what drives success in this market.

CHARMING PUGLIA VILLA SIMONE
Entire Place • 8 bedrooms
Villa Francesca
Entire Place • 3 bedrooms
The Villa Francesca-Manfredi Home & Villa annex
Entire Place • 2 bedrooms
The Gargano Puglia Barn IT071033C200072765
Entire Place • 2 bedrooms
VILLA BASSO Gargano - La Terrazza Apartment, sea view
Entire Place • 1 bedroom
VILLA BASSO Gargano - Roxane elegant, sea view
Entire Place • 2 bedrooms
Note: Performance varies based on location, size, amenities, seasonality, and management quality. Data reflects the past 12 months.
Top Performing Airbnb Hosts in Monte Sant'Angelo (2026)
Learn from the best! This table showcases top-performing Airbnb hosts in Monte Sant'Angelo based on the number of properties managed and estimated total revenue over the past year. Analyze their scale and performance metrics.
| Host Name | Properties | Grossing Revenue | Stay Reviews | Avg Rating |
|---|---|---|---|---|
| Michele | 3 | $92,537 | 115 | 4.93/5.0 |
| Apulia Manfredi Homes&Villas | 5 | $87,240 | 118 | 4.58/5.0 |
| Maria Grazia | 3 | $77,203 | 140 | 4.94/5.0 |
| Massimo | 2 | $64,446 | 17 | 4.05/5.0 |
| Affitti Brevi Italia Agenzia G | 11 | $40,618 | 38 | 3.58/5.0 |
| Lucilla | 1 | $33,327 | 41 | 4.95/5.0 |
| Colomba | 2 | $30,222 | 422 | 4.63/5.0 |
| Antonella | 3 | $25,498 | 38 | 5.00/5.0 |
| Leonardo | 1 | $20,387 | 18 | 5.00/5.0 |
| Angela | 1 | $20,043 | 22 | 4.73/5.0 |
Analyzing the strategies of top hosts, such as their property selection, pricing, and guest communication, can offer valuable lessons for optimizing your own Airbnb operations in Monte Sant'Angelo.
Dive Deeper: Advanced Monte Sant'Angelo STR Market Data (2026)
Ready to unlock more insights? AirROI provides access to advanced metrics and comprehensive Airbnb data for Monte Sant'Angelo. Explore detailed analytics beyond this report to refine your investment strategy, optimize pricing, and maximize your vacation rental profits.
Explore Advanced MetricsMonte Sant'Angelo Short-Term Rental Market Composition (2026): Property & Room Types
Room Type Distribution
Property Type Distribution
Market Composition Insights for Monte Sant'Angelo
- The Monte Sant'Angelo Airbnb market composition is heavily skewed towards Entire Home/Apt listings, which make up 83.3% of the 66 active rentals. This indicates strong guest preference for privacy and space.
- Looking at the property type distribution in Monte Sant'Angelo, House properties are the most common (63.6%), reflecting the local real estate landscape.
- Houses represent a significant 63.6% portion, catering likely to families or larger groups.
- The presence of 6.1% Hotel/Boutique listings indicates integration with traditional hospitality.
- Smaller segments like outdoor/unique, unique stays (combined 7.5%) offer potential for unique stay experiences.
Monte Sant'Angelo Airbnb Room Capacity Analysis (2026): Bedroom Distribution
Distribution of Listings by Number of Bedrooms
Room Capacity Insights for Monte Sant'Angelo
- The dominant room capacity in Monte Sant'Angelo is 1 bedroom listings, making up 40.9% of the market. This suggests a strong demand for properties suitable for couples or solo travelers.
- Together, 1 bedroom and 2 bedrooms properties represent 72.7% of the active Airbnb listings in Monte Sant'Angelo, indicating a high concentration in these sizes.
Monte Sant'Angelo Vacation Rental Guest Capacity Trends (2026)
Distribution of Listings by Guest Capacity
Guest Capacity Insights for Monte Sant'Angelo
- The most common guest capacity trend in Monte Sant'Angelo vacation rentals is listings accommodating 4 guests (37.9%). This suggests the primary traveler segment is likely small families or groups.
- Properties designed for 4 guests and 2 guests dominate the Monte Sant'Angelo STR market, accounting for 53.1% of listings.
- 18.2% of properties accommodate 6+ guests, serving the market segment for larger families or group travel in Monte Sant'Angelo.
- On average, properties in Monte Sant'Angelo are equipped to host 3.9 guests.
Monte Sant'Angelo Airbnb Booking Patterns (2026): Available vs. Booked Days
Available Days Distribution
Booked Days Distribution
Booking Pattern Insights for Monte Sant'Angelo
- The most common availability pattern in Monte Sant'Angelo falls within the 271-366 days range, representing 72.7% of listings. This suggests many properties have significant open periods on their calendars.
- Approximately 95.4% of listings show high availability (181+ days open annually), indicating potential for increased bookings or specific owner usage patterns.
- For booked days, the 31-90 days range is most frequent in Monte Sant'Angelo (40.9%), reflecting common guest stay durations or potential owner blocking patterns.
- A notable 4.5% of properties secure long booking periods (181+ days booked per year), highlighting successful long-term rental strategies or significant owner usage.
Monte Sant'Angelo Airbnb Minimum Stay Requirements Analysis
Distribution of Listings by Minimum Night Requirement
1 Night
11 listings
16.7% of total
2 Nights
3 listings
4.5% of total
3 Nights
3 listings
4.5% of total
4-6 Nights
8 listings
12.1% of total
7-29 Nights
8 listings
12.1% of total
30+ Nights
33 listings
50% of total
Key Insights
- The most prevalent minimum stay requirement in Monte Sant'Angelo is 30+ Nights, adopted by 50% of listings. This highlights the market's preference for longer commitments.
- A significant segment (50%) caters to monthly stays (30+ nights) in Monte Sant'Angelo, pointing to opportunities in the extended-stay market.
Recommendations
- Align with the market by considering a 30+ Nights minimum stay, as 50% of Monte Sant'Angelo hosts use this setting.
- If feasible, allowing 1-night stays, especially midweek or during low season, could capture last-minute bookings, as only 16.7% currently do.
- Explore offering discounts for stays of 30+ nights to attract the 50% of the market seeking extended stays.
- Adjust minimum nights based on seasonality – potentially shorter during low season and longer during peak demand periods in Monte Sant'Angelo.
Monte Sant'Angelo Airbnb Cancellation Policy Trends Analysis (2026)
Limited
1 listings
1.5% of total
Flexible
15 listings
22.7% of total
Moderate
31 listings
47% of total
Firm
17 listings
25.8% of total
Strict
2 listings
3% of total
Cancellation Policy Insights for Monte Sant'Angelo
- The prevailing Airbnb cancellation policy trend in Monte Sant'Angelo is Moderate, used by 47% of listings.
- There's a relatively balanced mix between guest-friendly (69.7%) and stricter (28.8%) policies, offering choices for different guest needs.
- Strict cancellation policies are quite rare (3%), potentially making listings with this policy less competitive unless justified by high demand or property type.
Recommendations for Hosts
- Consider adopting a Moderate policy to align with the 47% market standard in Monte Sant'Angelo.
- Using a Strict policy might deter some guests, as only 3% of listings use it. Evaluate if potential revenue protection outweighs possible lower booking rates.
- Regularly review your cancellation policy against competitors and market demand shifts in Monte Sant'Angelo.
Monte Sant'Angelo STR Booking Lead Time Analysis (2026)
Average Booking Lead Time by Month
Booking Lead Time Insights for Monte Sant'Angelo
- The overall average booking lead time for vacation rentals in Monte Sant'Angelo is 50 days.
- Guests book furthest in advance for stays during August (average 73 days), likely coinciding with peak travel demand or local events.
- The shortest booking windows occur for stays in February (average 22 days), indicating more last-minute travel plans during this time.
- Seasonally, Summer (66 days avg.) sees the longest lead times, while Winter (35 days avg.) has the shortest, reflecting typical travel planning cycles.
Recommendations for Hosts
- Use the overall average lead time (50 days) as a baseline for your pricing and availability strategy in Monte Sant'Angelo.
- For August stays, consider implementing length-of-stay discounts or slightly higher rates for bookings made less than 73 days out to capitalize on advance planning.
- Target marketing efforts for the Summer season well in advance (at least 66 days) to capture early planners.
- Monitor your own booking lead times against these Monte Sant'Angelo averages to identify opportunities for dynamic pricing adjustments.
Popular & Essential Airbnb Amenities in Monte Sant'Angelo (2026)
Amenity Prevalence
Amenity Insights for Monte Sant'Angelo
- Popular amenities like Kitchen, Free parking on premises, Hot water are common but not universal. Offering these can provide a competitive edge.
- Warning: Wifi is not universally provided but is considered essential globally. Ensure reliable Wifi is offered.
Recommendations for Hosts
- Consider adding popular differentiators like Kitchen or Free parking on premises to increase appeal.
- Highlight unique or less common amenities you offer (e.g., hot tub, dedicated workspace, EV charger) in your listing description and photos.
- Regularly check competitor amenities in Monte Sant'Angelo to stay competitive.
Monte Sant'Angelo Airbnb Guest Demographics & Profile Analysis (2026)
Guest Profile Summary for Monte Sant'Angelo
- The typical guest profile for Airbnb in Monte Sant'Angelo consists of predominantly international visitors (78%), with top international origins including Italy, typically belonging to the Post-2000s (Gen Z/Alpha) group (50%), primarily speaking English or French.
- Domestic travelers account for 21.9% of guests.
- Key international markets include France (26.3%) and Italy (21.9%).
- Top languages spoken are English (36.2%) followed by French (17.6%).
- A significant demographic segment is the Post-2000s (Gen Z/Alpha) group, representing 50% of guests.
Recommendations for Hosts
- Focus marketing internationally, particularly towards travelers from Italy.
- Tailor amenities and listing descriptions to appeal to the dominant Post-2000s (Gen Z/Alpha) demographic (e.g., highlight fast WiFi, smart home features, local guides).
- Highlight unique local experiences or amenities relevant to the primary guest profile.
- Consider seasonal promotions aligned with peak travel times for key origin markets.
Nearby Short-Term Rental Market Comparison
How does the Monte Sant'Angelo Airbnb market stack up against its neighbors? Compare key performance metrics like average monthly revenue, ADR, and occupancy rates in surrounding areas to understand the broader regional STR landscape.
| Market | Active Properties | Monthly Revenue | Daily Rate | Avg. Occupancy |
|---|---|---|---|---|
| Positano | 740 | $6,727 | $653.26 | 52% |
| Praiano | 365 | $4,340 | $447.02 | 50% |
| Capri | 424 | $3,912 | $586.24 | 37% |
| Conca dei Marini | 132 | $3,899 | $417.87 | 45% |
| Sorrento | 1,606 | $3,821 | $344.29 | 48% |
| Massa Lubrense | 813 | $3,392 | $408.38 | 42% |
| Furore | 149 | $3,226 | $353.64 | 52% |
| Amalfi | 506 | $3,135 | $319.20 | 45% |
| Ravello | 256 | $3,119 | $333.17 | 42% |
| Atrani | 130 | $2,702 | $224.39 | 50% |