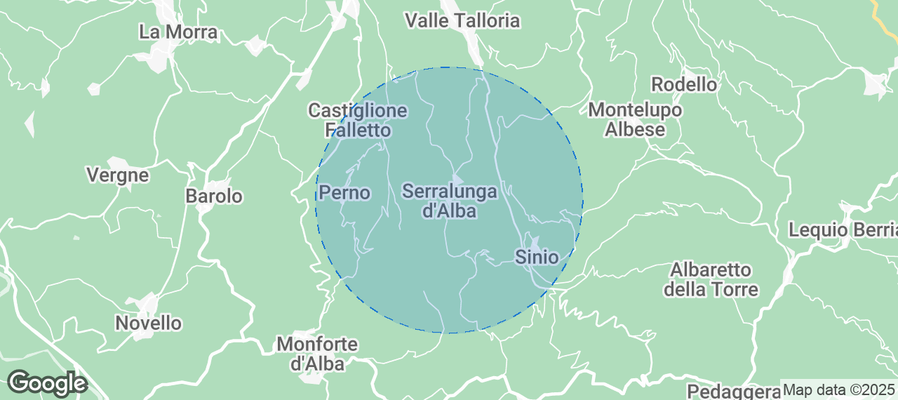
Serralunga d'Alba Airbnb Market Analysis 2025: Short Term Rental Data & Vacation Rental Statistics in Piedmont, Italy
Is Airbnb profitable in Serralunga d'Alba in 2025? Explore comprehensive Airbnb analytics for Serralunga d'Alba, Piedmont, Italy to uncover income potential. This 2025 STR market report for Serralunga d'Alba, based on AirROI data from October 2024 to September 2025, reveals key trends in the niche market of 18 active listings.
Whether you're considering an Airbnb investment in Serralunga d'Alba, optimizing your existing vacation rental, or exploring rental arbitrage opportunities, understanding the Serralunga d'Alba Airbnb data is crucial. Navigating the high regulation landscape is key to maximizing your short term rental income potential. Let's dive into the specifics.
Key Serralunga d'Alba Airbnb Performance Metrics Overview
Monthly Airbnb Revenue Variations & Income Potential in Serralunga d'Alba (2025)
Understanding the monthly revenue variations for Airbnb listings in Serralunga d'Alba is key to maximizing your short term rental income potential. Seasonality significantly impacts earnings. Our analysis, based on data from the past 12 months, shows that the peak revenue month for STRs in Serralunga d'Alba is typically December, while February often presents the lowest earnings, highlighting opportunities for strategic pricing adjustments during shoulder and low seasons. Explore the typical Airbnb income in Serralunga d'Alba across different performance tiers:
- Best-in-class properties (Top 10%) achieve $5,902+ monthly, often utilizing dynamic pricing and superior guest experiences.
- Strong performing properties (Top 25%) earn $2,932 or more, indicating effective management and desirable locations/amenities.
- Typical properties (Median) generate around $1,315 per month, representing the average market performance.
- Entry-level properties (Bottom 25%) see earnings around $665, often with potential for optimization.
Average Monthly Airbnb Earnings Trend in Serralunga d'Alba
Serralunga d'Alba Airbnb Occupancy Rate Trends (2025)
Maximize your bookings by understanding the Serralunga d'Alba STR occupancy trends. Seasonal demand shifts significantly influence how often properties are booked. Typically, Octobersees the highest demand (peak season occupancy), while January experiences the lowest (low season). Effective strategies, like adjusting minimum stays or offering promotions, can boost occupancy during slower periods. Here's how different property tiers perform in Serralunga d'Alba:
- Best-in-class properties (Top 10%) achieve 64%+ occupancy, indicating high desirability and potentially optimized availability.
- Strong performing properties (Top 25%) maintain 50% or higher occupancy, suggesting good market fit and guest satisfaction.
- Typical properties (Median) have an occupancy rate around 28%.
- Entry-level properties (Bottom 25%) average 13% occupancy, potentially facing higher vacancy.
Average Monthly Occupancy Rate Trend in Serralunga d'Alba
Average Daily Rate (ADR) Airbnb Trends in Serralunga d'Alba (2025)
Effective short term rental pricing strategy in Serralunga d'Alba involves understanding monthly ADR fluctuations. The Average Daily Rate (ADR) for Airbnb in Serralunga d'Alba typically peaks in September and dips lowest during March. Leveraging Airbnb dynamic pricing tools or strategies based on this seasonality can significantly boost revenue. Here's a look at the typical nightly rates achieved:
- Best-in-class properties (Top 10%) command rates of $461+ per night, often due to premium features or locations.
- Strong performing properties (Top 25%) achieve nightly rates of $189 or more.
- Typical properties (Median) charge around $145 per night.
- Entry-level properties (Bottom 25%) earn around $121 per night.
Average Daily Rate (ADR) Trend by Month in Serralunga d'Alba
Get Live Serralunga d'Alba Market Intelligence 👇
Explore Real-time Analytics
Airbnb Seasonality Analysis & Trends in Serralunga d'Alba (2025)
Peak Season (December, October, November)
- Revenue averages $3,326 per month
- Occupancy rates average 40.1%
- Daily rates average $188
Shoulder Season
- Revenue averages $2,479 per month
- Occupancy maintains around 28.7%
- Daily rates hold near $202
Low Season (February, August, September)
- Revenue drops to average $1,972 per month
- Occupancy decreases to average 32.1%
- Daily rates adjust to average $217
Seasonality Insights for Serralunga d'Alba
- The Airbnb seasonality in Serralunga d'Alba shows highly seasonal trends requiring careful strategy. While the sections above show seasonal averages, it's also insightful to look at the extremes:
- During the high season, the absolute peak month showcases Serralunga d'Alba's highest earning potential, with monthly revenues capable of climbing to $3,962, occupancy reaching a high of 44.0%, and ADRs peaking at $237.
- Conversely, the slowest single month of the year, typically falling within the low season, marks the market's lowest point. In this month, revenue might dip to $1,919, occupancy could drop to 18.9%, and ADRs may adjust down to $179.
- Understanding both the seasonal averages and these monthly peaks and troughs in revenue, occupancy, and ADR is crucial for maximizing your Airbnb profit potential in Serralunga d'Alba.
Seasonal Strategies for Maximizing Profit
- Peak Season: Maximize revenue through premium pricing and potentially longer minimum stays. Ensure high availability.
- Low Season: Offer competitive pricing, special promotions (e.g., extended stay discounts), and flexible cancellation policies. Target off-season travelers like remote workers or budget-conscious guests.
- Shoulder Seasons: Implement dynamic pricing that balances peak and low rates. Target weekend travelers or specific events. Offer slightly more flexible terms than peak season.
- Regularly analyze your own performance against these Serralunga d'Alba seasonality benchmarks and adjust your pricing and availability strategy accordingly.
Best Areas for Airbnb Investment in Serralunga d'Alba (2025)
Exploring the top neighborhoods for short-term rentals in Serralunga d'Alba? This section highlights key areas, outlining why they are attractive for hosts and guests, along with notable local attractions. Consider these locations based on your target guest profile and investment strategy.
| Neighborhood / Area | Why Host Here? (Target Guests & Appeal) | Key Attractions & Landmarks |
|---|---|---|
| Centro Storico | The historical center of Serralunga d'Alba is known for its charming architecture, narrow streets, and proximity to local wineries. It's a prime area for tourists seeking a cultural experience and easy access to local attractions. | Castello di Serralunga d'Alba, Wine Cellars, Local Restaurants, Cultural Festivals, Vineyard Tours |
| Vineyards Surroundings | The scenic vineyards surrounding Serralunga d'Alba are perfect for wine enthusiasts and nature lovers. This area offers peaceful retreats with stunning views and is ideal for those looking to escape the city bustle. | Barolo Wine Region, Vineyard Walks, Picnic Areas, Wine Tasting Experiences, Local Farmers Markets |
| Castello di Cerviano | Located near Serralunga d'Alba, this area features beautiful landscapes and historic sites. It's a great choice for Airbnb hosting due to its unique appeal to both history buffs and nature lovers. | Castello di Cerviano, Hiking Trails, Agriturismo Experiences, Local Artisans, Historic Tours |
| Local Wineries | This area includes renowned wineries that attract visitors from all over the world. It's ideal for hosting guests who want to explore wine culture and participate in wine tastings. | Vigna Rionda, Giovanni Rosso, Domenico Clerico Tasting Room, Wine Tours, Winery Workshops |
| Nature Trails | The nature trails around Serralunga offer beautiful hikes and are well-suited for tourists who enjoy outdoor activities. This area attracts hikers and nature lovers. | Panoramic Hiking Trails, Nature Reserves, Bird Watching Spots, Cycling Paths, Scenic Viewpoints |
| Gastronomy Hub | Serralunga d'Alba is known for its culinary offerings, including truffles and local cuisine. This area can attract food lovers who want to indulge in local delicacies. | Truffle Markets, Cooking Classes, Local Trattorias, Food Festivals, Gastronomic Tours |
| Local Markets | The local markets in and around Serralunga are vibrant and offer a taste of the region's culture. Tourists love to explore markets for local products and crafts. | Weekly Farmers Markets, Artisan Stalls, Local Crafts, Seasonal Produce, Cultural Events |
| Cultural Festivals | Serralunga hosts various cultural festivals throughout the year, making it an attractive destination for tourists interested in cultural experiences and local traditions. | Wine Festivals, Culinary Festivals, Music Festivals, Art Exhibitions, Local Celebrations |
Understanding Airbnb License Requirements & STR Laws in Serralunga d'Alba (2025)
Yes, Serralunga d'Alba, Piedmont, Italy enforces high STR regulations. Obtaining a license and ensuring compliance is almost certainly required according to current 2025 STR laws. Always verify the latest short term rental regulations and Airbnb license requirements directly with local government authorities for Serralunga d'Alba to ensure full compliance before hosting.
(Source: AirROI data, 2025, based on 72% licensed listings)
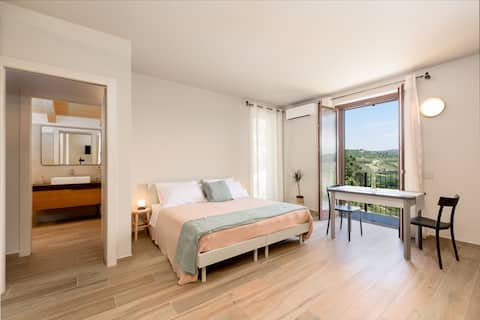
Top Performing Airbnb Properties in Serralunga d'Alba (2025)
Benchmark your potential! Explore examples of top-performing Airbnb properties in Serralunga d'Albabased on Trailing Twelve Month (TTM) revenue. Analyze their characteristics, revenue, occupancy rate, and ADR to understand what drives success in this market.
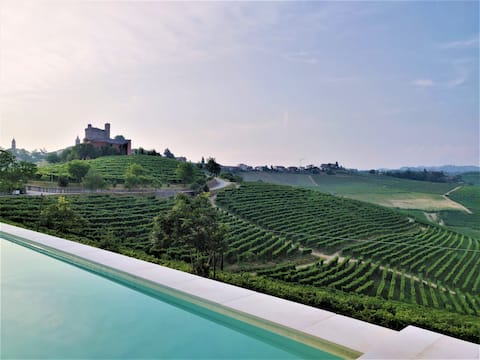
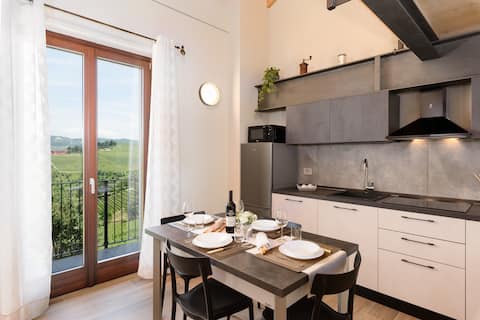
Villa Marenca, scenic views of Barolo
Entire Place • 5 bedrooms
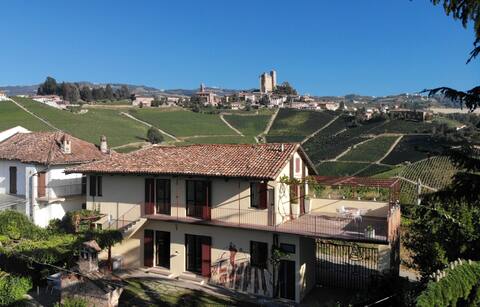
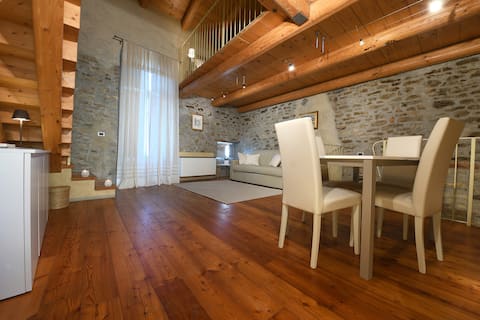
Cascina Parafada
Entire Place • 4 bedrooms
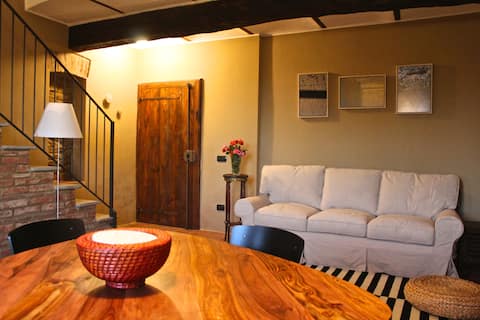
Corner on the vineyards - Studio apartment
Entire Place • 1 bedroom
Corner on the vineyards - Two-room apartment
Entire Place • 1 bedroom
Lovely place with views of the hills and castle
Entire Place • 1 bedroom
Casa Cucco
Entire Place • 2 bedrooms
Note: Performance varies based on location, size, amenities, seasonality, and management quality. Data reflects the past 12 months.
Top Performing Airbnb Hosts in Serralunga d'Alba (2025)
Learn from the best! This table showcases top-performing Airbnb hosts in Serralunga d'Alba based on the number of properties managed and estimated total revenue over the past year. Analyze their scale and performance metrics.
| Host Name | Properties | Grossing Revenue | Stay Reviews | Avg Rating |
|---|---|---|---|---|
| Catarina | 1 | $141,838 | 99 | 4.96/5.0 |
| Valerio | 3 | $57,812 | 9 | 5.00/5.0 |
| Marco | 2 | $46,657 | 65 | 4.96/5.0 |
| Vanesa | 1 | $20,455 | 33 | 5.00/5.0 |
| Andrea | 3 | $18,887 | 5 | 4.67/5.0 |
| Tenimenti | 1 | $18,879 | 182 | 4.93/5.0 |
| Giulia | 1 | $18,799 | 118 | 4.79/5.0 |
| Atriums | 2 | $9,412 | 13 | 4.74/5.0 |
| Maria Raffaella | 1 | $5,838 | 2 | Not Rated |
| Elisa | 1 | $4,620 | 6 | 4.83/5.0 |
Analyzing the strategies of top hosts, such as their property selection, pricing, and guest communication, can offer valuable lessons for optimizing your own Airbnb operations in Serralunga d'Alba.
Dive Deeper: Advanced Serralunga d'Alba STR Market Data (2025)
Ready to unlock more insights? AirROI provides access to advanced metrics and comprehensive Airbnb data for Serralunga d'Alba. Explore detailed analytics beyond this report to refine your investment strategy, optimize pricing, and maximize your vacation rental profits.
Explore Advanced MetricsSerralunga d'Alba Short-Term Rental Market Composition (2025): Property & Room Types
Room Type Distribution
Property Type Distribution
Market Composition Insights for Serralunga d'Alba
- The Serralunga d'Alba Airbnb market composition is heavily skewed towards Entire Home/Apt listings, which make up 94.4% of the 18 active rentals. This indicates strong guest preference for privacy and space.
- Looking at the property type distribution in Serralunga d'Alba, Apartment/Condo properties are the most common (66.7%), reflecting the local real estate landscape.
- Houses represent a significant 27.8% portion, catering likely to families or larger groups.
Serralunga d'Alba Airbnb Room Capacity Analysis (2025): Bedroom Distribution
Distribution of Listings by Number of Bedrooms
Room Capacity Insights for Serralunga d'Alba
- The dominant room capacity in Serralunga d'Alba is 1 bedroom listings, making up 50% of the market. This suggests a strong demand for properties suitable for couples or solo travelers.
- Together, 1 bedroom and 2 bedrooms properties represent 77.8% of the active Airbnb listings in Serralunga d'Alba, indicating a high concentration in these sizes.
Serralunga d'Alba Vacation Rental Guest Capacity Trends (2025)
Distribution of Listings by Guest Capacity
Guest Capacity Insights for Serralunga d'Alba
- The most common guest capacity trend in Serralunga d'Alba vacation rentals is listings accommodating 4 guests (44.4%). This suggests the primary traveler segment is likely small families or groups.
- Properties designed for 4 guests and 2 guests dominate the Serralunga d'Alba STR market, accounting for 66.6% of listings.
- 22.2% of properties accommodate 6+ guests, serving the market segment for larger families or group travel in Serralunga d'Alba.
- On average, properties in Serralunga d'Alba are equipped to host 4.1 guests.
Serralunga d'Alba Airbnb Booking Patterns (2025): Available vs. Booked Days
Available Days Distribution
Booked Days Distribution
Booking Pattern Insights for Serralunga d'Alba
- The most common availability pattern in Serralunga d'Alba falls within the 271-366 days range, representing 66.7% of listings. This suggests many properties have significant open periods on their calendars.
- Approximately 83.4% of listings show high availability (181+ days open annually), indicating potential for increased bookings or specific owner usage patterns.
- For booked days, the 1-30 days range is most frequent in Serralunga d'Alba (44.4%), reflecting common guest stay durations or potential owner blocking patterns.
- A notable 16.7% of properties secure long booking periods (181+ days booked per year), highlighting successful long-term rental strategies or significant owner usage.
Serralunga d'Alba Airbnb Minimum Stay Requirements Analysis
Distribution of Listings by Minimum Night Requirement
1 Night
2 listings
11.1% of total
2 Nights
8 listings
44.4% of total
4-6 Nights
3 listings
16.7% of total
7-29 Nights
1 listings
5.6% of total
30+ Nights
4 listings
22.2% of total
Key Insights
- The most prevalent minimum stay requirement in Serralunga d'Alba is 2 Nights, adopted by 44.4% of listings. This highlights the market's preference for shorter, flexible bookings.
- A significant segment (22.2%) caters to monthly stays (30+ nights) in Serralunga d'Alba, pointing to opportunities in the extended-stay market.
Recommendations
- Align with the market by considering a 2 Nights minimum stay, as 44.4% of Serralunga d'Alba hosts use this setting.
- If feasible, allowing 1-night stays, especially midweek or during low season, could capture last-minute bookings, as only 11.1% currently do.
- A 2-night minimum appears standard (44.4%). Consider this for weekends or peak periods.
- Explore offering discounts for stays of 30+ nights to attract the 22.2% of the market seeking extended stays.
- Adjust minimum nights based on seasonality – potentially shorter during low season and longer during peak demand periods in Serralunga d'Alba.
Serralunga d'Alba Airbnb Cancellation Policy Trends Analysis (2025)
Flexible
7 listings
38.9% of total
Moderate
6 listings
33.3% of total
Firm
2 listings
11.1% of total
Strict
3 listings
16.7% of total
Cancellation Policy Insights for Serralunga d'Alba
- The prevailing Airbnb cancellation policy trend in Serralunga d'Alba is Flexible, used by 38.9% of listings.
- The market strongly favors guest-friendly terms, with 72.2% of listings offering Flexible or Moderate policies. This suggests guests in Serralunga d'Alba may expect booking flexibility.
Recommendations for Hosts
- Consider adopting a Flexible policy to align with the 38.9% market standard in Serralunga d'Alba.
- Regularly review your cancellation policy against competitors and market demand shifts in Serralunga d'Alba.
Serralunga d'Alba STR Booking Lead Time Analysis (2025)
Average Booking Lead Time by Month
Booking Lead Time Insights for Serralunga d'Alba
- The overall average booking lead time for vacation rentals in Serralunga d'Alba is 57 days.
- Guests book furthest in advance for stays during October (average 95 days), likely coinciding with peak travel demand or local events.
- The shortest booking windows occur for stays in January (average 11 days), indicating more last-minute travel plans during this time.
- Seasonally, Fall (73 days avg.) sees the longest lead times, while Winter (28 days avg.) has the shortest, reflecting typical travel planning cycles.
Recommendations for Hosts
- Use the overall average lead time (57 days) as a baseline for your pricing and availability strategy in Serralunga d'Alba.
- For October stays, consider implementing length-of-stay discounts or slightly higher rates for bookings made less than 95 days out to capitalize on advance planning.
- During January, focus on last-minute booking availability and promotions, as guests book with very short notice (11 days avg.).
- Target marketing efforts for the Fall season well in advance (at least 73 days) to capture early planners.
- Monitor your own booking lead times against these Serralunga d'Alba averages to identify opportunities for dynamic pricing adjustments.
Popular & Essential Airbnb Amenities in Serralunga d'Alba (2025)
Amenity Prevalence
Amenity Insights for Serralunga d'Alba
- Essential amenities in Serralunga d'Alba that guests expect include: Kitchen, Free parking on premises. Lacking these (any) could significantly impact bookings.
- Popular amenities like Heating, Essentials, Wifi are common but not universal. Offering these can provide a competitive edge.
- Warning: Wifi is not universally provided but is considered essential globally. Ensure reliable Wifi is offered.
Recommendations for Hosts
- Ensure your listing includes all essential amenities for Serralunga d'Alba: Kitchen, Free parking on premises.
- Consider adding popular differentiators like Heating or Essentials to increase appeal.
- Highlight unique or less common amenities you offer (e.g., hot tub, dedicated workspace, EV charger) in your listing description and photos.
- Regularly check competitor amenities in Serralunga d'Alba to stay competitive.
Serralunga d'Alba Airbnb Guest Demographics & Profile Analysis (2025)
Guest Profile Summary for Serralunga d'Alba
- The typical guest profile for Airbnb in Serralunga d'Alba consists of predominantly international visitors (70%), with top international origins including United States, typically belonging to the Post-2000s (Gen Z/Alpha) group (50%), primarily speaking English or Italian.
- Domestic travelers account for 29.6% of guests.
- Key international markets include Italy (29.6%) and United States (16.9%).
- Top languages spoken are English (46.4%) followed by Italian (14.5%).
- A significant demographic segment is the Post-2000s (Gen Z/Alpha) group, representing 50% of guests.
Recommendations for Hosts
- Focus marketing internationally, particularly towards travelers from United States.
- Tailor amenities and listing descriptions to appeal to the dominant Post-2000s (Gen Z/Alpha) demographic (e.g., highlight fast WiFi, smart home features, local guides).
- Highlight unique local experiences or amenities relevant to the primary guest profile.
- Consider seasonal promotions aligned with peak travel times for key origin markets.
Nearby Short-Term Rental Market Comparison
How does the Serralunga d'Alba Airbnb market stack up against its neighbors? Compare key performance metrics like average monthly revenue, ADR, and occupancy rates in surrounding areas to understand the broader regional STR landscape.
| Market | Active Properties | Monthly Revenue | Daily Rate | Avg. Occupancy |
|---|---|---|---|---|
| Les Clefs | 34 | $5,790 | $317.67 | 46% |
| Ranco | 12 | $5,486 | $485.38 | 37% |
| Monteu Roero | 12 | $5,346 | $407.57 | 42% |
| Cossano Belbo | 10 | $4,814 | $355.26 | 36% |
| Manigod | 215 | $4,160 | $445.53 | 40% |
| Saint-Jean-Cap-Ferrat | 108 | $4,065 | $455.30 | 44% |
| Saint-Nicolas-la-Chapelle | 26 | $3,988 | $454.38 | 44% |
| Ramatuelle | 224 | $3,560 | $641.51 | 36% |
| Charvonnex | 11 | $3,507 | $258.71 | 47% |
| Val-d'Isère | 443 | $3,480 | $392.77 | 47% |