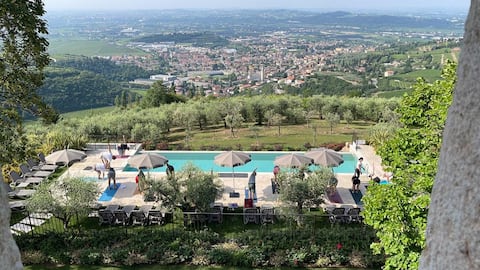
Sant'Ambrogio di Valpolicella Airbnb Market Analysis 2026: Short Term Rental Data & Vacation Rental Statistics in Veneto, Italy
Is Airbnb profitable in Sant'Ambrogio di Valpolicella in 2026? Explore comprehensive Airbnb analytics for Sant'Ambrogio di Valpolicella, Veneto, Italy to uncover income potential. This 2026 STR market report for Sant'Ambrogio di Valpolicella, based on AirROI data from February 2025 to January 2026, reveals key trends in the niche market of 50 active listings.
Whether you're considering an Airbnb investment in Sant'Ambrogio di Valpolicella, optimizing your existing vacation rental, or exploring rental arbitrage opportunities, understanding the Sant'Ambrogio di Valpolicella Airbnb data is crucial. Navigating the high regulation landscape is key to maximizing your short term rental income potential. Let's dive into the specifics.
Key Sant'Ambrogio di Valpolicella Airbnb Performance Metrics Overview
Monthly Airbnb Revenue Variations & Income Potential in Sant'Ambrogio di Valpolicella (2026)
Understanding the monthly revenue variations for Airbnb listings in Sant'Ambrogio di Valpolicella is key to maximizing your short term rental income potential. Seasonality significantly impacts earnings. Our analysis, based on data from the past 12 months, shows that the peak revenue month for STRs in Sant'Ambrogio di Valpolicella is typically August, while November often presents the lowest earnings, highlighting opportunities for strategic pricing adjustments during shoulder and low seasons. Explore the typical Airbnb income in Sant'Ambrogio di Valpolicella across different performance tiers:
- Best-in-class properties (Top 10%) achieve $3,424+ monthly, often utilizing dynamic pricing and superior guest experiences.
- Strong performing properties (Top 25%) earn $2,231 or more, indicating effective management and desirable locations/amenities.
- Typical properties (Median) generate around $1,274 per month, representing the average market performance.
- Entry-level properties (Bottom 25%) see earnings around $661, often with potential for optimization.
Average Monthly Airbnb Earnings Trend in Sant'Ambrogio di Valpolicella
Sant'Ambrogio di Valpolicella Airbnb Occupancy Rate Trends (2026)
Maximize your bookings by understanding the Sant'Ambrogio di Valpolicella STR occupancy trends. Seasonal demand shifts significantly influence how often properties are booked. Typically, Julysees the highest demand (peak season occupancy), while January experiences the lowest (low season). Effective strategies, like adjusting minimum stays or offering promotions, can boost occupancy during slower periods. Here's how different property tiers perform in Sant'Ambrogio di Valpolicella:
- Best-in-class properties (Top 10%) achieve 66%+ occupancy, indicating high desirability and potentially optimized availability.
- Strong performing properties (Top 25%) maintain 48% or higher occupancy, suggesting good market fit and guest satisfaction.
- Typical properties (Median) have an occupancy rate around 31%.
- Entry-level properties (Bottom 25%) average 16% occupancy, potentially facing higher vacancy.
Average Monthly Occupancy Rate Trend in Sant'Ambrogio di Valpolicella
Average Daily Rate (ADR) Airbnb Trends in Sant'Ambrogio di Valpolicella (2026)
Effective short term rental pricing strategy in Sant'Ambrogio di Valpolicella involves understanding monthly ADR fluctuations. The Average Daily Rate (ADR) for Airbnb in Sant'Ambrogio di Valpolicella typically peaks in August and dips lowest during February. Leveraging Airbnb dynamic pricing tools or strategies based on this seasonality can significantly boost revenue. Here's a look at the typical nightly rates achieved:
- Best-in-class properties (Top 10%) command rates of $311+ per night, often due to premium features or locations.
- Strong performing properties (Top 25%) achieve nightly rates of $168 or more.
- Typical properties (Median) charge around $131 per night.
- Entry-level properties (Bottom 25%) earn around $101 per night.
Average Daily Rate (ADR) Trend by Month in Sant'Ambrogio di Valpolicella
Get Live Sant'Ambrogio di Valpolicella Market Intelligence 👇

Explore Real-time Analytics
Airbnb Seasonality Analysis & Trends in Sant'Ambrogio di Valpolicella (2026)
Peak Season (August, September, July)
- Revenue averages $3,032 per month
- Occupancy rates average 55.4%
- Daily rates average $208
Shoulder Season
- Revenue averages $1,892 per month
- Occupancy maintains around 32.9%
- Daily rates hold near $198
Low Season (January, March, November)
- Revenue drops to average $848 per month
- Occupancy decreases to average 18.4%
- Daily rates adjust to average $196
Seasonality Insights for Sant'Ambrogio di Valpolicella
- The Airbnb seasonality in Sant'Ambrogio di Valpolicella shows highly seasonal trends requiring careful strategy. While the sections above show seasonal averages, it's also insightful to look at the extremes:
- During the high season, the absolute peak month showcases Sant'Ambrogio di Valpolicella's highest earning potential, with monthly revenues capable of climbing to $3,139, occupancy reaching a high of 57.6%, and ADRs peaking at $213.
- Conversely, the slowest single month of the year, typically falling within the low season, marks the market's lowest point. In this month, revenue might dip to $752, occupancy could drop to 15.4%, and ADRs may adjust down to $188.
- Understanding both the seasonal averages and these monthly peaks and troughs in revenue, occupancy, and ADR is crucial for maximizing your Airbnb profit potential in Sant'Ambrogio di Valpolicella.
Seasonal Strategies for Maximizing Profit
- Peak Season: Maximize revenue through premium pricing and potentially longer minimum stays. Ensure high availability.
- Low Season: Offer competitive pricing, special promotions (e.g., extended stay discounts), and flexible cancellation policies. Target off-season travelers like remote workers or budget-conscious guests.
- Shoulder Seasons: Implement dynamic pricing that balances peak and low rates. Target weekend travelers or specific events. Offer slightly more flexible terms than peak season.
- Regularly analyze your own performance against these Sant'Ambrogio di Valpolicella seasonality benchmarks and adjust your pricing and availability strategy accordingly.
Best Areas for Airbnb Investment in Sant'Ambrogio di Valpolicella (2026)
Exploring the top neighborhoods for short-term rentals in Sant'Ambrogio di Valpolicella? This section highlights key areas, outlining why they are attractive for hosts and guests, along with notable local attractions. Consider these locations based on your target guest profile and investment strategy.
| Neighborhood / Area | Why Host Here? (Target Guests & Appeal) | Key Attractions & Landmarks |
|---|---|---|
| Negrar | Charming town adjacent to Sant'Ambrogio, known for its scenic vineyards and beautiful landscapes. Ideal for wine lovers and those seeking a peaceful retreat in the Italian countryside. | Valpolicella Wine Region, Villa Mosconi Bertani, Parco delle Colombare, Pieve di San Floriano, Ponte di Veja |
| Fumane | Quaint village renowned for its excellent wine production and historical sites. Attracts visitors interested in culture and nature, making it a good spot for Airbnb hosting. | Wine estates, Parco Naturale Regionale della Lessinia, Castelletto di Fumane, Grotta di Fumane |
| Bardolino | A picturesque town on the eastern shore of Lake Garda, famous for its wine and beautiful lakeside scenery. Very popular among tourists, especially during summer. | Lago di Garda, Bardolino Wine Festival, Historic center with shops and restaurants, Bike trails along the lake |
| Lazise | Another popular lakeside destination, known for its medieval castle and waterfront promenade. Attractive for families and couples looking for romantic getaways. | Castello Scaligero, Parco Termale del Garda, Sea Life Aquarium, Valley of the Olive |
| Pescantina | Located close to Verona, this small town offers a quiet atmosphere with easy access to urban attractions and nearby wineries. Perfect for those seeking a blend of city and countryside. | Historical churches, River Adige, Nearby Valpolicella wineries, Giardini della Torre |
| San Pietro in Cariano | Famous for its vineyards and wine production, offering a rustic and tranquil experience. Great for guests looking to relax in a scenic environment. | Wine tasting tours, Villa Buri, Local art galleries, Nature trails |
| Verona | The historic and romantic city, home to Juliet's balcony and rich cultural heritage. Always a top tourist destination, making it a prime location for Airbnb investments. | Arena di Verona, Juliet's House, Piazza delle Erbe, Castelvecchio |
| Soave | Famous for its wine, especially Soave white wine, and its medieval castle. A charming village attracting wine enthusiasts and history buffs alike. | Soave Castle, Wine cellars, Historical center with ancient churches, Local wine festivals |
Understanding Airbnb License Requirements & STR Laws in Sant'Ambrogio di Valpolicella (2026)
Yes, Sant'Ambrogio di Valpolicella, Veneto, Italy enforces high STR regulations. Obtaining a license and ensuring compliance is almost certainly required according to current 2026 STR laws. Always verify the latest short term rental regulations and Airbnb license requirements directly with local government authorities for Sant'Ambrogio di Valpolicella to ensure full compliance before hosting.
(Source: AirROI data, 2026, based on 72% licensed listings)
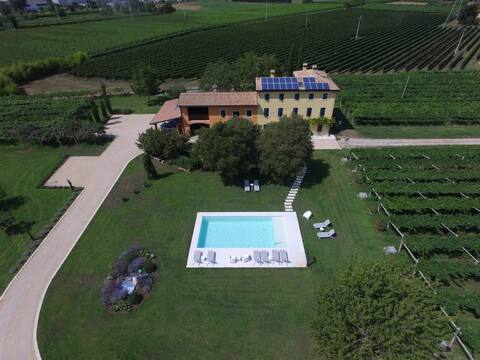
Top Performing Airbnb Properties in Sant'Ambrogio di Valpolicella (2026)
Benchmark your potential! Explore examples of top-performing Airbnb properties in Sant'Ambrogio di Valpolicellabased on Trailing Twelve Month (TTM) revenue. Analyze their characteristics, revenue, occupancy rate, and ADR to understand what drives success in this market.
Estate with vineyard in Valpolicella, Lake view
Private Room • 10 bedrooms

Valpolicella River it023077c2kmpwcajj
Entire Place • 4 bedrooms

SEMI-DETACHED VILLA RESIDENTIAL AREA VALPOLICELLA
Entire Place • 3 bedrooms

Your home in Valpolicella en023077c2hmq94xil
Entire Place • 3 bedrooms

Residenza Borgo Valpolicella - Romeo Accommodation
Entire Place • 2 bedrooms
B&B Companion Valpolicella
Private Room • N/A
Note: Performance varies based on location, size, amenities, seasonality, and management quality. Data reflects the past 12 months.
Top Performing Airbnb Hosts in Sant'Ambrogio di Valpolicella (2026)
Learn from the best! This table showcases top-performing Airbnb hosts in Sant'Ambrogio di Valpolicella based on the number of properties managed and estimated total revenue over the past year. Analyze their scale and performance metrics.
| Host Name | Properties | Grossing Revenue | Stay Reviews | Avg Rating |
|---|---|---|---|---|
| Luca | 3 | $129,969 | 166 | 4.85/5.0 |
| Giuliana | 1 | $109,692 | 1 | Not Rated |
| Laura | 3 | $73,544 | 516 | 4.98/5.0 |
| Monica | 3 | $68,600 | 197 | 4.99/5.0 |
| Alessandra | 2 | $60,541 | 91 | 4.96/5.0 |
| Fabia | 2 | $35,695 | 94 | 4.92/5.0 |
| Elena | 3 | $32,430 | 418 | 4.50/5.0 |
| Graziano | 2 | $28,692 | 150 | 4.88/5.0 |
| Matteo | 1 | $24,466 | 22 | 5.00/5.0 |
| Marta | 1 | $21,677 | 6 | 4.67/5.0 |
Analyzing the strategies of top hosts, such as their property selection, pricing, and guest communication, can offer valuable lessons for optimizing your own Airbnb operations in Sant'Ambrogio di Valpolicella.
Dive Deeper: Advanced Sant'Ambrogio di Valpolicella STR Market Data (2026)
Ready to unlock more insights? AirROI provides access to advanced metrics and comprehensive Airbnb data for Sant'Ambrogio di Valpolicella. Explore detailed analytics beyond this report to refine your investment strategy, optimize pricing, and maximize your vacation rental profits.
Explore Advanced MetricsSant'Ambrogio di Valpolicella Short-Term Rental Market Composition (2026): Property & Room Types
Room Type Distribution
Property Type Distribution
Market Composition Insights for Sant'Ambrogio di Valpolicella
- The Sant'Ambrogio di Valpolicella Airbnb market composition is heavily skewed towards Entire Home/Apt listings, which make up 80% of the 50 active rentals. This indicates strong guest preference for privacy and space.
- Looking at the property type distribution in Sant'Ambrogio di Valpolicella, House properties are the most common (44%), reflecting the local real estate landscape.
- Houses represent a significant 44% portion, catering likely to families or larger groups.
- The presence of 18% Hotel/Boutique listings indicates integration with traditional hospitality.
- Smaller segments like unique stays, others (combined 8.0%) offer potential for unique stay experiences.
Sant'Ambrogio di Valpolicella Airbnb Room Capacity Analysis (2026): Bedroom Distribution
Distribution of Listings by Number of Bedrooms
Room Capacity Insights for Sant'Ambrogio di Valpolicella
- The dominant room capacity in Sant'Ambrogio di Valpolicella is 2 bedrooms listings, making up 36% of the market. This suggests a strong demand for properties suitable for couples or solo travelers.
- Together, 2 bedrooms and 1 bedroom properties represent 72.0% of the active Airbnb listings in Sant'Ambrogio di Valpolicella, indicating a high concentration in these sizes.
Sant'Ambrogio di Valpolicella Vacation Rental Guest Capacity Trends (2026)
Distribution of Listings by Guest Capacity
Guest Capacity Insights for Sant'Ambrogio di Valpolicella
- The most common guest capacity trend in Sant'Ambrogio di Valpolicella vacation rentals is listings accommodating 4 guests (30%). This suggests the primary traveler segment is likely small families or groups.
- Properties designed for 4 guests and 5 guests dominate the Sant'Ambrogio di Valpolicella STR market, accounting for 50.0% of listings.
- 18.0% of properties accommodate 6+ guests, serving the market segment for larger families or group travel in Sant'Ambrogio di Valpolicella.
- On average, properties in Sant'Ambrogio di Valpolicella are equipped to host 3.8 guests.
Sant'Ambrogio di Valpolicella Airbnb Booking Patterns (2026): Available vs. Booked Days
Available Days Distribution
Booked Days Distribution
Booking Pattern Insights for Sant'Ambrogio di Valpolicella
- The most common availability pattern in Sant'Ambrogio di Valpolicella falls within the 271-366 days range, representing 56% of listings. This suggests many properties have significant open periods on their calendars.
- Approximately 94.0% of listings show high availability (181+ days open annually), indicating potential for increased bookings or specific owner usage patterns.
- For booked days, the 91-180 days range is most frequent in Sant'Ambrogio di Valpolicella (40%), reflecting common guest stay durations or potential owner blocking patterns.
- A notable 6.0% of properties secure long booking periods (181+ days booked per year), highlighting successful long-term rental strategies or significant owner usage.
Sant'Ambrogio di Valpolicella Airbnb Minimum Stay Requirements Analysis
Distribution of Listings by Minimum Night Requirement
1 Night
10 listings
20% of total
2 Nights
14 listings
28% of total
3 Nights
6 listings
12% of total
4-6 Nights
1 listings
2% of total
30+ Nights
19 listings
38% of total
Key Insights
- The most prevalent minimum stay requirement in Sant'Ambrogio di Valpolicella is 30+ Nights, adopted by 38% of listings. This highlights the market's preference for longer commitments.
- A significant segment (38%) caters to monthly stays (30+ nights) in Sant'Ambrogio di Valpolicella, pointing to opportunities in the extended-stay market.
Recommendations
- Align with the market by considering a 30+ Nights minimum stay, as 38% of Sant'Ambrogio di Valpolicella hosts use this setting.
- If feasible, allowing 1-night stays, especially midweek or during low season, could capture last-minute bookings, as only 20% currently do.
- Explore offering discounts for stays of 30+ nights to attract the 38% of the market seeking extended stays.
- Adjust minimum nights based on seasonality – potentially shorter during low season and longer during peak demand periods in Sant'Ambrogio di Valpolicella.
Sant'Ambrogio di Valpolicella Airbnb Cancellation Policy Trends Analysis (2026)
Limited
3 listings
6% of total
Super Strict 30 Days
2 listings
4% of total
Flexible
12 listings
24% of total
Moderate
25 listings
50% of total
Firm
5 listings
10% of total
Strict
3 listings
6% of total
Cancellation Policy Insights for Sant'Ambrogio di Valpolicella
- The prevailing Airbnb cancellation policy trend in Sant'Ambrogio di Valpolicella is Moderate, used by 50% of listings.
- The market strongly favors guest-friendly terms, with 74.0% of listings offering Flexible or Moderate policies. This suggests guests in Sant'Ambrogio di Valpolicella may expect booking flexibility.
- Strict cancellation policies are quite rare (6%), potentially making listings with this policy less competitive unless justified by high demand or property type.
Recommendations for Hosts
- Consider adopting a Moderate policy to align with the 50% market standard in Sant'Ambrogio di Valpolicella.
- Using a Strict policy might deter some guests, as only 6% of listings use it. Evaluate if potential revenue protection outweighs possible lower booking rates.
- Regularly review your cancellation policy against competitors and market demand shifts in Sant'Ambrogio di Valpolicella.
Sant'Ambrogio di Valpolicella STR Booking Lead Time Analysis (2026)
Average Booking Lead Time by Month
Booking Lead Time Insights for Sant'Ambrogio di Valpolicella
- The overall average booking lead time for vacation rentals in Sant'Ambrogio di Valpolicella is 59 days.
- Guests book furthest in advance for stays during September (average 82 days), likely coinciding with peak travel demand or local events.
- The shortest booking windows occur for stays in December (average 39 days), indicating more last-minute travel plans during this time.
- Seasonally, Summer (72 days avg.) sees the longest lead times, while Winter (44 days avg.) has the shortest, reflecting typical travel planning cycles.
Recommendations for Hosts
- Use the overall average lead time (59 days) as a baseline for your pricing and availability strategy in Sant'Ambrogio di Valpolicella.
- For September stays, consider implementing length-of-stay discounts or slightly higher rates for bookings made less than 82 days out to capitalize on advance planning.
- Target marketing efforts for the Summer season well in advance (at least 72 days) to capture early planners.
- Monitor your own booking lead times against these Sant'Ambrogio di Valpolicella averages to identify opportunities for dynamic pricing adjustments.
Popular & Essential Airbnb Amenities in Sant'Ambrogio di Valpolicella (2026)
Amenity Prevalence
Amenity Insights for Sant'Ambrogio di Valpolicella
- Essential amenities in Sant'Ambrogio di Valpolicella that guests expect include: Heating, TV, Wifi. Lacking these (any) could significantly impact bookings.
- Popular amenities like Hot water, Essentials, Hangers are common but not universal. Offering these can provide a competitive edge.
Recommendations for Hosts
- Ensure your listing includes all essential amenities for Sant'Ambrogio di Valpolicella: Heating, TV, Wifi.
- Prioritize adding missing essentials: TV, Wifi.
- Consider adding popular differentiators like Hot water or Essentials to increase appeal.
- Highlight unique or less common amenities you offer (e.g., hot tub, dedicated workspace, EV charger) in your listing description and photos.
- Regularly check competitor amenities in Sant'Ambrogio di Valpolicella to stay competitive.
Sant'Ambrogio di Valpolicella Airbnb Guest Demographics & Profile Analysis (2026)
Guest Profile Summary for Sant'Ambrogio di Valpolicella
- The typical guest profile for Airbnb in Sant'Ambrogio di Valpolicella consists of predominantly international visitors (77%), with top international origins including Italy, typically belonging to the Post-2000s (Gen Z/Alpha) group (50%), primarily speaking English or German.
- Domestic travelers account for 23.2% of guests.
- Key international markets include Germany (23.8%) and Italy (23.2%).
- Top languages spoken are English (32.9%) followed by German (13.8%).
- A significant demographic segment is the Post-2000s (Gen Z/Alpha) group, representing 50% of guests.
Recommendations for Hosts
- Focus marketing internationally, particularly towards travelers from Italy.
- Tailor amenities and listing descriptions to appeal to the dominant Post-2000s (Gen Z/Alpha) demographic (e.g., highlight fast WiFi, smart home features, local guides).
- Highlight unique local experiences or amenities relevant to the primary guest profile.
- Consider seasonal promotions aligned with peak travel times for key origin markets.
Nearby Short-Term Rental Market Comparison
How does the Sant'Ambrogio di Valpolicella Airbnb market stack up against its neighbors? Compare key performance metrics like average monthly revenue, ADR, and occupancy rates in surrounding areas to understand the broader regional STR landscape.
| Market | Active Properties | Monthly Revenue | Daily Rate | Avg. Occupancy |
|---|---|---|---|---|
| Sankt Pankraz - San Pancrazio | 12 | $6,528 | $633.65 | 29% |
| Urtijëi - St. Ulrich in Gröden - Ortisei | 172 | $5,054 | $718.33 | 41% |
| Laglio | 64 | $4,334 | $518.58 | 43% |
| Kiens - Chienes | 17 | $3,715 | $377.77 | 48% |
| Varenna | 226 | $3,641 | $300.50 | 52% |
| Portofino | 77 | $3,585 | $509.42 | 38% |
| Moos in Passeier - Moso in Passiria | 20 | $3,504 | $547.30 | 23% |
| Bellagio | 461 | $3,466 | $325.87 | 49% |
| Lajen - Laion | 96 | $3,338 | $548.27 | 36% |
| Sala Comacina | 73 | $3,332 | $451.20 | 46% |