ziwa La Ng'ombe ward Airbnb Market Analysis 2026: Short Term Rental Data & Vacation Rental Statistics in Mombasa County, Kenya
Is Airbnb profitable in ziwa La Ng'ombe ward in 2026? Explore comprehensive Airbnb analytics for ziwa La Ng'ombe ward, Mombasa County, Kenya to uncover income potential. This 2026 STR market report for ziwa La Ng'ombe ward, based on AirROI data from February 2025 to January 2026, reveals key trends in the market of 273 active listings.
Whether you're considering an Airbnb investment in ziwa La Ng'ombe ward, optimizing your existing vacation rental, or exploring rental arbitrage opportunities, understanding the ziwa La Ng'ombe ward Airbnb data is crucial. Leveraging the low regulation environment is key to maximizing your short term rental income potential. Let's dive into the specifics.
Key ziwa La Ng'ombe ward Airbnb Performance Metrics Overview
Monthly Airbnb Revenue Variations & Income Potential in ziwa La Ng'ombe ward (2026)
Understanding the monthly revenue variations for Airbnb listings in ziwa La Ng'ombe ward is key to maximizing your short term rental income potential. Seasonality significantly impacts earnings. Our analysis, based on data from the past 12 months, shows that the peak revenue month for STRs in ziwa La Ng'ombe ward is typically December, while January often presents the lowest earnings, highlighting opportunities for strategic pricing adjustments during shoulder and low seasons. Explore the typical Airbnb income in ziwa La Ng'ombe ward across different performance tiers:
- Best-in-class properties (Top 10%) achieve $1,910+ monthly, often utilizing dynamic pricing and superior guest experiences.
- Strong performing properties (Top 25%) earn $1,056 or more, indicating effective management and desirable locations/amenities.
- Typical properties (Median) generate around $481 per month, representing the average market performance.
- Entry-level properties (Bottom 25%) see earnings around $184, often with potential for optimization.
Average Monthly Airbnb Earnings Trend in ziwa La Ng'ombe ward
ziwa La Ng'ombe ward Airbnb Occupancy Rate Trends (2026)
Maximize your bookings by understanding the ziwa La Ng'ombe ward STR occupancy trends. Seasonal demand shifts significantly influence how often properties are booked. Typically, Augustsees the highest demand (peak season occupancy), while January experiences the lowest (low season). Effective strategies, like adjusting minimum stays or offering promotions, can boost occupancy during slower periods. Here's how different property tiers perform in ziwa La Ng'ombe ward:
- Best-in-class properties (Top 10%) achieve 65%+ occupancy, indicating high desirability and potentially optimized availability.
- Strong performing properties (Top 25%) maintain 43% or higher occupancy, suggesting good market fit and guest satisfaction.
- Typical properties (Median) have an occupancy rate around 24%.
- Entry-level properties (Bottom 25%) average 12% occupancy, potentially facing higher vacancy.
Average Monthly Occupancy Rate Trend in ziwa La Ng'ombe ward
Average Daily Rate (ADR) Airbnb Trends in ziwa La Ng'ombe ward (2026)
Effective short term rental pricing strategy in ziwa La Ng'ombe ward involves understanding monthly ADR fluctuations. The Average Daily Rate (ADR) for Airbnb in ziwa La Ng'ombe ward typically peaks in December and dips lowest during April. Leveraging Airbnb dynamic pricing tools or strategies based on this seasonality can significantly boost revenue. Here's a look at the typical nightly rates achieved:
- Best-in-class properties (Top 10%) command rates of $166+ per night, often due to premium features or locations.
- Strong performing properties (Top 25%) achieve nightly rates of $105 or more.
- Typical properties (Median) charge around $64 per night.
- Entry-level properties (Bottom 25%) earn around $34 per night.
Average Daily Rate (ADR) Trend by Month in ziwa La Ng'ombe ward
Get Live ziwa La Ng'ombe ward Market Intelligence 👇

Explore Real-time Analytics
Airbnb Seasonality Analysis & Trends in ziwa La Ng'ombe ward (2026)
Peak Season (December, August, July)
- Revenue averages $1,061 per month
- Occupancy rates average 33.6%
- Daily rates average $86
Shoulder Season
- Revenue averages $757 per month
- Occupancy maintains around 30.6%
- Daily rates hold near $80
Low Season (January, September, October)
- Revenue drops to average $610 per month
- Occupancy decreases to average 25.1%
- Daily rates adjust to average $82
Seasonality Insights for ziwa La Ng'ombe ward
- The Airbnb seasonality in ziwa La Ng'ombe ward shows highly seasonal trends requiring careful strategy. While the sections above show seasonal averages, it's also insightful to look at the extremes:
- During the high season, the absolute peak month showcases ziwa La Ng'ombe ward's highest earning potential, with monthly revenues capable of climbing to $1,245, occupancy reaching a high of 37.3%, and ADRs peaking at $98.
- Conversely, the slowest single month of the year, typically falling within the low season, marks the market's lowest point. In this month, revenue might dip to $548, occupancy could drop to 20.8%, and ADRs may adjust down to $79.
- Understanding both the seasonal averages and these monthly peaks and troughs in revenue, occupancy, and ADR is crucial for maximizing your Airbnb profit potential in ziwa La Ng'ombe ward.
Seasonal Strategies for Maximizing Profit
- Peak Season: Maximize revenue through premium pricing and potentially longer minimum stays. Ensure high availability.
- Low Season: Offer competitive pricing, special promotions (e.g., extended stay discounts), and flexible cancellation policies. Target off-season travelers like remote workers or budget-conscious guests.
- Shoulder Seasons: Implement dynamic pricing that balances peak and low rates. Target weekend travelers or specific events. Offer slightly more flexible terms than peak season.
- Regularly analyze your own performance against these ziwa La Ng'ombe ward seasonality benchmarks and adjust your pricing and availability strategy accordingly.
Best Areas for Airbnb Investment in ziwa La Ng'ombe ward (2026)
Exploring the top neighborhoods for short-term rentals in ziwa La Ng'ombe ward? This section highlights key areas, outlining why they are attractive for hosts and guests, along with notable local attractions. Consider these locations based on your target guest profile and investment strategy.
| Neighborhood / Area | Why Host Here? (Target Guests & Appeal) | Key Attractions & Landmarks |
|---|---|---|
| Nyali | A popular coastal suburb of Mombasa known for its beautiful beaches, luxury hotels, and vibrant nightlife. Ideal for tourists seeking beach relaxation and entertainment options. | Nyali Beach, Haller Park, Mamba Village Centre, Nyali Cinemax, Wild Waters Mombasa |
| Diani Beach | Renowned for its stunning white sand beaches and turquoise waters, Diani Beach is a favorite for both locals and tourists, offering a laid-back beach vibe and numerous water sports activities. | Diani Beach, Shimba Hills National Reserve, Kite Surfing, The Diani Beach Art Gallery, Colobus Conservation |
| Mombasa City Center | The historical heart of Mombasa featuring ancient sites, bustling markets, and diverse cultures. It attracts tourists interested in history, culture, and local cuisine. | Fort Jesus, Old Town, Mombasa Tusks, Bombolulu Workshops, Mombasa Marine National Park |
| Shanzu | A coastal area with beautiful beaches and resorts, appealing to families and tourists looking for relaxation and fun water activities. | Shanzu Beach, Bamburi Beach, KSSS Tennis Academy, Tropical Gardens of Mombasa, Malu Kenya |
| Kikambala | A lesser-known but beautiful beach area with a peaceful atmosphere, perfect for those seeking tranquility away from the bustling tourist spots. | Kikambala Beach, Zindidzam Island, Watamu Beach, Kikambala Marine Park, The Fountain of Hope |
| Bamburi | Famous for its vibrant beach life and marine conservation efforts, Bamburi is home to several resorts and natural attractions, making it popular among beachgoers. | Bamburi Beach, Nairobi National Park, Bamburi Nature Trail, Haller Park, Mombasa Butterfly House |
| Kilifi | A scenic coastal town known for its stunning beaches, historical ruins, and vibrant local culture, attracting visitors who appreciate nature and history. | Kilifi Creek, Gede Ruins, Mnarani Ruins, Kilifi Bridge, Watamu National Park |
| Malindi | A historic town renowned for its beautiful coastlines and rich Swahili culture, popular among tourists seeking adventure and cultural experiences. | Malindi Marine National Park, The Old Man and the Sea, Malindi Beach, The Vasco da Gama Pillar, Gedi Ruins |
Understanding Airbnb License Requirements & STR Laws in ziwa La Ng'ombe ward (2026)
While ziwa La Ng'ombe ward, Mombasa County, Kenya currently shows low STR regulations, specific Airbnb license requirements might still exist or change. Always verify the latest short term rental regulations and Airbnb license requirements directly with local government authorities for ziwa La Ng'ombe ward to ensure full compliance before hosting.
(Source: AirROI data, 2026, finding no licensed listings among those analyzed)
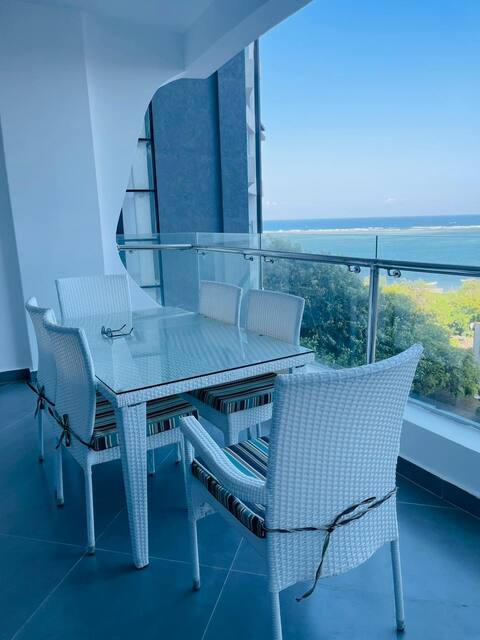
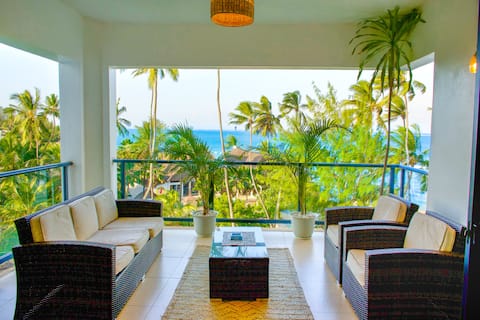
Top Performing Airbnb Properties in ziwa La Ng'ombe ward (2026)
Benchmark your potential! Explore examples of top-performing Airbnb properties in ziwa La Ng'ombe wardbased on Trailing Twelve Month (TTM) revenue. Analyze their characteristics, revenue, occupancy rate, and ADR to understand what drives success in this market.

Beachfront: Luxury Penthouse+Pool+Gym+AC 9
Entire Place • 4 bedrooms

Beachfront: Luxury Penthouse+Pool+Gym+AC 7
Entire Place • 4 bedrooms

Beachfront: Luxury Penthouse+Pool+Gym+AC 8
Entire Place • 4 bedrooms
Opulent Beachfront Apartment Nyali - Gym,Pool & AC
Entire Place • 4 bedrooms

The NEST, Oceanfront Apartment in Nyali
Entire Place • 2 bedrooms
Beachfront Penthouse: Pool+AC+Beach+Ensuite
Entire Place • 3 bedrooms
Note: Performance varies based on location, size, amenities, seasonality, and management quality. Data reflects the past 12 months.
Top Performing Airbnb Hosts in ziwa La Ng'ombe ward (2026)
Learn from the best! This table showcases top-performing Airbnb hosts in ziwa La Ng'ombe ward based on the number of properties managed and estimated total revenue over the past year. Analyze their scale and performance metrics.
| Host Name | Properties | Grossing Revenue | Stay Reviews | Avg Rating |
|---|---|---|---|---|
| Pwani Luxury | 4 | $179,895 | 227 | 4.87/5.0 |
| Willis | 4 | $68,590 | 73 | 4.85/5.0 |
| Flora | 4 | $63,387 | 109 | 4.89/5.0 |
| Terry | Kaja Stays | 4 | $55,930 | 79 | 4.81/5.0 |
| Mickey | 3 | $52,866 | 23 | 4.83/5.0 |
| Loise & Arthur | 5 | $52,779 | 93 | 4.67/5.0 |
| Rosalyn | 3 | $39,355 | 80 | 4.63/5.0 |
| Chris | 7 | $38,682 | 55 | 4.85/5.0 |
| Kevin | 5 | $38,566 | 78 | 4.64/5.0 |
| James | 2 | $35,904 | 69 | 4.93/5.0 |
Analyzing the strategies of top hosts, such as their property selection, pricing, and guest communication, can offer valuable lessons for optimizing your own Airbnb operations in ziwa La Ng'ombe ward.
Dive Deeper: Advanced ziwa La Ng'ombe ward STR Market Data (2026)
Ready to unlock more insights? AirROI provides access to advanced metrics and comprehensive Airbnb data for ziwa La Ng'ombe ward. Explore detailed analytics beyond this report to refine your investment strategy, optimize pricing, and maximize your vacation rental profits.
Explore Advanced Metricsziwa La Ng'ombe ward Short-Term Rental Market Composition (2026): Property & Room Types
Room Type Distribution
Property Type Distribution
Market Composition Insights for ziwa La Ng'ombe ward
- The ziwa La Ng'ombe ward Airbnb market composition is heavily skewed towards Entire Home/Apt listings, which make up 86.4% of the 273 active rentals. This indicates strong guest preference for privacy and space.
- Looking at the property type distribution in ziwa La Ng'ombe ward, Apartment/Condo properties are the most common (86.8%), reflecting the local real estate landscape.
- Smaller segments like hotel/boutique, others (combined 3.3%) offer potential for unique stay experiences.
ziwa La Ng'ombe ward Airbnb Room Capacity Analysis (2026): Bedroom Distribution
Distribution of Listings by Number of Bedrooms
Room Capacity Insights for ziwa La Ng'ombe ward
- The dominant room capacity in ziwa La Ng'ombe ward is 1 bedroom listings, making up 26% of the market. This suggests a strong demand for properties suitable for couples or solo travelers.
- Together, 1 bedroom and 2 bedrooms properties represent 50.9% of the active Airbnb listings in ziwa La Ng'ombe ward, indicating a high concentration in these sizes.
- A significant 37.0% of listings offer 3+ bedrooms, catering to larger groups and families seeking more space in ziwa La Ng'ombe ward.
ziwa La Ng'ombe ward Vacation Rental Guest Capacity Trends (2026)
Distribution of Listings by Guest Capacity
Guest Capacity Insights for ziwa La Ng'ombe ward
- The most common guest capacity trend in ziwa La Ng'ombe ward vacation rentals is listings accommodating 2 guests (27.8%). This suggests the primary traveler segment is likely couples or solo travelers.
- Properties designed for 2 guests and 8+ guests dominate the ziwa La Ng'ombe ward STR market, accounting for 47.2% of listings.
- 42.4% of properties accommodate 6+ guests, serving the market segment for larger families or group travel in ziwa La Ng'ombe ward.
- On average, properties in ziwa La Ng'ombe ward are equipped to host 4.4 guests.
ziwa La Ng'ombe ward Airbnb Booking Patterns (2026): Available vs. Booked Days
Available Days Distribution
Booked Days Distribution
Booking Pattern Insights for ziwa La Ng'ombe ward
- The most common availability pattern in ziwa La Ng'ombe ward falls within the 271-366 days range, representing 75.5% of listings. This suggests many properties have significant open periods on their calendars.
- Approximately 94.5% of listings show high availability (181+ days open annually), indicating potential for increased bookings or specific owner usage patterns.
- For booked days, the 1-30 days range is most frequent in ziwa La Ng'ombe ward (41.4%), reflecting common guest stay durations or potential owner blocking patterns.
- A notable 6.3% of properties secure long booking periods (181+ days booked per year), highlighting successful long-term rental strategies or significant owner usage.
ziwa La Ng'ombe ward Airbnb Minimum Stay Requirements Analysis
Distribution of Listings by Minimum Night Requirement
1 Night
196 listings
71.8% of total
2 Nights
34 listings
12.5% of total
3 Nights
1 listings
0.4% of total
4-6 Nights
1 listings
0.4% of total
7-29 Nights
1 listings
0.4% of total
30+ Nights
40 listings
14.7% of total
Key Insights
- The most prevalent minimum stay requirement in ziwa La Ng'ombe ward is 1 Night, adopted by 71.8% of listings. This highlights the market's preference for shorter, flexible bookings.
- A strong majority (84.3%) of the ziwa La Ng'ombe ward Airbnb data shows acceptance of very short stays (1-2 nights), indicating a dynamic, high-turnover market.
- A significant segment (14.7%) caters to monthly stays (30+ nights) in ziwa La Ng'ombe ward, pointing to opportunities in the extended-stay market.
Recommendations
- Align with the market by considering a 1 Night minimum stay, as 71.8% of ziwa La Ng'ombe ward hosts use this setting.
- Explore offering discounts for stays of 30+ nights to attract the 14.7% of the market seeking extended stays.
- Adjust minimum nights based on seasonality – potentially shorter during low season and longer during peak demand periods in ziwa La Ng'ombe ward.
ziwa La Ng'ombe ward Airbnb Cancellation Policy Trends Analysis (2026)
Limited
3 listings
1.1% of total
Flexible
125 listings
46% of total
Moderate
44 listings
16.2% of total
Firm
73 listings
26.8% of total
Strict
27 listings
9.9% of total
Cancellation Policy Insights for ziwa La Ng'ombe ward
- The prevailing Airbnb cancellation policy trend in ziwa La Ng'ombe ward is Flexible, used by 46% of listings.
- There's a relatively balanced mix between guest-friendly (62.2%) and stricter (36.7%) policies, offering choices for different guest needs.
- Strict cancellation policies are quite rare (9.9%), potentially making listings with this policy less competitive unless justified by high demand or property type.
Recommendations for Hosts
- Consider adopting a Flexible policy to align with the 46% market standard in ziwa La Ng'ombe ward.
- Using a Strict policy might deter some guests, as only 9.9% of listings use it. Evaluate if potential revenue protection outweighs possible lower booking rates.
- Regularly review your cancellation policy against competitors and market demand shifts in ziwa La Ng'ombe ward.
ziwa La Ng'ombe ward STR Booking Lead Time Analysis (2026)
Average Booking Lead Time by Month
Booking Lead Time Insights for ziwa La Ng'ombe ward
- The overall average booking lead time for vacation rentals in ziwa La Ng'ombe ward is 23 days.
- Guests book furthest in advance for stays during December (average 37 days), likely coinciding with peak travel demand or local events.
- The shortest booking windows occur for stays in February (average 12 days), indicating more last-minute travel plans during this time.
- Seasonally, Winter (27 days avg.) sees the longest lead times, while Spring (15 days avg.) has the shortest, reflecting typical travel planning cycles.
Recommendations for Hosts
- Use the overall average lead time (23 days) as a baseline for your pricing and availability strategy in ziwa La Ng'ombe ward.
- For December stays, consider implementing length-of-stay discounts or slightly higher rates for bookings made less than 37 days out to capitalize on advance planning.
- During February, focus on last-minute booking availability and promotions, as guests book with very short notice (12 days avg.).
- Target marketing efforts for the Winter season well in advance (at least 27 days) to capture early planners.
- Monitor your own booking lead times against these ziwa La Ng'ombe ward averages to identify opportunities for dynamic pricing adjustments.
Popular & Essential Airbnb Amenities in ziwa La Ng'ombe ward (2026)
Amenity Prevalence
Amenity Insights for ziwa La Ng'ombe ward
- Essential amenities in ziwa La Ng'ombe ward that guests expect include: Wifi, TV, Free parking on premises, Kitchen. Lacking these (any) could significantly impact bookings.
- Popular amenities like Iron, Refrigerator, Dishes and silverware are common but not universal. Offering these can provide a competitive edge.
Recommendations for Hosts
- Ensure your listing includes all essential amenities for ziwa La Ng'ombe ward: Wifi, TV, Free parking on premises, Kitchen.
- Prioritize adding missing essentials: Wifi, TV, Free parking on premises, Kitchen.
- Consider adding popular differentiators like Iron or Refrigerator to increase appeal.
- Highlight unique or less common amenities you offer (e.g., hot tub, dedicated workspace, EV charger) in your listing description and photos.
- Regularly check competitor amenities in ziwa La Ng'ombe ward to stay competitive.
ziwa La Ng'ombe ward Airbnb Guest Demographics & Profile Analysis (2026)
Guest Profile Summary for ziwa La Ng'ombe ward
- The typical guest profile for Airbnb in ziwa La Ng'ombe ward consists of predominantly international visitors (71%), with top international origins including United States, typically belonging to the Post-2000s (Gen Z/Alpha) group (50%), primarily speaking English or Swahili.
- Domestic travelers account for 29.3% of guests.
- Key international markets include Kenya (29.3%) and United States (25.5%).
- Top languages spoken are English (51.7%) followed by Swahili (9.3%).
- A significant demographic segment is the Post-2000s (Gen Z/Alpha) group, representing 50% of guests.
Recommendations for Hosts
- Focus marketing internationally, particularly towards travelers from United States.
- Tailor amenities and listing descriptions to appeal to the dominant Post-2000s (Gen Z/Alpha) demographic (e.g., highlight fast WiFi, smart home features, local guides).
- Highlight unique local experiences or amenities relevant to the primary guest profile.
- Consider seasonal promotions aligned with peak travel times for key origin markets.
Nearby Short-Term Rental Market Comparison
How does the ziwa La Ng'ombe ward Airbnb market stack up against its neighbors? Compare key performance metrics like average monthly revenue, ADR, and occupancy rates in surrounding areas to understand the broader regional STR landscape.
| Market | Active Properties | Monthly Revenue | Daily Rate | Avg. Occupancy |
|---|---|---|---|---|
| Matemwe | 22 | $2,061 | $230.11 | 29% |
| Kigomane | 21 | $1,967 | $186.76 | 36% |
| Mnarani ward | 30 | $1,948 | $231.14 | 31% |
| Dabaso ward | 106 | $1,899 | $188.81 | 39% |
| Ramisi ward | 13 | $1,883 | $214.70 | 31% |
| Tiwi ward | 17 | $1,501 | $194.77 | 27% |
| Kiwengwa | 101 | $1,377 | $177.91 | 32% |
| Kinondo ward | 176 | $1,179 | $175.61 | 30% |
| Ukunda ward | 307 | $1,144 | $138.19 | 32% |
| Kibarani ward | 18 | $984 | $108.38 | 26% |