Basseterre Airbnb Market Analysis 2026: Short Term Rental Data & Vacation Rental Statistics in Saint George Basseterre Parish, St. Kitts & Nevis
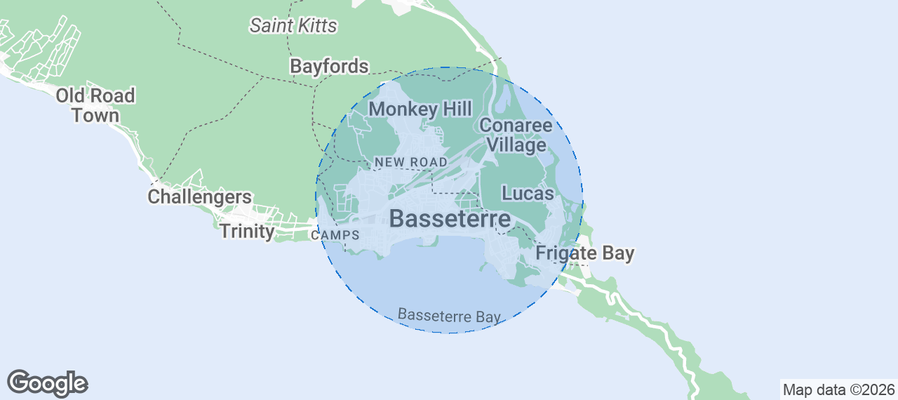
Is Airbnb profitable in Basseterre in 2026? Explore comprehensive Airbnb analytics for Basseterre, Saint George Basseterre Parish, St. Kitts & Nevis to uncover income potential. This 2026 STR market report for Basseterre, based on AirROI data from February 2025 to January 2026, reveals key trends in the niche market of 27 active listings.
Whether you're considering an Airbnb investment in Basseterre, optimizing your existing vacation rental, or exploring rental arbitrage opportunities, understanding the Basseterre Airbnb data is crucial. Leveraging the low regulation environment is key to maximizing your short term rental income potential. Let's dive into the specifics.
Key Basseterre Airbnb Performance Metrics Overview
Monthly Airbnb Revenue Variations & Income Potential in Basseterre (2026)
Understanding the monthly revenue variations for Airbnb listings in Basseterre is key to maximizing your short term rental income potential. Seasonality significantly impacts earnings. Our analysis, based on data from the past 12 months, shows that the peak revenue month for STRs in Basseterre is typically February, while November often presents the lowest earnings, highlighting opportunities for strategic pricing adjustments during shoulder and low seasons. Explore the typical Airbnb income in Basseterre across different performance tiers:
- Best-in-class properties (Top 10%) achieve $2,335+ monthly, often utilizing dynamic pricing and superior guest experiences.
- Strong performing properties (Top 25%) earn $1,441 or more, indicating effective management and desirable locations/amenities.
- Typical properties (Median) generate around $944 per month, representing the average market performance.
- Entry-level properties (Bottom 25%) see earnings around $595, often with potential for optimization.
Average Monthly Airbnb Earnings Trend in Basseterre
Basseterre Airbnb Occupancy Rate Trends (2026)
Maximize your bookings by understanding the Basseterre STR occupancy trends. Seasonal demand shifts significantly influence how often properties are booked. Typically, Februarysees the highest demand (peak season occupancy), while September experiences the lowest (low season). Effective strategies, like adjusting minimum stays or offering promotions, can boost occupancy during slower periods. Here's how different property tiers perform in Basseterre:
- Best-in-class properties (Top 10%) achieve 68%+ occupancy, indicating high desirability and potentially optimized availability.
- Strong performing properties (Top 25%) maintain 53% or higher occupancy, suggesting good market fit and guest satisfaction.
- Typical properties (Median) have an occupancy rate around 36%.
- Entry-level properties (Bottom 25%) average 22% occupancy, potentially facing higher vacancy.
Average Monthly Occupancy Rate Trend in Basseterre
Average Daily Rate (ADR) Airbnb Trends in Basseterre (2026)
Effective short term rental pricing strategy in Basseterre involves understanding monthly ADR fluctuations. The Average Daily Rate (ADR) for Airbnb in Basseterre typically peaks in December and dips lowest during February. Leveraging Airbnb dynamic pricing tools or strategies based on this seasonality can significantly boost revenue. Here's a look at the typical nightly rates achieved:
- Best-in-class properties (Top 10%) command rates of $164+ per night, often due to premium features or locations.
- Strong performing properties (Top 25%) achieve nightly rates of $133 or more.
- Typical properties (Median) charge around $105 per night.
- Entry-level properties (Bottom 25%) earn around $70 per night.
Average Daily Rate (ADR) Trend by Month in Basseterre
Get Live Basseterre Market Intelligence 👇
Explore Real-time Analytics
Airbnb Seasonality Analysis & Trends in Basseterre (2026)
Peak Season (February, December, March)
- Revenue averages $1,579 per month
- Occupancy rates average 51.9%
- Daily rates average $107
Shoulder Season
- Revenue averages $1,119 per month
- Occupancy maintains around 36.5%
- Daily rates hold near $107
Low Season (May, September, November)
- Revenue drops to average $871 per month
- Occupancy decreases to average 33.2%
- Daily rates adjust to average $107
Seasonality Insights for Basseterre
- The Airbnb seasonality in Basseterre shows highly seasonal trends requiring careful strategy. While the sections above show seasonal averages, it's also insightful to look at the extremes:
- During the high season, the absolute peak month showcases Basseterre's highest earning potential, with monthly revenues capable of climbing to $1,700, occupancy reaching a high of 64.3%, and ADRs peaking at $122.
- Conversely, the slowest single month of the year, typically falling within the low season, marks the market's lowest point. In this month, revenue might dip to $807, occupancy could drop to 26.1%, and ADRs may adjust down to $99.
- Understanding both the seasonal averages and these monthly peaks and troughs in revenue, occupancy, and ADR is crucial for maximizing your Airbnb profit potential in Basseterre.
Seasonal Strategies for Maximizing Profit
- Peak Season: Maximize revenue through premium pricing and potentially longer minimum stays. Ensure high availability.
- Low Season: Offer competitive pricing, special promotions (e.g., extended stay discounts), and flexible cancellation policies. Target off-season travelers like remote workers or budget-conscious guests.
- Shoulder Seasons: Implement dynamic pricing that balances peak and low rates. Target weekend travelers or specific events. Offer slightly more flexible terms than peak season.
- Regularly analyze your own performance against these Basseterre seasonality benchmarks and adjust your pricing and availability strategy accordingly.
Best Areas for Airbnb Investment in Basseterre (2026)
Exploring the top neighborhoods for short-term rentals in Basseterre? This section highlights key areas, outlining why they are attractive for hosts and guests, along with notable local attractions. Consider these locations based on your target guest profile and investment strategy.
| Neighborhood / Area | Why Host Here? (Target Guests & Appeal) | Key Attractions & Landmarks |
|---|---|---|
| Frigate Bay | A popular tourist destination known for its beautiful beaches and vibrant nightlife. Perfect for visitors seeking relaxation, water sports, and social activities. | Frigate Bay Beach, Kohli's Restaurant & Bar, The Strip, Royal St. Kitts Golf Club, Surf Bar |
| Basseterre | The capital city offering historical sites and local experiences. It serves as a cultural hub for tourists looking to explore St. Kitts' heritage. | Independence Square, The Circus, Black Rocks, National Museum, St. George's Anglican Church |
| Key’s Beach | Known for its tranquil environment and beautiful coastal scenery, this area is ideal for families and couples seeking a peaceful getaway. | Key’s Beach, Water sports activities, Beachfront dining, Nature trails |
| Cockleshell Bay | A stunning beach area popular for water sports and local eateries. Ideal for tourists looking to engage in adventure activities and local cuisine. | Cockleshell Beach, Salt Plage, Maritime Museum, Water Sports Center, Local beach bars |
| Sandy Point | A vibrant community with rich history and beautiful landscapes. Appeals to travelers interested in local culture and natural scenery. | Sandy Point Beach, Fort Charles, Historical sites, Local craft markets, Bird watching |
| Dieppe Bay | A serene and picturesque area known for its stunning views of the Caribbean and volcanic mountains. Suited for nature lovers and those seeking tranquility. | Dieppe Bay Beach, Mount Liamuiga views, Local hiking trails, Beachfront cafes |
| Palmetto Point | A quiet residential area with access to beautiful beaches and local attractions. Perfect for travelers looking for a laid-back vacation experience. | Palmetto Point Beach, Local dining options, Scenic views, Relaxing atmosphere |
| Half Moon Bay | A lesser-known gem that offers seclusion and natural beauty. Ideal for travelers seeking relaxation away from the tourist crowds. | Half Moon Bay Beach, Snorkeling spots, Hiking trails, Peaceful atmosphere |
Understanding Airbnb License Requirements & STR Laws in Basseterre (2026)
While Basseterre, Saint George Basseterre Parish, St. Kitts & Nevis currently shows low STR regulations, specific Airbnb license requirements might still exist or change. Always verify the latest short term rental regulations and Airbnb license requirements directly with local government authorities for Basseterre to ensure full compliance before hosting.
(Source: AirROI data, 2026, finding no licensed listings among those analyzed)
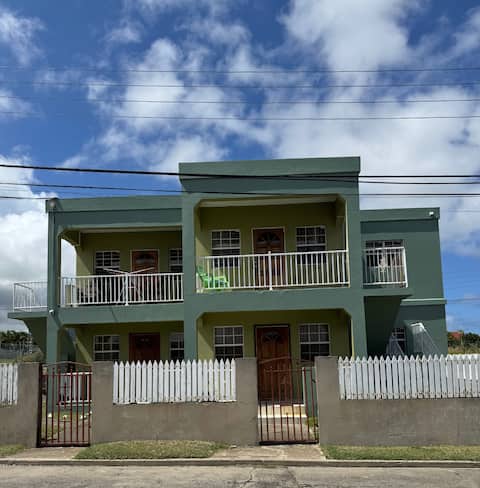
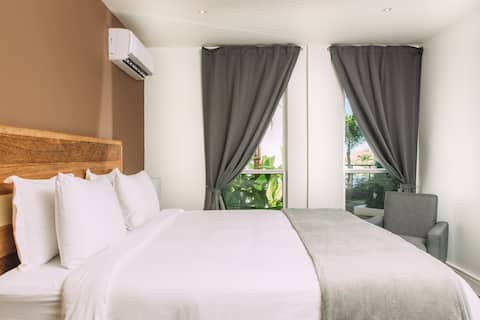
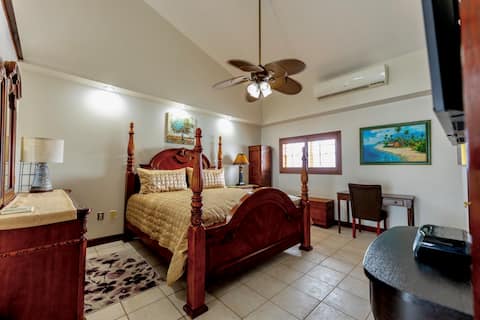
Top Performing Airbnb Properties in Basseterre (2026)
Benchmark your potential! Explore examples of top-performing Airbnb properties in Basseterrebased on Trailing Twelve Month (TTM) revenue. Analyze their characteristics, revenue, occupancy rate, and ADR to understand what drives success in this market.

1B Apartment With Amazing Sunsets
Entire Place • 1 bedroom

Silver Reef 3 Bedroom Flat
Entire Place • 3 bedrooms

Shalimar Saint Kitts Apartment 6
Entire Place • 1 bedroom
Study, Work or Leisure Town Apartment
Entire Place • 1 bedroom
Shalimar Saint Kitts Apartment 7
Entire Place • 1 bedroom
The Suite
Entire Place • 1 bedroom
Note: Performance varies based on location, size, amenities, seasonality, and management quality. Data reflects the past 12 months.
Top Performing Airbnb Hosts in Basseterre (2026)
Learn from the best! This table showcases top-performing Airbnb hosts in Basseterre based on the number of properties managed and estimated total revenue over the past year. Analyze their scale and performance metrics.
| Host Name | Properties | Grossing Revenue | Stay Reviews | Avg Rating |
|---|---|---|---|---|
| Jas | 7 | $55,159 | 175 | 4.50/5.0 |
| Shalimar | 2 | $41,414 | 85 | 4.83/5.0 |
| Leslie Troy | 1 | $26,409 | 102 | 4.96/5.0 |
| Oksana | 1 | $25,060 | 21 | 4.67/5.0 |
| Homer | 3 | $24,852 | 10 | 4.50/5.0 |
| Alex | 1 | $20,298 | 130 | 4.88/5.0 |
| Stanley | 2 | $16,353 | 52 | 4.82/5.0 |
| Patricia | 1 | $15,631 | 41 | 4.90/5.0 |
| Deborah | 2 | $11,124 | 49 | 4.68/5.0 |
| Giselle | 1 | $4,895 | 8 | 4.38/5.0 |
Analyzing the strategies of top hosts, such as their property selection, pricing, and guest communication, can offer valuable lessons for optimizing your own Airbnb operations in Basseterre.
Dive Deeper: Advanced Basseterre STR Market Data (2026)
Ready to unlock more insights? AirROI provides access to advanced metrics and comprehensive Airbnb data for Basseterre. Explore detailed analytics beyond this report to refine your investment strategy, optimize pricing, and maximize your vacation rental profits.
Explore Advanced MetricsBasseterre Short-Term Rental Market Composition (2026): Property & Room Types
Room Type Distribution
Property Type Distribution
Market Composition Insights for Basseterre
- The Basseterre Airbnb market composition is heavily skewed towards Entire Home/Apt listings, which make up 70.4% of the 27 active rentals. This indicates strong guest preference for privacy and space.
- Looking at the property type distribution in Basseterre, Apartment/Condo properties are the most common (74.1%), reflecting the local real estate landscape.
- The presence of 18.5% Hotel/Boutique listings indicates integration with traditional hospitality.
Basseterre Airbnb Room Capacity Analysis (2026): Bedroom Distribution
Distribution of Listings by Number of Bedrooms
Room Capacity Insights for Basseterre
- The dominant room capacity in Basseterre is 1 bedroom listings, making up 70.4% of the market. This suggests a strong demand for properties suitable for couples or solo travelers.
- Together, 1 bedroom and 2 bedrooms properties represent 85.2% of the active Airbnb listings in Basseterre, indicating a high concentration in these sizes.
- With over half the market (70.4%) consisting of studios or 1-bedroom units, Basseterre is particularly well-suited for individuals or couples.
- Listings with 3+ bedrooms (7.4%) represent a smaller niche, potentially indicating an underserved market for larger group accommodations in Basseterre.
Basseterre Vacation Rental Guest Capacity Trends (2026)
Distribution of Listings by Guest Capacity
Guest Capacity Insights for Basseterre
- The most common guest capacity trend in Basseterre vacation rentals is listings accommodating 2 guests (48.1%). This suggests the primary traveler segment is likely couples or solo travelers.
- Properties designed for 2 guests and 4 guests dominate the Basseterre STR market, accounting for 74.0% of listings.
- A significant 48.1% of listings cater specifically to 1-2 guests, highlighting strong demand from couples and solo travelers in Basseterre.
- On average, properties in Basseterre are equipped to host 2.7 guests.
Basseterre Airbnb Booking Patterns (2026): Available vs. Booked Days
Available Days Distribution
Booked Days Distribution
Booking Pattern Insights for Basseterre
- The most common availability pattern in Basseterre falls within the 271-366 days range, representing 48.1% of listings. This suggests many properties have significant open periods on their calendars.
- Approximately 92.5% of listings show high availability (181+ days open annually), indicating potential for increased bookings or specific owner usage patterns.
- For booked days, the 91-180 days range is most frequent in Basseterre (40.7%), reflecting common guest stay durations or potential owner blocking patterns.
- A notable 11.1% of properties secure long booking periods (181+ days booked per year), highlighting successful long-term rental strategies or significant owner usage.
Basseterre Airbnb Minimum Stay Requirements Analysis
Distribution of Listings by Minimum Night Requirement
1 Night
7 listings
25.9% of total
2 Nights
4 listings
14.8% of total
3 Nights
6 listings
22.2% of total
30+ Nights
10 listings
37% of total
Key Insights
- The most prevalent minimum stay requirement in Basseterre is 30+ Nights, adopted by 37% of listings. This highlights the market's preference for longer commitments.
- A significant segment (37%) caters to monthly stays (30+ nights) in Basseterre, pointing to opportunities in the extended-stay market.
Recommendations
- Align with the market by considering a 30+ Nights minimum stay, as 37% of Basseterre hosts use this setting.
- If feasible, allowing 1-night stays, especially midweek or during low season, could capture last-minute bookings, as only 25.9% currently do.
- Explore offering discounts for stays of 30+ nights to attract the 37% of the market seeking extended stays.
- Adjust minimum nights based on seasonality – potentially shorter during low season and longer during peak demand periods in Basseterre.
Basseterre Airbnb Cancellation Policy Trends Analysis (2026)
Limited
1 listings
3.7% of total
Flexible
13 listings
48.1% of total
Moderate
3 listings
11.1% of total
Firm
8 listings
29.6% of total
Strict
2 listings
7.4% of total
Cancellation Policy Insights for Basseterre
- The prevailing Airbnb cancellation policy trend in Basseterre is Flexible, used by 48.1% of listings.
- There's a relatively balanced mix between guest-friendly (59.2%) and stricter (37.0%) policies, offering choices for different guest needs.
- Strict cancellation policies are quite rare (7.4%), potentially making listings with this policy less competitive unless justified by high demand or property type.
Recommendations for Hosts
- Consider adopting a Flexible policy to align with the 48.1% market standard in Basseterre.
- Using a Strict policy might deter some guests, as only 7.4% of listings use it. Evaluate if potential revenue protection outweighs possible lower booking rates.
- Regularly review your cancellation policy against competitors and market demand shifts in Basseterre.
Basseterre STR Booking Lead Time Analysis (2026)
Average Booking Lead Time by Month
Booking Lead Time Insights for Basseterre
- The overall average booking lead time for vacation rentals in Basseterre is 54 days.
- Guests book furthest in advance for stays during June (average 98 days), likely coinciding with peak travel demand or local events.
- The shortest booking windows occur for stays in October (average 6 days), indicating more last-minute travel plans during this time.
- Seasonally, Winter (59 days avg.) sees the longest lead times, while Fall (30 days avg.) has the shortest, reflecting typical travel planning cycles.
Recommendations for Hosts
- Use the overall average lead time (54 days) as a baseline for your pricing and availability strategy in Basseterre.
- For June stays, consider implementing length-of-stay discounts or slightly higher rates for bookings made less than 98 days out to capitalize on advance planning.
- During October, focus on last-minute booking availability and promotions, as guests book with very short notice (6 days avg.).
- Target marketing efforts for the Winter season well in advance (at least 59 days) to capture early planners.
- Monitor your own booking lead times against these Basseterre averages to identify opportunities for dynamic pricing adjustments.
Popular & Essential Airbnb Amenities in Basseterre (2026)
Amenity Prevalence
Amenity Insights for Basseterre
- Essential amenities in Basseterre that guests expect include: Air conditioning, Wifi, TV. Lacking these (any) could significantly impact bookings.
- Popular amenities like Kitchen, Iron, Washer are common but not universal. Offering these can provide a competitive edge.
Recommendations for Hosts
- Ensure your listing includes all essential amenities for Basseterre: Air conditioning, Wifi, TV.
- Prioritize adding missing essentials: TV.
- Consider adding popular differentiators like Kitchen or Iron to increase appeal.
- Highlight unique or less common amenities you offer (e.g., hot tub, dedicated workspace, EV charger) in your listing description and photos.
- Regularly check competitor amenities in Basseterre to stay competitive.
Basseterre Airbnb Guest Demographics & Profile Analysis (2026)
Guest Profile Summary for Basseterre
- The typical guest profile for Airbnb in Basseterre consists of predominantly international visitors (100%), with top international origins including United Kingdom, typically belonging to the Post-2000s (Gen Z/Alpha) group (50%), primarily speaking English or Spanish.
- Domestic travelers account for 0.0% of guests.
- Key international markets include United States (46.9%) and United Kingdom (9.2%).
- Top languages spoken are English (52.8%) followed by Spanish (13.8%).
- A significant demographic segment is the Post-2000s (Gen Z/Alpha) group, representing 50% of guests.
Recommendations for Hosts
- Focus marketing internationally, particularly towards travelers from United Kingdom.
- Tailor amenities and listing descriptions to appeal to the dominant Post-2000s (Gen Z/Alpha) demographic (e.g., highlight fast WiFi, smart home features, local guides).
- Highlight unique local experiences or amenities relevant to the primary guest profile.
- Consider seasonal promotions aligned with peak travel times for key origin markets.
Nearby Short-Term Rental Market Comparison
How does the Basseterre Airbnb market stack up against its neighbors? Compare key performance metrics like average monthly revenue, ADR, and occupancy rates in surrounding areas to understand the broader regional STR landscape.
| Market | Active Properties | Monthly Revenue | Daily Rate | Avg. Occupancy |
|---|---|---|---|---|
| Long Bay Village | 26 | $5,969 | $1098.49 | 32% |
| Saint Barthélemy | 554 | $5,892 | $1034.64 | 37% |
| Fleming Estate | 15 | $5,884 | $572.58 | 46% |
| West End Village | 21 | $4,844 | $1011.24 | 33% |
| Simpson Bay | 71 | $4,362 | $469.96 | 41% |
| Sandy Ground | 15 | $4,036 | $442.05 | 40% |
| Cul-de-Sac | 285 | $3,911 | $368.99 | 41% |
| Bolans | 81 | $3,659 | $526.19 | 36% |
| Dawn Beach | 65 | $3,368 | $419.79 | 38% |
| Crosbies | 17 | $3,348 | $520.95 | 40% |