Michamvi Airbnb Market Analysis 2026: Short Term Rental Data & Vacation Rental Statistics in Zanzibar South & Central, Tanzania
Is Airbnb profitable in Michamvi in 2026? Explore comprehensive Airbnb analytics for Michamvi, Zanzibar South & Central, Tanzania to uncover income potential. This 2026 STR market report for Michamvi, based on AirROI data from November 2024 to October 2025, reveals key trends in the niche market of 18 active listings.
Whether you're considering an Airbnb investment in Michamvi, optimizing your existing vacation rental, or exploring rental arbitrage opportunities, understanding the Michamvi Airbnb data is crucial. Leveraging the low regulation environment is key to maximizing your short term rental income potential. Let's dive into the specifics.
Key Michamvi Airbnb Performance Metrics Overview
Monthly Airbnb Revenue Variations & Income Potential in Michamvi (2026)
Understanding the monthly revenue variations for Airbnb listings in Michamvi is key to maximizing your short term rental income potential. Seasonality significantly impacts earnings. Our analysis, based on data from the past 12 months, shows that the peak revenue month for STRs in Michamvi is typically May, while October often presents the lowest earnings, highlighting opportunities for strategic pricing adjustments during shoulder and low seasons. Explore the typical Airbnb income in Michamvi across different performance tiers:
- Best-in-class properties (Top 10%) achieve $3,611+ monthly, often utilizing dynamic pricing and superior guest experiences.
- Strong performing properties (Top 25%) earn $1,919 or more, indicating effective management and desirable locations/amenities.
- Typical properties (Median) generate around $678 per month, representing the average market performance.
- Entry-level properties (Bottom 25%) see earnings around $200, often with potential for optimization.
Average Monthly Airbnb Earnings Trend in Michamvi
Michamvi Airbnb Occupancy Rate Trends (2026)
Maximize your bookings by understanding the Michamvi STR occupancy trends. Seasonal demand shifts significantly influence how often properties are booked. Typically, Februarysees the highest demand (peak season occupancy), while October experiences the lowest (low season). Effective strategies, like adjusting minimum stays or offering promotions, can boost occupancy during slower periods. Here's how different property tiers perform in Michamvi:
- Best-in-class properties (Top 10%) achieve 65%+ occupancy, indicating high desirability and potentially optimized availability.
- Strong performing properties (Top 25%) maintain 41% or higher occupancy, suggesting good market fit and guest satisfaction.
- Typical properties (Median) have an occupancy rate around 21%.
- Entry-level properties (Bottom 25%) average 11% occupancy, potentially facing higher vacancy.
Average Monthly Occupancy Rate Trend in Michamvi
Average Daily Rate (ADR) Airbnb Trends in Michamvi (2026)
Effective short term rental pricing strategy in Michamvi involves understanding monthly ADR fluctuations. The Average Daily Rate (ADR) for Airbnb in Michamvi typically peaks in August and dips lowest during May. Leveraging Airbnb dynamic pricing tools or strategies based on this seasonality can significantly boost revenue. Here's a look at the typical nightly rates achieved:
- Best-in-class properties (Top 10%) command rates of $83+ per night, often due to premium features or locations.
- Strong performing properties (Top 25%) achieve nightly rates of $52 or more.
- Typical properties (Median) charge around $42 per night.
- Entry-level properties (Bottom 25%) earn around $32 per night.
Average Daily Rate (ADR) Trend by Month in Michamvi
Get Live Michamvi Market Intelligence 👇

Explore Real-time Analytics
Airbnb Seasonality Analysis & Trends in Michamvi (2025)
Peak Season (May, August, September)
- Revenue averages $2,187 per month
- Occupancy rates average 38.2%
- Daily rates average $55
Shoulder Season
- Revenue averages $1,225 per month
- Occupancy maintains around 30.8%
- Daily rates hold near $54
Low Season (October, November, December)
- Revenue drops to average $844 per month
- Occupancy decreases to average 22.6%
- Daily rates adjust to average $54
Seasonality Insights for Michamvi
- The Airbnb seasonality in Michamvi shows highly seasonal trends requiring careful strategy. While the sections above show seasonal averages, it's also insightful to look at the extremes:
- During the high season, the absolute peak month showcases Michamvi's highest earning potential, with monthly revenues capable of climbing to $2,462, occupancy reaching a high of 44.6%, and ADRs peaking at $58.
- Conversely, the slowest single month of the year, typically falling within the low season, marks the market's lowest point. In this month, revenue might dip to $666, occupancy could drop to 18.5%, and ADRs may adjust down to $51.
- Understanding both the seasonal averages and these monthly peaks and troughs in revenue, occupancy, and ADR is crucial for maximizing your Airbnb profit potential in Michamvi.
Seasonal Strategies for Maximizing Profit
- Peak Season: Maximize revenue through premium pricing and potentially longer minimum stays. Ensure high availability.
- Low Season: Offer competitive pricing, special promotions (e.g., extended stay discounts), and flexible cancellation policies. Target off-season travelers like remote workers or budget-conscious guests.
- Shoulder Seasons: Implement dynamic pricing that balances peak and low rates. Target weekend travelers or specific events. Offer slightly more flexible terms than peak season.
- Regularly analyze your own performance against these Michamvi seasonality benchmarks and adjust your pricing and availability strategy accordingly.
Best Areas for Airbnb Investment in Michamvi (2026)
Exploring the top neighborhoods for short-term rentals in Michamvi? This section highlights key areas, outlining why they are attractive for hosts and guests, along with notable local attractions. Consider these locations based on your target guest profile and investment strategy.
| Neighborhood / Area | Why Host Here? (Target Guests & Appeal) | Key Attractions & Landmarks |
|---|---|---|
| Michamvi Kae | A picturesque beach area known for its stunning sunsets and tranquil atmosphere. Ideal for tourists looking for relaxation and picturesque beachfront properties. | Michamvi Beach, Kae Beach, Coral Reef Snorkeling, The Rock Restaurant, Zanzibar Butterfly Centre |
| Michamvi Pingwe | Famous for its beautiful shoreline and the iconic 'The Rock' restaurant perched on a rock in the sea. A must-visit for visitors seeking an unforgettable dining experience and beautiful scenery. | The Rock Restaurant, Pingwe Beach, Snorkeling and Diving Spots, Fishermen's beach, Sunset Views |
| Chwaka Bay | A beautiful bay area that offers stunning views and a variety of water sports. Great for families and water activity enthusiasts looking for a relaxing getaway. | Chwaka Beach, Diving and Snorkeling, Mangrove Forests, Local Markets, Fishing Trips |
| Paje | A lively coastal village known for its kite surfing and vibrant nightlife. Great destination for younger travelers looking for adventure and excitement. | Paje Beach, Kite surfing spots, Beach bars and restaurants, Spa and Wellness Centers, Local Shops |
| Jambiani | A traditional fishing village known for its beautiful white sandy beaches and cultural experiences. Attracts tourists interested in authentic local encounters and nature. | Jambiani Beach, Seaweed Farms, Local Craft Shops, Cultural Tours, Fishing Village |
| Zanzibar Town | The historic capital of Zanzibar, rich in history and culture. Ideal for guests interested in exploring Stone Town's heritage and vibrant markets. | Stone Town, Forodhani Gardens, Old Fort, Sultan's Palace, Darajani Market |
| Nungwi | An iconic beach destination located at the northern tip of Zanzibar, famous for its nightlife and stunning beaches. Perfect for a lively beach experience. | Nungwi Beach, Nightlife and Beach Parties, Diving and Snorkeling, Local Artisans, Sunset Views |
| Kendwa | Known for its beautiful beaches and vibrant nightlife. It attracts a mix of beach lovers and party seekers, making it an excellent area for Airbnb hosting. | Kendwa Beach, Sunset Parties, Boat Rides, Snorkeling Trips, Resorts and Hotels |
Understanding Airbnb License Requirements & STR Laws in Michamvi (2026)
While Michamvi, Zanzibar South & Central, Tanzania currently shows low STR regulations, specific Airbnb license requirements might still exist or change. Always verify the latest short term rental regulations and Airbnb license requirements directly with local government authorities for Michamvi to ensure full compliance before hosting.
(Source: AirROI data, 2026, finding no licensed listings among those analyzed)
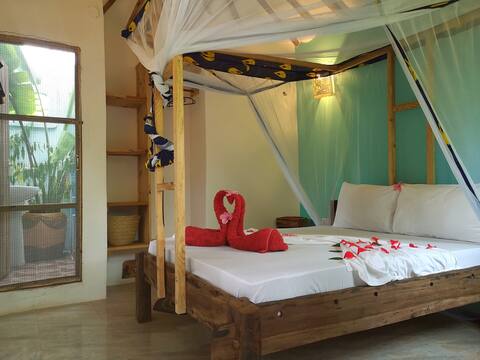
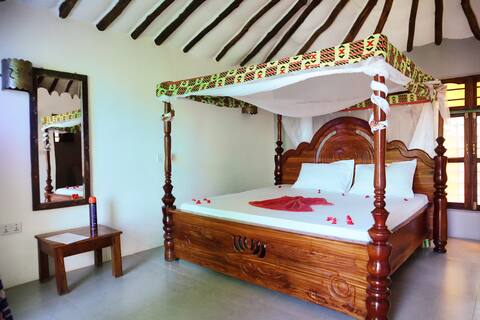
Top Performing Airbnb Properties in Michamvi (2026)
Benchmark your potential! Explore examples of top-performing Airbnb properties in Michamvibased on Trailing Twelve Month (TTM) revenue. Analyze their characteristics, revenue, occupancy rate, and ADR to understand what drives success in this market.

Saffron Villa. Rahisi Stay
Entire Place • 2 bedrooms

Casa Mysa: Private Villa & Pool
Entire Place • 4 bedrooms

Casa Mysa *Villa with pool* (Ground floor)
Entire Place • 2 bedrooms
Superior Double Bungalow @East coast Zanzibar 115
Private Room • 1 bedroom
Superior Double Bungalow @East coast Zanzibar 113
Private Room • 1 bedroom
Bungalow in Milele Lodge, Michamvi Kae
Private Room • 2 bedrooms
Note: Performance varies based on location, size, amenities, seasonality, and management quality. Data reflects the past 12 months.
Top Performing Airbnb Hosts in Michamvi (2026)
Learn from the best! This table showcases top-performing Airbnb hosts in Michamvi based on the number of properties managed and estimated total revenue over the past year. Analyze their scale and performance metrics.
| Host Name | Properties | Grossing Revenue | Stay Reviews | Avg Rating |
|---|---|---|---|---|
| Meg | 2 | $56,399 | 16 | 4.93/5.0 |
| Rahisi | 1 | $37,144 | 68 | 4.72/5.0 |
| Sagando Bungallows Zanzibar, T | 5 | $3,223 | 38 | 4.70/5.0 |
| Talib | 2 | $1,638 | 72 | 4.58/5.0 |
| Paola | 3 | $1,302 | 54 | 4.74/5.0 |
| Zakia | 1 | $977 | 3 | 4.67/5.0 |
| Ali | 1 | $822 | 5 | 5.00/5.0 |
| Sandra | 1 | $782 | 5 | 5.00/5.0 |
| Andrew | 1 | $356 | 100 | 4.65/5.0 |
| Regina | 1 | $86 | 16 | 4.88/5.0 |
Analyzing the strategies of top hosts, such as their property selection, pricing, and guest communication, can offer valuable lessons for optimizing your own Airbnb operations in Michamvi.
Dive Deeper: Advanced Michamvi STR Market Data (2026)
Ready to unlock more insights? AirROI provides access to advanced metrics and comprehensive Airbnb data for Michamvi. Explore detailed analytics beyond this report to refine your investment strategy, optimize pricing, and maximize your vacation rental profits.
Explore Advanced MetricsMichamvi Short-Term Rental Market Composition (2026): Property & Room Types
Room Type Distribution
Property Type Distribution
Market Composition Insights for Michamvi
- The Michamvi Airbnb market composition is heavily skewed towards Private Room listings, which make up 66.7% of the 18 active rentals. This indicates strong guest preference for privacy and space.
- Looking at the property type distribution in Michamvi, Hotel/Boutique properties are the most common (44.4%), reflecting the local real estate landscape.
- Houses represent a significant 38.9% portion, catering likely to families or larger groups.
- The presence of 44.4% Hotel/Boutique listings indicates integration with traditional hospitality.
Michamvi Airbnb Room Capacity Analysis (2026): Bedroom Distribution
Distribution of Listings by Number of Bedrooms
Room Capacity Insights for Michamvi
- The dominant room capacity in Michamvi is 1 bedroom listings, making up 61.1% of the market. This suggests a strong demand for properties suitable for couples or solo travelers.
- Together, 1 bedroom and 2 bedrooms properties represent 77.8% of the active Airbnb listings in Michamvi, indicating a high concentration in these sizes.
- With over half the market (61.1%) consisting of studios or 1-bedroom units, Michamvi is particularly well-suited for individuals or couples.
- Listings with 3+ bedrooms (5.6%) represent a smaller niche, potentially indicating an underserved market for larger group accommodations in Michamvi.
Michamvi Vacation Rental Guest Capacity Trends (2026)
Distribution of Listings by Guest Capacity
Guest Capacity Insights for Michamvi
- The most common guest capacity trend in Michamvi vacation rentals is listings accommodating 2 guests (61.1%). This suggests the primary traveler segment is likely couples or solo travelers.
- Properties designed for 2 guests and 4 guests dominate the Michamvi STR market, accounting for 72.2% of listings.
- A significant 66.7% of listings cater specifically to 1-2 guests, highlighting strong demand from couples and solo travelers in Michamvi.
- On average, properties in Michamvi are equipped to host 2.2 guests.
Michamvi Airbnb Booking Patterns (2026): Available vs. Booked Days
Available Days Distribution
Booked Days Distribution
Booking Pattern Insights for Michamvi
- The most common availability pattern in Michamvi falls within the 271-366 days range, representing 83.3% of listings. This suggests many properties have significant open periods on their calendars.
- Approximately 94.4% of listings show high availability (181+ days open annually), indicating potential for increased bookings or specific owner usage patterns.
- For booked days, the 1-30 days range is most frequent in Michamvi (66.7%), reflecting common guest stay durations or potential owner blocking patterns.
- A notable 5.6% of properties secure long booking periods (181+ days booked per year), highlighting successful long-term rental strategies or significant owner usage.
Michamvi Airbnb Minimum Stay Requirements Analysis
Distribution of Listings by Minimum Night Requirement
1 Night
17 listings
94.4% of total
30+ Nights
1 listings
5.6% of total
Key Insights
- The most prevalent minimum stay requirement in Michamvi is 1 Night, adopted by 94.4% of listings. This highlights the market's preference for shorter, flexible bookings.
- A strong majority (94.4%) of the Michamvi Airbnb data shows acceptance of very short stays (1-2 nights), indicating a dynamic, high-turnover market.
Recommendations
- Align with the market by considering a 1 Night minimum stay, as 94.4% of Michamvi hosts use this setting.
- Explore offering discounts for stays of 30+ nights to attract the 5.6% of the market seeking extended stays.
- Adjust minimum nights based on seasonality – potentially shorter during low season and longer during peak demand periods in Michamvi.
Michamvi Airbnb Cancellation Policy Trends Analysis (2026)
Flexible
10 listings
55.6% of total
Moderate
3 listings
16.7% of total
Firm
2 listings
11.1% of total
Strict
3 listings
16.7% of total
Cancellation Policy Insights for Michamvi
- The prevailing Airbnb cancellation policy trend in Michamvi is Flexible, used by 55.6% of listings.
- The market strongly favors guest-friendly terms, with 72.3% of listings offering Flexible or Moderate policies. This suggests guests in Michamvi may expect booking flexibility.
Recommendations for Hosts
- Consider adopting a Flexible policy to align with the 55.6% market standard in Michamvi.
- Given the high prevalence of Flexible policies (55.6%), offering this can enhance booking appeal, especially during shoulder seasons.
- Regularly review your cancellation policy against competitors and market demand shifts in Michamvi.
Michamvi STR Booking Lead Time Analysis (2026)
Average Booking Lead Time by Month
Booking Lead Time Insights for Michamvi
- The overall average booking lead time for vacation rentals in Michamvi is 44 days.
- Guests book furthest in advance for stays during August (average 120 days), likely coinciding with peak travel demand or local events.
- The shortest booking windows occur for stays in December (average 25 days), indicating more last-minute travel plans during this time.
- Seasonally, Summer (69 days avg.) sees the longest lead times, while Spring (37 days avg.) has the shortest, reflecting typical travel planning cycles.
Recommendations for Hosts
- Use the overall average lead time (44 days) as a baseline for your pricing and availability strategy in Michamvi.
- For August stays, consider implementing length-of-stay discounts or slightly higher rates for bookings made less than 120 days out to capitalize on advance planning.
- Target marketing efforts for the Summer season well in advance (at least 69 days) to capture early planners.
- Monitor your own booking lead times against these Michamvi averages to identify opportunities for dynamic pricing adjustments.
Popular & Essential Airbnb Amenities in Michamvi (2026)
Amenity Prevalence
Amenity Insights for Michamvi
- Essential amenities in Michamvi that guests expect include: Free parking on premises, Wifi. Lacking these (any) could significantly impact bookings.
- Popular amenities like Essentials, Long term stays allowed, Hot water are common but not universal. Offering these can provide a competitive edge.
Recommendations for Hosts
- Ensure your listing includes all essential amenities for Michamvi: Free parking on premises, Wifi.
- Consider adding popular differentiators like Essentials or Long term stays allowed to increase appeal.
- Highlight unique or less common amenities you offer (e.g., hot tub, dedicated workspace, EV charger) in your listing description and photos.
- Regularly check competitor amenities in Michamvi to stay competitive.
Michamvi Airbnb Guest Demographics & Profile Analysis (2026)
Guest Profile Summary for Michamvi
- The typical guest profile for Airbnb in Michamvi consists of predominantly international visitors (97%), with top international origins including Germany, typically belonging to the Post-2000s (Gen Z/Alpha) group (50%), primarily speaking English or Spanish.
- Domestic travelers account for 3.3% of guests.
- Key international markets include United States (20%) and Germany (13.3%).
- Top languages spoken are English (47.2%) followed by Spanish (11.1%).
- A significant demographic segment is the Post-2000s (Gen Z/Alpha) group, representing 50% of guests.
Recommendations for Hosts
- Focus marketing internationally, particularly towards travelers from Germany.
- Tailor amenities and listing descriptions to appeal to the dominant Post-2000s (Gen Z/Alpha) demographic (e.g., highlight fast WiFi, smart home features, local guides).
- Highlight unique local experiences or amenities relevant to the primary guest profile.
- Consider seasonal promotions aligned with peak travel times for key origin markets.
Nearby Short-Term Rental Market Comparison
How does the Michamvi Airbnb market stack up against its neighbors? Compare key performance metrics like average monthly revenue, ADR, and occupancy rates in surrounding areas to understand the broader regional STR landscape.
| Market | Active Properties | Monthly Revenue | Daily Rate | Avg. Occupancy |
|---|---|---|---|---|
| Dongwe | 26 | $3,620 | $288.57 | 48% |
| Bwejuu | 41 | $2,498 | $236.76 | 40% |
| Matemwe | 22 | $2,208 | $226.87 | 31% |
| Bweleo | 14 | $2,199 | $299.96 | 29% |
| Kigomane | 22 | $1,706 | $174.50 | 33% |
| Pingwe | 16 | $1,499 | $235.29 | 27% |
| Kiwengwa | 92 | $1,452 | $176.88 | 34% |
| Jambiani | 236 | $1,426 | $142.40 | 37% |
| Uroa | 10 | $1,258 | $305.49 | 26% |
| Zanzibar | 53 | $1,138 | $135.97 | 31% |