Tunapuna Airbnb Market Analysis 2026: Short Term Rental Data & Vacation Rental Statistics in Tunapuna-Piarco, Trinidad & Tobago
Is Airbnb profitable in Tunapuna in 2026? Explore comprehensive Airbnb analytics for Tunapuna, Tunapuna-Piarco, Trinidad & Tobago to uncover income potential. This 2026 STR market report for Tunapuna, based on AirROI data from February 2025 to January 2026, reveals key trends in the niche market of 42 active listings.
Whether you're considering an Airbnb investment in Tunapuna, optimizing your existing vacation rental, or exploring rental arbitrage opportunities, understanding the Tunapuna Airbnb data is crucial. Leveraging the low regulation environment is key to maximizing your short term rental income potential. Let's dive into the specifics.
Key Tunapuna Airbnb Performance Metrics Overview
Monthly Airbnb Revenue Variations & Income Potential in Tunapuna (2026)
Understanding the monthly revenue variations for Airbnb listings in Tunapuna is key to maximizing your short term rental income potential. Seasonality significantly impacts earnings. Our analysis, based on data from the past 12 months, shows that the peak revenue month for STRs in Tunapuna is typically July, while September often presents the lowest earnings, highlighting opportunities for strategic pricing adjustments during shoulder and low seasons. Explore the typical Airbnb income in Tunapuna across different performance tiers:
- Best-in-class properties (Top 10%) achieve $2,240+ monthly, often utilizing dynamic pricing and superior guest experiences.
- Strong performing properties (Top 25%) earn $951 or more, indicating effective management and desirable locations/amenities.
- Typical properties (Median) generate around $394 per month, representing the average market performance.
- Entry-level properties (Bottom 25%) see earnings around $188, often with potential for optimization.
Average Monthly Airbnb Earnings Trend in Tunapuna
Tunapuna Airbnb Occupancy Rate Trends (2026)
Maximize your bookings by understanding the Tunapuna STR occupancy trends. Seasonal demand shifts significantly influence how often properties are booked. Typically, Octobersees the highest demand (peak season occupancy), while November experiences the lowest (low season). Effective strategies, like adjusting minimum stays or offering promotions, can boost occupancy during slower periods. Here's how different property tiers perform in Tunapuna:
- Best-in-class properties (Top 10%) achieve 48%+ occupancy, indicating high desirability and potentially optimized availability.
- Strong performing properties (Top 25%) maintain 31% or higher occupancy, suggesting good market fit and guest satisfaction.
- Typical properties (Median) have an occupancy rate around 16%.
- Entry-level properties (Bottom 25%) average 7% occupancy, potentially facing higher vacancy.
Average Monthly Occupancy Rate Trend in Tunapuna
Average Daily Rate (ADR) Airbnb Trends in Tunapuna (2026)
Effective short term rental pricing strategy in Tunapuna involves understanding monthly ADR fluctuations. The Average Daily Rate (ADR) for Airbnb in Tunapuna typically peaks in August and dips lowest during October. Leveraging Airbnb dynamic pricing tools or strategies based on this seasonality can significantly boost revenue. Here's a look at the typical nightly rates achieved:
- Best-in-class properties (Top 10%) command rates of $165+ per night, often due to premium features or locations.
- Strong performing properties (Top 25%) achieve nightly rates of $112 or more.
- Typical properties (Median) charge around $67 per night.
- Entry-level properties (Bottom 25%) earn around $60 per night.
Average Daily Rate (ADR) Trend by Month in Tunapuna
Get Live Tunapuna Market Intelligence 👇

Explore Real-time Analytics
Airbnb Seasonality Analysis & Trends in Tunapuna (2026)
Peak Season (July, October, December)
- Revenue averages $1,188 per month
- Occupancy rates average 25.6%
- Daily rates average $97
Shoulder Season
- Revenue averages $758 per month
- Occupancy maintains around 19.4%
- Daily rates hold near $98
Low Season (February, March, September)
- Revenue drops to average $590 per month
- Occupancy decreases to average 23.5%
- Daily rates adjust to average $97
Seasonality Insights for Tunapuna
- The Airbnb seasonality in Tunapuna shows highly seasonal trends requiring careful strategy. While the sections above show seasonal averages, it's also insightful to look at the extremes:
- During the high season, the absolute peak month showcases Tunapuna's highest earning potential, with monthly revenues capable of climbing to $1,297, occupancy reaching a high of 31.7%, and ADRs peaking at $101.
- Conversely, the slowest single month of the year, typically falling within the low season, marks the market's lowest point. In this month, revenue might dip to $542, occupancy could drop to 15.7%, and ADRs may adjust down to $94.
- Understanding both the seasonal averages and these monthly peaks and troughs in revenue, occupancy, and ADR is crucial for maximizing your Airbnb profit potential in Tunapuna.
Seasonal Strategies for Maximizing Profit
- Peak Season: Maximize revenue through premium pricing and potentially longer minimum stays. Ensure high availability.
- Low Season: Offer competitive pricing, special promotions (e.g., extended stay discounts), and flexible cancellation policies. Target off-season travelers like remote workers or budget-conscious guests.
- Shoulder Seasons: Implement dynamic pricing that balances peak and low rates. Target weekend travelers or specific events. Offer slightly more flexible terms than peak season.
- Regularly analyze your own performance against these Tunapuna seasonality benchmarks and adjust your pricing and availability strategy accordingly.
Best Areas for Airbnb Investment in Tunapuna (2026)
Exploring the top neighborhoods for short-term rentals in Tunapuna? This section highlights key areas, outlining why they are attractive for hosts and guests, along with notable local attractions. Consider these locations based on your target guest profile and investment strategy.
| Neighborhood / Area | Why Host Here? (Target Guests & Appeal) | Key Attractions & Landmarks |
|---|---|---|
| Tunapuna Central | The bustling heart of Tunapuna, featuring local markets, shops, and vibrant street life. A great spot for travelers looking for an authentic Trinidad experience. | Tunapuna Market, The Tunapuna Temple, Royal Botanic Gardens, Local eateries, Shopping areas |
| Piarco | Home to the Piarco International Airport, making it ideal for transit travelers. Offers proximity to nearby attractions and an easy commute to Port of Spain. | Piarco International Airport, Trinidad and Tobago Golf Course, Nearby nature trails, Local dining options |
| Curepe | A developing area close to the University of the West Indies, attracting students and academic visitors. It has a mix of residential and commercial areas. | UWI St. Augustine Campus, Curepe Junction, Local cafes, Cultural activities |
| St. Augustine | A lively neighborhood with a mix of residential areas and entertainment options. Close to the university and several dining establishments. | The National University of Trinidad and Tobago, Local shopping centers, Restaurants and bars, Cultural sites |
| D'Abadie | A quieter residential area offering a more local Trinidad experience. Attractive for families and those looking for tranquility near urban conveniences. | Local parks, Community centers, Nearby shopping options, Cultural experiences |
| Arima | A significant town with a rich history and culture, known for its carnival festivities. Attracts visitors searching for cultural experiences. | Arima Velodrome, Local festivals, Shopping areas, Historical sites |
| Chaguanas | The largest town in Trinidad, offering commercial and entertainment options. Popular for short-term rental due to ongoing events and attractions. | Chaguanas Market, Local festivals, Cultural hubs, Shopping malls |
| Maracas/St. Joseph | Close to the famous Maracas Beach, this area is perfect for guests looking for beach access and stunning views of nature. | Maracas Bay Beach, Hiking trails, Local food spots, Natural scenery |
Understanding Airbnb License Requirements & STR Laws in Tunapuna (2026)
While Tunapuna, Tunapuna-Piarco, Trinidad & Tobago currently shows low STR regulations, specific Airbnb license requirements might still exist or change. Always verify the latest short term rental regulations and Airbnb license requirements directly with local government authorities for Tunapuna to ensure full compliance before hosting.
(Source: AirROI data, 2026, finding no licensed listings among those analyzed)
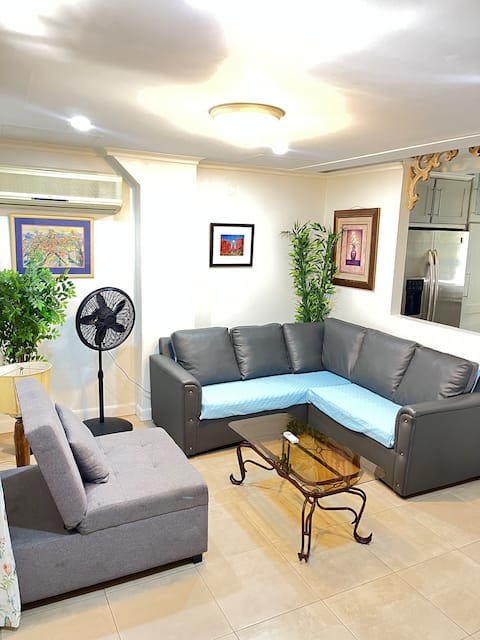
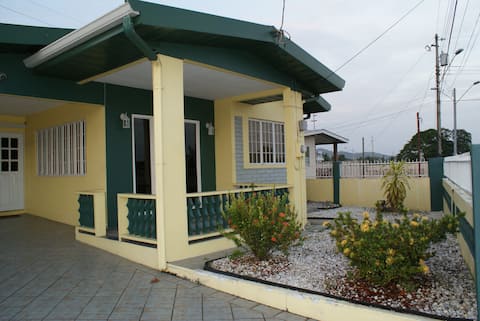
Top Performing Airbnb Properties in Tunapuna (2026)
Benchmark your potential! Explore examples of top-performing Airbnb properties in Tunapunabased on Trailing Twelve Month (TTM) revenue. Analyze their characteristics, revenue, occupancy rate, and ADR to understand what drives success in this market.

The Prestige
Entire Place • 4 bedrooms

What a feeling!!!
Entire Place • 2 bedrooms
Comfortable 3 Bedroom Townhouse great location
Entire Place • 3 bedrooms
JoJo's Place
Entire Place • 3 bedrooms

The Tower View
Entire Place • 3 bedrooms

Cosy St Augustine Apartment
Entire Place • 1 bedroom
Note: Performance varies based on location, size, amenities, seasonality, and management quality. Data reflects the past 12 months.
Top Performing Airbnb Hosts in Tunapuna (2026)
Learn from the best! This table showcases top-performing Airbnb hosts in Tunapuna based on the number of properties managed and estimated total revenue over the past year. Analyze their scale and performance metrics.
| Host Name | Properties | Grossing Revenue | Stay Reviews | Avg Rating |
|---|---|---|---|---|
| Damien | 1 | $28,880 | 57 | 4.91/5.0 |
| Jefferson | 1 | $20,079 | 85 | 4.91/5.0 |
| Karel | 1 | $12,889 | 73 | 4.68/5.0 |
| Ryan | 8 | $6,111 | 30 | 4.61/5.0 |
| Rusklin | 1 | $5,862 | 20 | 4.60/5.0 |
| The | 1 | $5,042 | 1 | Not Rated |
| Rochelle | 1 | $4,758 | 14 | 4.86/5.0 |
| Cathy Ann | 3 | $4,577 | 54 | 4.74/5.0 |
| Daniel | 1 | $4,413 | 4 | 3.00/5.0 |
| Reggie | 2 | $4,284 | 82 | 4.69/5.0 |
Analyzing the strategies of top hosts, such as their property selection, pricing, and guest communication, can offer valuable lessons for optimizing your own Airbnb operations in Tunapuna.
Dive Deeper: Advanced Tunapuna STR Market Data (2026)
Ready to unlock more insights? AirROI provides access to advanced metrics and comprehensive Airbnb data for Tunapuna. Explore detailed analytics beyond this report to refine your investment strategy, optimize pricing, and maximize your vacation rental profits.
Explore Advanced MetricsTunapuna Short-Term Rental Market Composition (2026): Property & Room Types
Room Type Distribution
Property Type Distribution
Market Composition Insights for Tunapuna
- The Tunapuna Airbnb market composition is heavily skewed towards Entire Home/Apt listings, which make up 64.3% of the 42 active rentals. This indicates strong guest preference for privacy and space.
- However, a notable 35.7% share for Private Rooms suggests opportunities for budget-conscious travelers or hosts renting out spare rooms.
- Looking at the property type distribution in Tunapuna, Apartment/Condo properties are the most common (54.8%), reflecting the local real estate landscape.
- Houses represent a significant 28.6% portion, catering likely to families or larger groups.
- The presence of 14.3% Hotel/Boutique listings indicates integration with traditional hospitality.
- Smaller segments like others (combined 2.4%) offer potential for unique stay experiences.
Tunapuna Airbnb Room Capacity Analysis (2026): Bedroom Distribution
Distribution of Listings by Number of Bedrooms
Room Capacity Insights for Tunapuna
- The dominant room capacity in Tunapuna is 1 bedroom listings, making up 47.6% of the market. This suggests a strong demand for properties suitable for couples or solo travelers.
- Together, 1 bedroom and 2 bedrooms properties represent 64.3% of the active Airbnb listings in Tunapuna, indicating a high concentration in these sizes.
Tunapuna Vacation Rental Guest Capacity Trends (2026)
Distribution of Listings by Guest Capacity
Guest Capacity Insights for Tunapuna
- The most common guest capacity trend in Tunapuna vacation rentals is listings accommodating 2 guests (31%). This suggests the primary traveler segment is likely couples or solo travelers.
- Properties designed for 2 guests and 3 guests dominate the Tunapuna STR market, accounting for 45.3% of listings.
- 16.7% of properties accommodate 6+ guests, serving the market segment for larger families or group travel in Tunapuna.
- On average, properties in Tunapuna are equipped to host 2.6 guests.
Tunapuna Airbnb Booking Patterns (2026): Available vs. Booked Days
Available Days Distribution
Booked Days Distribution
Booking Pattern Insights for Tunapuna
- The most common availability pattern in Tunapuna falls within the 271-366 days range, representing 95.2% of listings. This suggests many properties have significant open periods on their calendars.
- Approximately 100.0% of listings show high availability (181+ days open annually), indicating potential for increased bookings or specific owner usage patterns.
- For booked days, the 1-30 days range is most frequent in Tunapuna (76.2%), reflecting common guest stay durations or potential owner blocking patterns.
Tunapuna Airbnb Minimum Stay Requirements Analysis
Distribution of Listings by Minimum Night Requirement
1 Night
16 listings
38.1% of total
2 Nights
16 listings
38.1% of total
3 Nights
2 listings
4.8% of total
4-6 Nights
1 listings
2.4% of total
30+ Nights
7 listings
16.7% of total
Key Insights
- The most prevalent minimum stay requirement in Tunapuna is 1 Night, adopted by 38.1% of listings. This highlights the market's preference for shorter, flexible bookings.
- A strong majority (76.2%) of the Tunapuna Airbnb data shows acceptance of very short stays (1-2 nights), indicating a dynamic, high-turnover market.
- A significant segment (16.7%) caters to monthly stays (30+ nights) in Tunapuna, pointing to opportunities in the extended-stay market.
Recommendations
- Align with the market by considering a 1 Night minimum stay, as 38.1% of Tunapuna hosts use this setting.
- Explore offering discounts for stays of 30+ nights to attract the 16.7% of the market seeking extended stays.
- Adjust minimum nights based on seasonality – potentially shorter during low season and longer during peak demand periods in Tunapuna.
Tunapuna Airbnb Cancellation Policy Trends Analysis (2026)
Flexible
24 listings
57.1% of total
Moderate
4 listings
9.5% of total
Firm
9 listings
21.4% of total
Strict
5 listings
11.9% of total
Cancellation Policy Insights for Tunapuna
- The prevailing Airbnb cancellation policy trend in Tunapuna is Flexible, used by 57.1% of listings.
- There's a relatively balanced mix between guest-friendly (66.6%) and stricter (33.3%) policies, offering choices for different guest needs.
Recommendations for Hosts
- Consider adopting a Flexible policy to align with the 57.1% market standard in Tunapuna.
- Given the high prevalence of Flexible policies (57.1%), offering this can enhance booking appeal, especially during shoulder seasons.
- Using a Strict policy might deter some guests, as only 11.9% of listings use it. Evaluate if potential revenue protection outweighs possible lower booking rates.
- Regularly review your cancellation policy against competitors and market demand shifts in Tunapuna.
Tunapuna STR Booking Lead Time Analysis (2026)
Average Booking Lead Time by Month
Booking Lead Time Insights for Tunapuna
- The overall average booking lead time for vacation rentals in Tunapuna is 55 days.
- Guests book furthest in advance for stays during February (average 89 days), likely coinciding with peak travel demand or local events.
- The shortest booking windows occur for stays in September (average 2 days), indicating more last-minute travel plans during this time.
- Seasonally, Winter (57 days avg.) sees the longest lead times, while Fall (10 days avg.) has the shortest, reflecting typical travel planning cycles.
Recommendations for Hosts
- Use the overall average lead time (55 days) as a baseline for your pricing and availability strategy in Tunapuna.
- For February stays, consider implementing length-of-stay discounts or slightly higher rates for bookings made less than 89 days out to capitalize on advance planning.
- During September, focus on last-minute booking availability and promotions, as guests book with very short notice (2 days avg.).
- Target marketing efforts for the Winter season well in advance (at least 57 days) to capture early planners.
- Monitor your own booking lead times against these Tunapuna averages to identify opportunities for dynamic pricing adjustments.
Popular & Essential Airbnb Amenities in Tunapuna (2026)
Amenity Prevalence
Amenity Insights for Tunapuna
- Essential amenities in Tunapuna that guests expect include: Wifi. Lacking these (this) could significantly impact bookings.
- Popular amenities like Air conditioning, Kitchen, TV are common but not universal. Offering these can provide a competitive edge.
Recommendations for Hosts
- Ensure your listing includes all essential amenities for Tunapuna: Wifi.
- Consider adding popular differentiators like Air conditioning or Kitchen to increase appeal.
- Highlight unique or less common amenities you offer (e.g., hot tub, dedicated workspace, EV charger) in your listing description and photos.
- Regularly check competitor amenities in Tunapuna to stay competitive.
Tunapuna Airbnb Guest Demographics & Profile Analysis (2026)
Guest Profile Summary for Tunapuna
- The typical guest profile for Airbnb in Tunapuna consists of predominantly international visitors (100%), with top international origins including Canada, typically belonging to the Post-2000s (Gen Z/Alpha) group (50%), primarily speaking English or Spanish.
- Domestic travelers account for 0.0% of guests.
- Key international markets include United States (60.6%) and Canada (9.1%).
- Top languages spoken are English (66.7%) followed by Spanish (16.7%).
- A significant demographic segment is the Post-2000s (Gen Z/Alpha) group, representing 50% of guests.
Recommendations for Hosts
- Focus marketing internationally, particularly towards travelers from Canada.
- Tailor amenities and listing descriptions to appeal to the dominant Post-2000s (Gen Z/Alpha) demographic (e.g., highlight fast WiFi, smart home features, local guides).
- Highlight unique local experiences or amenities relevant to the primary guest profile.
- Consider seasonal promotions aligned with peak travel times for key origin markets.
Nearby Short-Term Rental Market Comparison
How does the Tunapuna Airbnb market stack up against its neighbors? Compare key performance metrics like average monthly revenue, ADR, and occupancy rates in surrounding areas to understand the broader regional STR landscape.
| Market | Active Properties | Monthly Revenue | Daily Rate | Avg. Occupancy |
|---|---|---|---|---|
| Mount Irvine | 14 | $2,573 | $322.13 | 36% |
| Buccoo | 102 | $1,916 | $213.50 | 34% |
| Scarborough | 154 | $1,807 | $248.32 | 29% |
| Old Grange | 21 | $1,798 | $261.29 | 32% |
| Crown Point | 187 | $1,727 | $186.93 | 34% |
| Lance Aux Epines | 72 | $1,722 | $292.99 | 31% |
| Black Rock | 50 | $1,717 | $275.54 | 30% |
| Carnbee | 40 | $1,556 | $251.49 | 26% |
| Paramin | 12 | $1,534 | $154.02 | 36% |
| Plymouth | 20 | $1,301 | $249.26 | 25% |