Golem Airbnb Market Analysis 2026: Short Term Rental Data & Vacation Rental Statistics in Tirana County, Albania
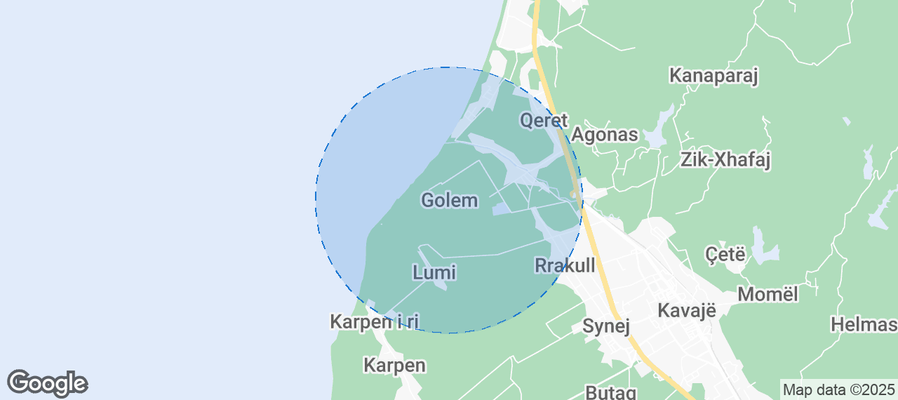
Is Airbnb profitable in Golem in 2026? Explore comprehensive Airbnb analytics for Golem, Tirana County, Albania to uncover income potential. This 2026 STR market report for Golem, based on AirROI data from February 2025 to January 2026, reveals key trends in the niche market of 49 active listings.
Whether you're considering an Airbnb investment in Golem, optimizing your existing vacation rental, or exploring rental arbitrage opportunities, understanding the Golem Airbnb data is crucial. Leveraging the low regulation environment is key to maximizing your short term rental income potential. Let's dive into the specifics.
Key Golem Airbnb Performance Metrics Overview
Monthly Airbnb Revenue Variations & Income Potential in Golem (2026)
Understanding the monthly revenue variations for Airbnb listings in Golem is key to maximizing your short term rental income potential. Seasonality significantly impacts earnings. Our analysis, based on data from the past 12 months, shows that the peak revenue month for STRs in Golem is typically August, while January often presents the lowest earnings, highlighting opportunities for strategic pricing adjustments during shoulder and low seasons. Explore the typical Airbnb income in Golem across different performance tiers:
- Best-in-class properties (Top 10%) achieve $2,235+ monthly, often utilizing dynamic pricing and superior guest experiences.
- Strong performing properties (Top 25%) earn $1,283 or more, indicating effective management and desirable locations/amenities.
- Typical properties (Median) generate around $729 per month, representing the average market performance.
- Entry-level properties (Bottom 25%) see earnings around $358, often with potential for optimization.
Average Monthly Airbnb Earnings Trend in Golem
Golem Airbnb Occupancy Rate Trends (2026)
Maximize your bookings by understanding the Golem STR occupancy trends. Seasonal demand shifts significantly influence how often properties are booked. Typically, Augustsees the highest demand (peak season occupancy), while January experiences the lowest (low season). Effective strategies, like adjusting minimum stays or offering promotions, can boost occupancy during slower periods. Here's how different property tiers perform in Golem:
- Best-in-class properties (Top 10%) achieve 58%+ occupancy, indicating high desirability and potentially optimized availability.
- Strong performing properties (Top 25%) maintain 44% or higher occupancy, suggesting good market fit and guest satisfaction.
- Typical properties (Median) have an occupancy rate around 29%.
- Entry-level properties (Bottom 25%) average 15% occupancy, potentially facing higher vacancy.
Average Monthly Occupancy Rate Trend in Golem
Average Daily Rate (ADR) Airbnb Trends in Golem (2026)
Effective short term rental pricing strategy in Golem involves understanding monthly ADR fluctuations. The Average Daily Rate (ADR) for Airbnb in Golem typically peaks in April and dips lowest during October. Leveraging Airbnb dynamic pricing tools or strategies based on this seasonality can significantly boost revenue. Here's a look at the typical nightly rates achieved:
- Best-in-class properties (Top 10%) command rates of $257+ per night, often due to premium features or locations.
- Strong performing properties (Top 25%) achieve nightly rates of $101 or more.
- Typical properties (Median) charge around $75 per night.
- Entry-level properties (Bottom 25%) earn around $53 per night.
Average Daily Rate (ADR) Trend by Month in Golem
Get Live Golem Market Intelligence 👇
Explore Real-time Analytics
Airbnb Seasonality Analysis & Trends in Golem (2026)
Peak Season (August, June, July)
- Revenue averages $1,935 per month
- Occupancy rates average 48.0%
- Daily rates average $113
Shoulder Season
- Revenue averages $757 per month
- Occupancy maintains around 22.7%
- Daily rates hold near $86
Low Season (February, March, April)
- Revenue drops to average $0 per month
- Occupancy decreases to average 0.0%
- Daily rates adjust to average $113
Seasonality Insights for Golem
- The Airbnb seasonality in Golem shows highly seasonal trends requiring careful strategy. While the sections above show seasonal averages, it's also insightful to look at the extremes:
- During the high season, the absolute peak month showcases Golem's highest earning potential, with monthly revenues capable of climbing to $2,022, occupancy reaching a high of 55.0%, and ADRs peaking at $114.
- Conversely, the slowest single month of the year, typically falling within the low season, marks the market's lowest point. In this month, revenue might dip to $0, occupancy could drop to 0.0%, and ADRs may adjust down to $76.
- Understanding both the seasonal averages and these monthly peaks and troughs in revenue, occupancy, and ADR is crucial for maximizing your Airbnb profit potential in Golem.
Seasonal Strategies for Maximizing Profit
- Peak Season: Maximize revenue through premium pricing and potentially longer minimum stays. Ensure high availability.
- Low Season: Offer competitive pricing, special promotions (e.g., extended stay discounts), and flexible cancellation policies. Target off-season travelers like remote workers or budget-conscious guests.
- Shoulder Seasons: Implement dynamic pricing that balances peak and low rates. Target weekend travelers or specific events. Offer slightly more flexible terms than peak season.
- Regularly analyze your own performance against these Golem seasonality benchmarks and adjust your pricing and availability strategy accordingly.
Best Areas for Airbnb Investment in Golem (2026)
Exploring the top neighborhoods for short-term rentals in Golem? This section highlights key areas, outlining why they are attractive for hosts and guests, along with notable local attractions. Consider these locations based on your target guest profile and investment strategy.
| Neighborhood / Area | Why Host Here? (Target Guests & Appeal) | Key Attractions & Landmarks |
|---|---|---|
| Golem Beach | A popular seaside destination known for its beautiful beaches and resorts. Ideal for tourists looking to enjoy sun, sea, and sand, making it a prime spot for Airbnb hosting. | Golem Beach, Kavaja Beach, Lalzi Bay, Durres City, Vore Beach, local seafood restaurants |
| Kavaja | A small town close to Golem with historical sites and a quieter beach experience. Great for families and those seeking relaxation, providing an alternative to busier tourist areas. | Kavaja Beach, Jale Beach, historical ruins, local markets, beachfront cafes |
| Durres | As one of the oldest cities in Albania, it offers a rich history and proximity to the Adriatic Sea. Perfect for guests interested in culture, history, and beach activities. | Amphitheatre of Durres, Durres Archaeological Museum, Durres Beach, Royal Villa of Durres, local nightlife |
| Lalzi Bay | A tranquil bay known for its stunning natural beauty and luxurious villas. Attracting vacationers looking for peace and relaxation away from crowded beaches. | Lalzi Bay Beach, Nature trails, lighthouse views, local fish restaurants, private beach clubs |
| Rruga Pavaresia | The main thoroughfare in Golem with numerous restaurants and shops. A lively spot popular amongst tourists for its vibrant atmosphere and easy beach access. | Pavaresia Beach, restaurants and cafes, nightlife spots, local markets, beach bars |
| Shkembi i Kavajes | Known for its cliffs and picturesque views, it's a hidden gem for adventurous travelers and nature lovers who want to enjoy stunning landscapes. | Shkembi i Kavajes Beach, hiking trails, cliff views, local wildlife, water sports activities |
| Shtikë | A quieter area with a family-friendly atmosphere, ideal for those seeking a more laid-back beach experience away from the bustle of Golem. | Shtikë Beach, family attractions, picnic areas, friendly local community, fishing spots |
| Krishtër | A scenic area known for its natural beauty and proximity to both the beach and the mountains. Attracts visitors looking for outdoor activities and tranquility. | nature parks, hiking trails, local wildlife, rapid rivers, beach access nearby |
Understanding Airbnb License Requirements & STR Laws in Golem (2026)
While Golem, Tirana County, Albania currently shows low STR regulations, specific Airbnb license requirements might still exist or change. Always verify the latest short term rental regulations and Airbnb license requirements directly with local government authorities for Golem to ensure full compliance before hosting.
(Source: AirROI data, 2026, finding no licensed listings among those analyzed)
Top Performing Airbnb Properties in Golem (2026)
Benchmark your potential! Explore examples of top-performing Airbnb properties in Golembased on Trailing Twelve Month (TTM) revenue. Analyze their characteristics, revenue, occupancy rate, and ADR to understand what drives success in this market.
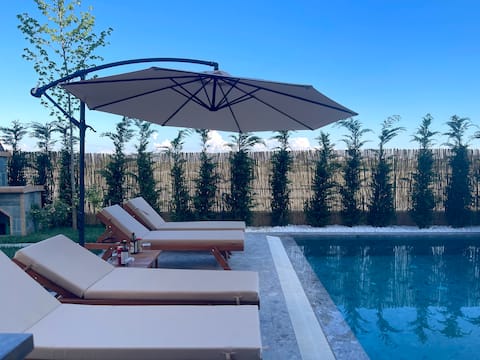
Pearl Pool Luxury Villa
Entire Place • 3 bedrooms
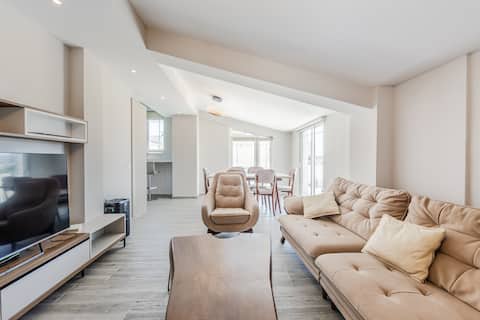
Rooftop Apartment with Private Pool
Entire Place • 4 bedrooms
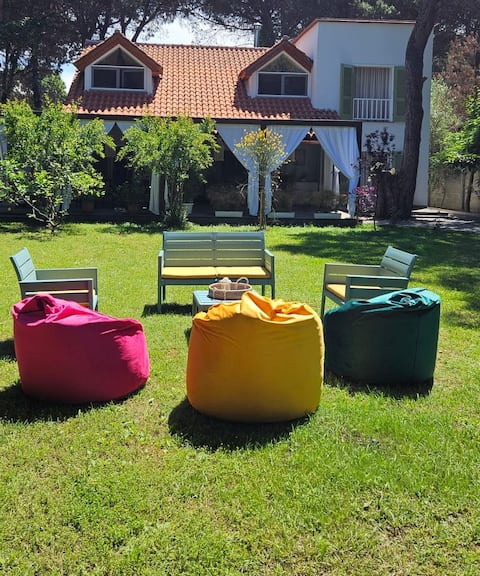
Villa Pinea Mare
Entire Place • 4 bedrooms
Villa Zen Oasis
Entire Place • 3 bedrooms
Sunflower Apartment
Entire Place • 2 bedrooms
Marevista Escape
Entire Place • 1 bedroom
Note: Performance varies based on location, size, amenities, seasonality, and management quality. Data reflects the past 12 months.
Top Performing Airbnb Hosts in Golem (2026)
Learn from the best! This table showcases top-performing Airbnb hosts in Golem based on the number of properties managed and estimated total revenue over the past year. Analyze their scale and performance metrics.
| Host Name | Properties | Grossing Revenue | Stay Reviews | Avg Rating |
|---|---|---|---|---|
| Circlebnb | 1 | $63,541 | 19 | 4.84/5.0 |
| PikHost | 9 | $47,853 | 107 | 4.79/5.0 |
| Premium Selection | 6 | $46,474 | 23 | 4.63/5.0 |
| Ervin | 1 | $24,234 | 3 | 4.67/5.0 |
| Adi | 1 | $15,984 | 3 | 5.00/5.0 |
| Al Property Management | 1 | $12,781 | 3 | 3.00/5.0 |
| Gjoka | 1 | $12,032 | 16 | 5.00/5.0 |
| Luis | 1 | $11,002 | 12 | 4.58/5.0 |
| Fredrik Och Tove | 1 | $10,414 | 3 | 5.00/5.0 |
| Love Albania Airbnb | 1 | $7,540 | 50 | 4.98/5.0 |
Analyzing the strategies of top hosts, such as their property selection, pricing, and guest communication, can offer valuable lessons for optimizing your own Airbnb operations in Golem.
Dive Deeper: Advanced Golem STR Market Data (2026)
Ready to unlock more insights? AirROI provides access to advanced metrics and comprehensive Airbnb data for Golem. Explore detailed analytics beyond this report to refine your investment strategy, optimize pricing, and maximize your vacation rental profits.
Explore Advanced MetricsGolem Short-Term Rental Market Composition (2026): Property & Room Types
Room Type Distribution
Property Type Distribution
Market Composition Insights for Golem
- The Golem Airbnb market composition is heavily skewed towards Entire Home/Apt listings, which make up 95.9% of the 49 active rentals. This indicates strong guest preference for privacy and space.
- Looking at the property type distribution in Golem, Apartment/Condo properties are the most common (85.7%), reflecting the local real estate landscape.
- Smaller segments like unique stays (combined 2.0%) offer potential for unique stay experiences.
Golem Airbnb Room Capacity Analysis (2026): Bedroom Distribution
Distribution of Listings by Number of Bedrooms
Room Capacity Insights for Golem
- The dominant room capacity in Golem is 1 bedroom listings, making up 55.1% of the market. This suggests a strong demand for properties suitable for couples or solo travelers.
- Together, 1 bedroom and 2 bedrooms properties represent 77.5% of the active Airbnb listings in Golem, indicating a high concentration in these sizes.
- With over half the market (55.1%) consisting of studios or 1-bedroom units, Golem is particularly well-suited for individuals or couples.
Golem Vacation Rental Guest Capacity Trends (2026)
Distribution of Listings by Guest Capacity
Guest Capacity Insights for Golem
- The most common guest capacity trend in Golem vacation rentals is listings accommodating 4 guests (40.8%). This suggests the primary traveler segment is likely small families or groups.
- Properties designed for 4 guests and 2 guests dominate the Golem STR market, accounting for 57.1% of listings.
- 20.5% of properties accommodate 6+ guests, serving the market segment for larger families or group travel in Golem.
- On average, properties in Golem are equipped to host 4.2 guests.
Golem Airbnb Booking Patterns (2026): Available vs. Booked Days
Available Days Distribution
Booked Days Distribution
Booking Pattern Insights for Golem
- The most common availability pattern in Golem falls within the 271-366 days range, representing 87.8% of listings. This suggests many properties have significant open periods on their calendars.
- Approximately 100.0% of listings show high availability (181+ days open annually), indicating potential for increased bookings or specific owner usage patterns.
- For booked days, the 31-90 days range is most frequent in Golem (59.2%), reflecting common guest stay durations or potential owner blocking patterns.
Golem Airbnb Minimum Stay Requirements Analysis
Distribution of Listings by Minimum Night Requirement
1 Night
15 listings
30.6% of total
2 Nights
2 listings
4.1% of total
3 Nights
7 listings
14.3% of total
4-6 Nights
3 listings
6.1% of total
30+ Nights
22 listings
44.9% of total
Key Insights
- The most prevalent minimum stay requirement in Golem is 30+ Nights, adopted by 44.9% of listings. This highlights the market's preference for longer commitments.
- A significant segment (44.9%) caters to monthly stays (30+ nights) in Golem, pointing to opportunities in the extended-stay market.
Recommendations
- Align with the market by considering a 30+ Nights minimum stay, as 44.9% of Golem hosts use this setting.
- Explore offering discounts for stays of 30+ nights to attract the 44.9% of the market seeking extended stays.
- Adjust minimum nights based on seasonality – potentially shorter during low season and longer during peak demand periods in Golem.
Golem Airbnb Cancellation Policy Trends Analysis (2026)
Super Strict 60 Days
1 listings
2% of total
Limited
1 listings
2% of total
Flexible
18 listings
36.7% of total
Moderate
3 listings
6.1% of total
Firm
24 listings
49% of total
Strict
2 listings
4.1% of total
Cancellation Policy Insights for Golem
- The prevailing Airbnb cancellation policy trend in Golem is Firm, used by 49% of listings.
- A majority (53.1%) of hosts in Golem utilize Firm or Strict policies, indicating a market where hosts prioritize booking security.
- Strict cancellation policies are quite rare (4.1%), potentially making listings with this policy less competitive unless justified by high demand or property type.
Recommendations for Hosts
- Consider adopting a Firm policy to align with the 49% market standard in Golem.
- Using a Strict policy might deter some guests, as only 4.1% of listings use it. Evaluate if potential revenue protection outweighs possible lower booking rates.
- Regularly review your cancellation policy against competitors and market demand shifts in Golem.
Golem STR Booking Lead Time Analysis (2026)
Average Booking Lead Time by Month
Booking Lead Time Insights for Golem
- The overall average booking lead time for vacation rentals in Golem is 20 days.
- Guests book furthest in advance for stays during September (average 39 days), likely coinciding with peak travel demand or local events.
- The shortest booking windows occur for stays in April (average 0 days), indicating more last-minute travel plans during this time.
- Seasonally, Fall (27 days avg.) sees the longest lead times, while Spring (1 days avg.) has the shortest, reflecting typical travel planning cycles.
Recommendations for Hosts
- Use the overall average lead time (20 days) as a baseline for your pricing and availability strategy in Golem.
- For September stays, consider implementing length-of-stay discounts or slightly higher rates for bookings made less than 39 days out to capitalize on advance planning.
- During April, focus on last-minute booking availability and promotions, as guests book with very short notice (0 days avg.).
- Target marketing efforts for the Fall season well in advance (at least 27 days) to capture early planners.
- Monitor your own booking lead times against these Golem averages to identify opportunities for dynamic pricing adjustments.
Popular & Essential Airbnb Amenities in Golem (2026)
Amenity Prevalence
Amenity Insights for Golem
- Essential amenities in Golem that guests expect include: Wifi, Air conditioning, TV, Kitchen. Lacking these (any) could significantly impact bookings.
- Popular amenities like Hot water, Hair dryer, Clothing storage are common but not universal. Offering these can provide a competitive edge.
Recommendations for Hosts
- Ensure your listing includes all essential amenities for Golem: Wifi, Air conditioning, TV, Kitchen.
- Prioritize adding missing essentials: Air conditioning, TV, Kitchen.
- Consider adding popular differentiators like Hot water or Hair dryer to increase appeal.
- Highlight unique or less common amenities you offer (e.g., hot tub, dedicated workspace, EV charger) in your listing description and photos.
- Regularly check competitor amenities in Golem to stay competitive.
Golem Airbnb Guest Demographics & Profile Analysis (2026)
Guest Profile Summary for Golem
- The typical guest profile for Airbnb in Golem consists of predominantly international visitors (96%), with top international origins including France, typically belonging to the Post-2000s (Gen Z/Alpha) group (50%), primarily speaking English or German.
- Domestic travelers account for 4.4% of guests.
- Key international markets include Germany (25.2%) and France (18.5%).
- Top languages spoken are English (37.4%) followed by German (12.8%).
- A significant demographic segment is the Post-2000s (Gen Z/Alpha) group, representing 50% of guests.
Recommendations for Hosts
- Focus marketing internationally, particularly towards travelers from France.
- Tailor amenities and listing descriptions to appeal to the dominant Post-2000s (Gen Z/Alpha) demographic (e.g., highlight fast WiFi, smart home features, local guides).
- Highlight unique local experiences or amenities relevant to the primary guest profile.
- Consider seasonal promotions aligned with peak travel times for key origin markets.
Nearby Short-Term Rental Market Comparison
How does the Golem Airbnb market stack up against its neighbors? Compare key performance metrics like average monthly revenue, ADR, and occupancy rates in surrounding areas to understand the broader regional STR landscape.
| Market | Active Properties | Monthly Revenue | Daily Rate | Avg. Occupancy |
|---|---|---|---|---|
| Ledenice | 13 | $2,597 | $403.12 | 39% |
| Močići | 31 | $2,398 | $214.17 | 48% |
| Lapčići | 13 | $2,375 | $331.21 | 40% |
| Čilipi | 32 | $2,356 | $217.28 | 53% |
| Sanarica | 14 | $2,311 | $227.51 | 35% |
| Rijeka Reževići | 16 | $2,300 | $280.54 | 47% |
| Krimovice | 30 | $2,288 | $374.55 | 35% |
| Čibača | 23 | $2,132 | $302.33 | 50% |
| Trebesin | 11 | $2,090 | $500.52 | 26% |
| Dubrovnik | 4,915 | $2,074 | $199.58 | 51% |