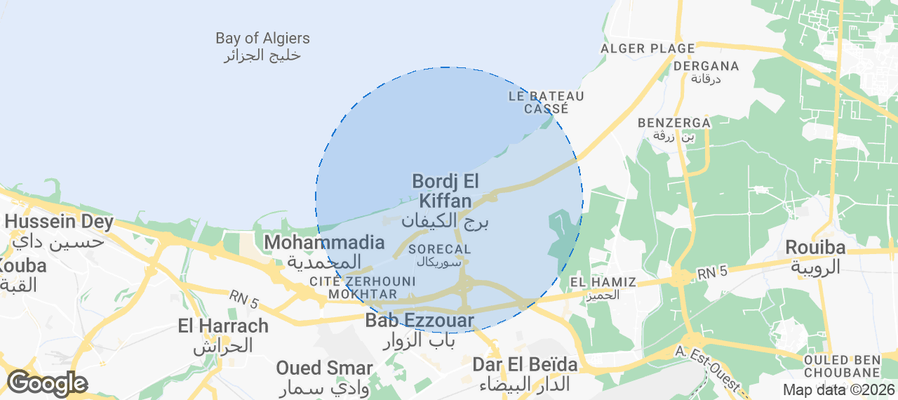
Bordj El Kiffan Airbnb Market Analysis 2026: Short Term Rental Data & Vacation Rental Statistics in Algiers Province, Algeria
Is Airbnb profitable in Bordj El Kiffan in 2026? Explore comprehensive Airbnb analytics for Bordj El Kiffan, Algiers Province, Algeria to uncover income potential. This 2026 STR market report for Bordj El Kiffan, based on AirROI data from February 2025 to January 2026, reveals key trends in the niche market of 26 active listings.
Whether you're considering an Airbnb investment in Bordj El Kiffan, optimizing your existing vacation rental, or exploring rental arbitrage opportunities, understanding the Bordj El Kiffan Airbnb data is crucial. Leveraging the low regulation environment is key to maximizing your short term rental income potential. Let's dive into the specifics.
Key Bordj El Kiffan Airbnb Performance Metrics Overview
Monthly Airbnb Revenue Variations & Income Potential in Bordj El Kiffan (2026)
Understanding the monthly revenue variations for Airbnb listings in Bordj El Kiffan is key to maximizing your short term rental income potential. Seasonality significantly impacts earnings. Our analysis, based on data from the past 12 months, shows that the peak revenue month for STRs in Bordj El Kiffan is typically August, while May often presents the lowest earnings, highlighting opportunities for strategic pricing adjustments during shoulder and low seasons. Explore the typical Airbnb income in Bordj El Kiffan across different performance tiers:
- Best-in-class properties (Top 10%) achieve $896+ monthly, often utilizing dynamic pricing and superior guest experiences.
- Strong performing properties (Top 25%) earn $658 or more, indicating effective management and desirable locations/amenities.
- Typical properties (Median) generate around $476 per month, representing the average market performance.
- Entry-level properties (Bottom 25%) see earnings around $298, often with potential for optimization.
Average Monthly Airbnb Earnings Trend in Bordj El Kiffan
Bordj El Kiffan Airbnb Occupancy Rate Trends (2026)
Maximize your bookings by understanding the Bordj El Kiffan STR occupancy trends. Seasonal demand shifts significantly influence how often properties are booked. Typically, Augustsees the highest demand (peak season occupancy), while May experiences the lowest (low season). Effective strategies, like adjusting minimum stays or offering promotions, can boost occupancy during slower periods. Here's how different property tiers perform in Bordj El Kiffan:
- Best-in-class properties (Top 10%) achieve 66%+ occupancy, indicating high desirability and potentially optimized availability.
- Strong performing properties (Top 25%) maintain 53% or higher occupancy, suggesting good market fit and guest satisfaction.
- Typical properties (Median) have an occupancy rate around 41%.
- Entry-level properties (Bottom 25%) average 31% occupancy, potentially facing higher vacancy.
Average Monthly Occupancy Rate Trend in Bordj El Kiffan
Average Daily Rate (ADR) Airbnb Trends in Bordj El Kiffan (2026)
Effective short term rental pricing strategy in Bordj El Kiffan involves understanding monthly ADR fluctuations. The Average Daily Rate (ADR) for Airbnb in Bordj El Kiffan typically peaks in May and dips lowest during January. Leveraging Airbnb dynamic pricing tools or strategies based on this seasonality can significantly boost revenue. Here's a look at the typical nightly rates achieved:
- Best-in-class properties (Top 10%) command rates of $56+ per night, often due to premium features or locations.
- Strong performing properties (Top 25%) achieve nightly rates of $44 or more.
- Typical properties (Median) charge around $35 per night.
- Entry-level properties (Bottom 25%) earn around $31 per night.
Average Daily Rate (ADR) Trend by Month in Bordj El Kiffan
Get Live Bordj El Kiffan Market Intelligence 👇
Explore Real-time Analytics
Airbnb Seasonality Analysis & Trends in Bordj El Kiffan (2026)
Peak Season (August, July, June)
- Revenue averages $866 per month
- Occupancy rates average 68.3%
- Daily rates average $40
Shoulder Season
- Revenue averages $377 per month
- Occupancy maintains around 28.2%
- Daily rates hold near $38
Low Season (February, March, April)
- Revenue drops to average $0 per month
- Occupancy decreases to average 0.0%
- Daily rates adjust to average $40
Seasonality Insights for Bordj El Kiffan
- The Airbnb seasonality in Bordj El Kiffan shows highly seasonal trends requiring careful strategy. While the sections above show seasonal averages, it's also insightful to look at the extremes:
- During the high season, the absolute peak month showcases Bordj El Kiffan's highest earning potential, with monthly revenues capable of climbing to $1,008, occupancy reaching a high of 76.6%, and ADRs peaking at $41.
- Conversely, the slowest single month of the year, typically falling within the low season, marks the market's lowest point. In this month, revenue might dip to $0, occupancy could drop to 0.0%, and ADRs may adjust down to $36.
- Understanding both the seasonal averages and these monthly peaks and troughs in revenue, occupancy, and ADR is crucial for maximizing your Airbnb profit potential in Bordj El Kiffan.
Seasonal Strategies for Maximizing Profit
- Peak Season: Maximize revenue through premium pricing and potentially longer minimum stays. Ensure high availability.
- Low Season: Offer competitive pricing, special promotions (e.g., extended stay discounts), and flexible cancellation policies. Target off-season travelers like remote workers or budget-conscious guests.
- Shoulder Seasons: Implement dynamic pricing that balances peak and low rates. Target weekend travelers or specific events. Offer slightly more flexible terms than peak season.
- Regularly analyze your own performance against these Bordj El Kiffan seasonality benchmarks and adjust your pricing and availability strategy accordingly.
Best Areas for Airbnb Investment in Bordj El Kiffan (2026)
Exploring the top neighborhoods for short-term rentals in Bordj El Kiffan? This section highlights key areas, outlining why they are attractive for hosts and guests, along with notable local attractions. Consider these locations based on your target guest profile and investment strategy.
| Neighborhood / Area | Why Host Here? (Target Guests & Appeal) | Key Attractions & Landmarks |
|---|---|---|
| Plage des El Madania | A beautiful beach area that attracts both locals and tourists, perfect for offering beachside accommodations. | Beaches, Restaurants, Water sports, Seaside promenade |
| Kouba | A vibrant suburb of Algiers with access to parks and cultural sites, appealing to families and travelers seeking a quieter stay. | Kouba Park, Cultural centers, Local markets |
| El Harrach | Known for its lively atmosphere and nearby beaches, making it attractive for visitors looking for a mix of city and beach life. | Beaches, Local eateries, Parks |
| Bir Mourad Raïs | An up-and-coming area with good transport links to Algiers city center, perfect for business travelers and urban explorers. | Transportation hubs, Local shops, Restaurants |
| El Madania | A historical area near the center of Algiers, rich in culture, architecture, and home to many attractions. | Casbah, Historic architecture, Museums, Shopping |
| Belouizdad | An area known for its sports culture and local community, attractive to visitors looking for an authentic Algerian experience. | Stadium, Local cafes, Community events |
| El Mouradia | An affluent area close to major government institutions and parks, suitable for business and diplomatic travelers. | Government buildings, Parks, Museums |
| Hydra | A popular residential area with upscale amenities, attracting visiting expatriates and diplomats due to its proximity to embassies. | Art galleries, Cafes, Parks, Embassies |
Understanding Airbnb License Requirements & STR Laws in Bordj El Kiffan (2026)
While Bordj El Kiffan, Algiers Province, Algeria currently shows low STR regulations, specific Airbnb license requirements might still exist or change. Always verify the latest short term rental regulations and Airbnb license requirements directly with local government authorities for Bordj El Kiffan to ensure full compliance before hosting.
(Source: AirROI data, 2026, finding no licensed listings among those analyzed)
Top Performing Airbnb Properties in Bordj El Kiffan (2026)
Benchmark your potential! Explore examples of top-performing Airbnb properties in Bordj El Kiffanbased on Trailing Twelve Month (TTM) revenue. Analyze their characteristics, revenue, occupancy rate, and ADR to understand what drives success in this market.

F3 house indoor pool airport
Entire Place • 2 bedrooms

T4 apartment
Entire Place • 3 bedrooms

Sea View Apartment — Al Nour
Entire Place • 1 bedroom

"Le Pétunia" Cozy 3-room apartment, private residence
Entire Place • 2 bedrooms

"L'Azur" - Cozy private residence
Entire Place • 1 bedroom

Duplex F3 | Close to Sea, Tram & Airport |
Entire Place • 2 bedrooms
Note: Performance varies based on location, size, amenities, seasonality, and management quality. Data reflects the past 12 months.
Top Performing Airbnb Hosts in Bordj El Kiffan (2026)
Learn from the best! This table showcases top-performing Airbnb hosts in Bordj El Kiffan based on the number of properties managed and estimated total revenue over the past year. Analyze their scale and performance metrics.
| Host Name | Properties | Grossing Revenue | Stay Reviews | Avg Rating |
|---|---|---|---|---|
| Yussuf | 3 | $21,272 | 79 | 4.73/5.0 |
| Booking Alger By Ilyes Immo | 5 | $19,932 | 43 | 4.78/5.0 |
| Bilel | 6 | $14,743 | 57 | 4.88/5.0 |
| Home Agency | 6 | $13,240 | 81 | 4.58/5.0 |
| Youssouf | 1 | $6,169 | 16 | 4.94/5.0 |
| Karim | 1 | $5,715 | 17 | 5.00/5.0 |
| Location Agency | 1 | $4,919 | 14 | 4.57/5.0 |
| Houssem Eddine | 1 | $3,040 | 7 | 4.86/5.0 |
| Abdel Karim | 1 | $1,851 | 2 | Not Rated |
| Saïd Nadir | 1 | $1,512 | 2 | Not Rated |
Analyzing the strategies of top hosts, such as their property selection, pricing, and guest communication, can offer valuable lessons for optimizing your own Airbnb operations in Bordj El Kiffan.
Dive Deeper: Advanced Bordj El Kiffan STR Market Data (2026)
Ready to unlock more insights? AirROI provides access to advanced metrics and comprehensive Airbnb data for Bordj El Kiffan. Explore detailed analytics beyond this report to refine your investment strategy, optimize pricing, and maximize your vacation rental profits.
Explore Advanced MetricsBordj El Kiffan Short-Term Rental Market Composition (2026): Property & Room Types
Room Type Distribution
Property Type Distribution
Market Composition Insights for Bordj El Kiffan
- The Bordj El Kiffan Airbnb market composition is heavily skewed towards Entire Home/Apt listings, which make up 100% of the 26 active rentals. This indicates strong guest preference for privacy and space.
- Looking at the property type distribution in Bordj El Kiffan, Apartment/Condo properties are the most common (96.2%), reflecting the local real estate landscape.
- Smaller segments like house (combined 3.8%) offer potential for unique stay experiences.
Bordj El Kiffan Airbnb Room Capacity Analysis (2026): Bedroom Distribution
Distribution of Listings by Number of Bedrooms
Room Capacity Insights for Bordj El Kiffan
- The dominant room capacity in Bordj El Kiffan is 1 bedroom listings, making up 46.2% of the market. This suggests a strong demand for properties suitable for couples or solo travelers.
- Together, 1 bedroom and 2 bedrooms properties represent 77.0% of the active Airbnb listings in Bordj El Kiffan, indicating a high concentration in these sizes.
Bordj El Kiffan Vacation Rental Guest Capacity Trends (2026)
Distribution of Listings by Guest Capacity
Guest Capacity Insights for Bordj El Kiffan
- The most common guest capacity trend in Bordj El Kiffan vacation rentals is listings accommodating 5 guests (42.3%). This suggests the primary traveler segment is likely larger groups.
- Properties designed for 5 guests and 4 guests dominate the Bordj El Kiffan STR market, accounting for 65.4% of listings.
- 26.9% of properties accommodate 6+ guests, serving the market segment for larger families or group travel in Bordj El Kiffan.
- On average, properties in Bordj El Kiffan are equipped to host 5.0 guests.
Bordj El Kiffan Airbnb Booking Patterns (2026): Available vs. Booked Days
Available Days Distribution
Booked Days Distribution
Booking Pattern Insights for Bordj El Kiffan
- The most common availability pattern in Bordj El Kiffan falls within the 271-366 days range, representing 57.7% of listings. This suggests many properties have significant open periods on their calendars.
- Approximately 100.0% of listings show high availability (181+ days open annually), indicating potential for increased bookings or specific owner usage patterns.
- For booked days, the 31-90 days range is most frequent in Bordj El Kiffan (50%), reflecting common guest stay durations or potential owner blocking patterns.
Bordj El Kiffan Airbnb Minimum Stay Requirements Analysis
Distribution of Listings by Minimum Night Requirement
1 Night
13 listings
50% of total
2 Nights
5 listings
19.2% of total
3 Nights
1 listings
3.8% of total
4-6 Nights
1 listings
3.8% of total
30+ Nights
6 listings
23.1% of total
Key Insights
- The most prevalent minimum stay requirement in Bordj El Kiffan is 1 Night, adopted by 50% of listings. This highlights the market's preference for shorter, flexible bookings.
- A strong majority (69.2%) of the Bordj El Kiffan Airbnb data shows acceptance of very short stays (1-2 nights), indicating a dynamic, high-turnover market.
- A significant segment (23.1%) caters to monthly stays (30+ nights) in Bordj El Kiffan, pointing to opportunities in the extended-stay market.
Recommendations
- Align with the market by considering a 1 Night minimum stay, as 50% of Bordj El Kiffan hosts use this setting.
- Explore offering discounts for stays of 30+ nights to attract the 23.1% of the market seeking extended stays.
- Adjust minimum nights based on seasonality – potentially shorter during low season and longer during peak demand periods in Bordj El Kiffan.
Bordj El Kiffan Airbnb Cancellation Policy Trends Analysis (2026)
Limited
1 listings
3.8% of total
Flexible
13 listings
50% of total
Moderate
2 listings
7.7% of total
Firm
10 listings
38.5% of total
Cancellation Policy Insights for Bordj El Kiffan
- The prevailing Airbnb cancellation policy trend in Bordj El Kiffan is Flexible, used by 50% of listings.
- There's a relatively balanced mix between guest-friendly (57.7%) and stricter (38.5%) policies, offering choices for different guest needs.
Recommendations for Hosts
- Consider adopting a Flexible policy to align with the 50% market standard in Bordj El Kiffan.
- Regularly review your cancellation policy against competitors and market demand shifts in Bordj El Kiffan.
Bordj El Kiffan STR Booking Lead Time Analysis (2026)
Average Booking Lead Time by Month
Booking Lead Time Insights for Bordj El Kiffan
- The overall average booking lead time for vacation rentals in Bordj El Kiffan is 16 days.
- Guests book furthest in advance for stays during August (average 35 days), likely coinciding with peak travel demand or local events.
- The shortest booking windows occur for stays in April (average 0 days), indicating more last-minute travel plans during this time.
- Seasonally, Summer (22 days avg.) sees the longest lead times, while Spring (0 days avg.) has the shortest, reflecting typical travel planning cycles.
Recommendations for Hosts
- Use the overall average lead time (16 days) as a baseline for your pricing and availability strategy in Bordj El Kiffan.
- For August stays, consider implementing length-of-stay discounts or slightly higher rates for bookings made less than 35 days out to capitalize on advance planning.
- During April, focus on last-minute booking availability and promotions, as guests book with very short notice (0 days avg.).
- Target marketing efforts for the Summer season well in advance (at least 22 days) to capture early planners.
- Monitor your own booking lead times against these Bordj El Kiffan averages to identify opportunities for dynamic pricing adjustments.
Popular & Essential Airbnb Amenities in Bordj El Kiffan (2026)
Amenity Prevalence
Amenity Insights for Bordj El Kiffan
- Essential amenities in Bordj El Kiffan that guests expect include: Air conditioning, Kitchen. Lacking these (any) could significantly impact bookings.
- Popular amenities like Washer, Free parking on premises, Hot water are common but not universal. Offering these can provide a competitive edge.
- Warning: Wifi is not universally provided but is considered essential globally. Ensure reliable Wifi is offered.
Recommendations for Hosts
- Ensure your listing includes all essential amenities for Bordj El Kiffan: Air conditioning, Kitchen.
- Prioritize adding missing essentials: Kitchen.
- Consider adding popular differentiators like Washer or Free parking on premises to increase appeal.
- Highlight unique or less common amenities you offer (e.g., hot tub, dedicated workspace, EV charger) in your listing description and photos.
- Regularly check competitor amenities in Bordj El Kiffan to stay competitive.
Bordj El Kiffan Airbnb Guest Demographics & Profile Analysis (2026)
Guest Profile Summary for Bordj El Kiffan
- The typical guest profile for Airbnb in Bordj El Kiffan consists of predominantly international visitors (98%), with top international origins including United Kingdom, typically belonging to the Post-2000s (Gen Z/Alpha) group (50%), primarily speaking French or English.
- Domestic travelers account for 2.2% of guests.
- Key international markets include France (83.3%) and United Kingdom (5.6%).
- Top languages spoken are French (36.8%) followed by English (31.6%).
- A significant demographic segment is the Post-2000s (Gen Z/Alpha) group, representing 50% of guests.
Recommendations for Hosts
- Focus marketing internationally, particularly towards travelers from United Kingdom.
- Offer listing details and communication support in French.
- Tailor amenities and listing descriptions to appeal to the dominant Post-2000s (Gen Z/Alpha) demographic (e.g., highlight fast WiFi, smart home features, local guides).
- Highlight unique local experiences or amenities relevant to the primary guest profile.
- Consider seasonal promotions aligned with peak travel times for key origin markets.
Nearby Short-Term Rental Market Comparison
How does the Bordj El Kiffan Airbnb market stack up against its neighbors? Compare key performance metrics like average monthly revenue, ADR, and occupancy rates in surrounding areas to understand the broader regional STR landscape.
| Market | Active Properties | Monthly Revenue | Daily Rate | Avg. Occupancy |
|---|---|---|---|---|
| Alger-Centre | 88 | $929 | $69.13 | 51% |
| Hydra | 74 | $895 | $85.45 | 44% |
| Sidi M'Hamed | 31 | $879 | $68.58 | 49% |
| Ouled Moussa | 25 | $811 | $83.90 | 40% |
| Staoueli | 28 | $741 | $89.25 | 35% |
| Ain Benian | 17 | $728 | $95.89 | 36% |
| Birkhadem | 36 | $699 | $95.26 | 35% |
| El Mouradia | 28 | $677 | $64.03 | 50% |
| Beni Ksila | 20 | $672 | $114.63 | 35% |
| Chéraga | 56 | $634 | $87.61 | 36% |