Encamp Airbnb Market Analysis 2025: Short Term Rental Data & Vacation Rental Statistics in Encamp, Andorra
Is Airbnb profitable in Encamp in 2025? Explore comprehensive Airbnb analytics for Encamp, Encamp, Andorra to uncover income potential. This 2025 STR market report for Encamp, based on AirROI data from July 2024 to June 2025, reveals key trends in the niche market of 175 active listings.
Whether you're considering an Airbnb investment in Encamp, optimizing your existing vacation rental, or exploring rental arbitrage opportunities, understanding the Encamp Airbnb data is crucial. Leveraging the low regulation environment is key to maximizing your short term rental income potential. Let's dive into the specifics.
Key Encamp Airbnb Performance Metrics Overview
Monthly Airbnb Revenue Variations & Income Potential in Encamp (2025)
Understanding the monthly revenue variations for Airbnb listings in Encamp is key to maximizing your short term rental income potential. Seasonality significantly impacts earnings. Our analysis, based on data from the past 12 months, shows that the peak revenue month for STRs in Encamp is typically February, while October often presents the lowest earnings, highlighting opportunities for strategic pricing adjustments during shoulder and low seasons. Explore the typical Airbnb income in Encamp across different performance tiers:
- Best-in-class properties (Top 10%) achieve $3,857+ monthly, often utilizing dynamic pricing and superior guest experiences.
- Strong performing properties (Top 25%) earn $2,577 or more, indicating effective management and desirable locations/amenities.
- Typical properties (Median) generate around $1,568 per month, representing the average market performance.
- Entry-level properties (Bottom 25%) see earnings around $837, often with potential for optimization.
Average Monthly Airbnb Earnings Trend in Encamp
Encamp Airbnb Occupancy Rate Trends (2025)
Maximize your bookings by understanding the Encamp STR occupancy trends. Seasonal demand shifts significantly influence how often properties are booked. Typically, Februarysees the highest demand (peak season occupancy), while June experiences the lowest (low season). Effective strategies, like adjusting minimum stays or offering promotions, can boost occupancy during slower periods. Here's how different property tiers perform in Encamp:
- Best-in-class properties (Top 10%) achieve 72%+ occupancy, indicating high desirability and potentially optimized availability.
- Strong performing properties (Top 25%) maintain 56% or higher occupancy, suggesting good market fit and guest satisfaction.
- Typical properties (Median) have an occupancy rate around 35%.
- Entry-level properties (Bottom 25%) average 17% occupancy, potentially facing higher vacancy.
Average Monthly Occupancy Rate Trend in Encamp
Average Daily Rate (ADR) Airbnb Trends in Encamp (2025)
Effective short term rental pricing strategy in Encamp involves understanding monthly ADR fluctuations. The Average Daily Rate (ADR) for Airbnb in Encamp typically peaks in February and dips lowest during October. Leveraging Airbnb dynamic pricing tools or strategies based on this seasonality can significantly boost revenue. Here's a look at the typical nightly rates achieved:
- Best-in-class properties (Top 10%) command rates of $266+ per night, often due to premium features or locations.
- Strong performing properties (Top 25%) achieve nightly rates of $194 or more.
- Typical properties (Median) charge around $146 per night.
- Entry-level properties (Bottom 25%) earn around $107 per night.
Average Daily Rate (ADR) Trend by Month in Encamp
Get Live Encamp Market Intelligence 👇
Explore Real-time Analytics
Airbnb Seasonality Analysis & Trends in Encamp (2025)
Peak Season (February, January, March)
- Revenue averages $3,685 per month
- Occupancy rates average 52.6%
- Daily rates average $218
Shoulder Season
- Revenue averages $1,644 per month
- Occupancy maintains around 35.2%
- Daily rates hold near $160
Low Season (May, September, October)
- Revenue drops to average $1,067 per month
- Occupancy decreases to average 30.4%
- Daily rates adjust to average $144
Seasonality Insights for Encamp
- The Airbnb seasonality in Encamp shows highly seasonal trends requiring careful strategy. While the sections above show seasonal averages, it's also insightful to look at the extremes:
- During the high season, the absolute peak month showcases Encamp's highest earning potential, with monthly revenues capable of climbing to $4,728, occupancy reaching a high of 63.0%, and ADRs peaking at $255.
- Conversely, the slowest single month of the year, typically falling within the low season, marks the market's lowest point. In this month, revenue might dip to $1,020, occupancy could drop to 26.2%, and ADRs may adjust down to $136.
- Understanding both the seasonal averages and these monthly peaks and troughs in revenue, occupancy, and ADR is crucial for maximizing your Airbnb profit potential in Encamp.
Seasonal Strategies for Maximizing Profit
- Peak Season: Maximize revenue through premium pricing and potentially longer minimum stays. Ensure high availability.
- Low Season: Offer competitive pricing, special promotions (e.g., extended stay discounts), and flexible cancellation policies. Target off-season travelers like remote workers or budget-conscious guests.
- Shoulder Seasons: Implement dynamic pricing that balances peak and low rates. Target weekend travelers or specific events. Offer slightly more flexible terms than peak season.
- Regularly analyze your own performance against these Encamp seasonality benchmarks and adjust your pricing and availability strategy accordingly.
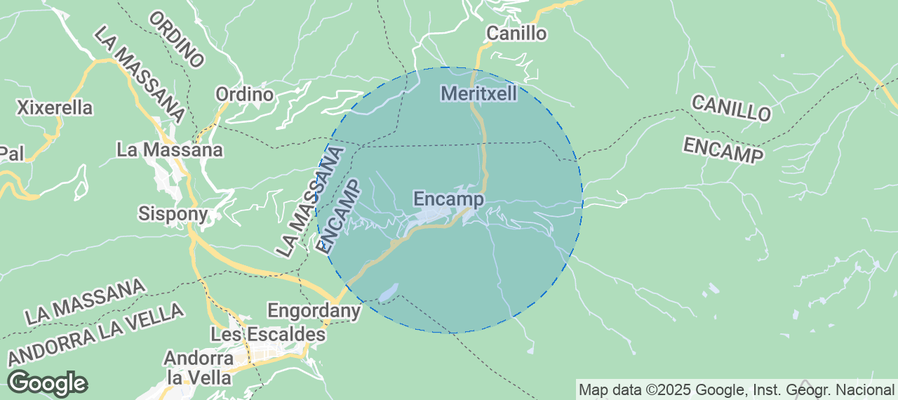
Best Areas for Airbnb Investment in Encamp (2025)
Exploring the top neighborhoods for short-term rentals in Encamp? This section highlights key areas, outlining why they are attractive for hosts and guests, along with notable local attractions. Consider these locations based on your target guest profile and investment strategy.
| Neighborhood / Area | Why Host Here? (Target Guests & Appeal) | Key Attractions & Landmarks |
|---|---|---|
| Central Encamp | The central area of Encamp provides easy access to restaurants, shops, and public transportation. It is perfect for tourists looking to explore the surrounding mountains and ski resorts. | Grandvalira Ski Resort, Church of Sant Romà, Pas de la Casa, Andorra's national park, Local restaurants and shops |
| El Pas de la Casa | This area is one of the primary ski resorts in Andorra, attracting winter sports enthusiasts and those seeking adventure in the snow. It offers a vibrant après-ski environment too. | Pas de la Casa Ski Resort, Ctras. del Sol, Nearby hiking trails and mountains, Valira River, Local bars and cafes |
| Encamp Valley | Nestled in a beautiful valley, this area offers stunning landscapes and great hiking opportunities during the summer and skiing during winter. It's ideal for nature lovers. | Estany de les Abelletes, All-year hiking trails, Mountain biking routes, Cable car to Funicamp, Natural parks and landscapes |
| Fonters | A quiet and peaceful area, perfect for families and those looking for a relaxing stay while still being close to adventure activities and the main town. | Natural parks, Hiking trails, Picnic spots, Cultural sites, Local artisan shops |
| Les Bons | This area offers breathtaking views and a tranquil environment, making it great for retreats, wellness stays, or relaxation-focused getaways. | Hiking trails, Beautiful viewpoints, Nearby mountain lakes, Traditional Andorran architecture, Family-friendly activities |
| La Mosquera | Located near the heart of Encamp, La Mosquera offers convenience for travelers who want easy access to both culture and nature, along with local festivities. | Cultural events, Access to ski resorts, Local markets, Andorra’s museums, Restaurants offering local cuisine |
| Terra Grossa | This area provides a unique perspective on the natural beauty of Andorra, with opportunities for both adventure sports and enjoying serene mountain life. | Adventure parks, Mountain biking, Skiing in winter, Andorran cultural heritage, Local festivals |
| Port d'Envalira | As a pass connecting to the higher mountains, this area is popular among outdoor enthusiasts and skiers, attracting those looking to explore Andorra's wild side. | High mountain adventures, Ski slopes, Steep hiking trails, Scenic drives, Wildlife watching |
Understanding Airbnb License Requirements & STR Laws in Encamp (2025)
While Encamp, Encamp, Andorra currently shows low STR regulations, specific Airbnb license requirements might still exist or change. Always verify the latest short term rental regulations and Airbnb license requirements directly with local government authorities for Encamp to ensure full compliance before hosting.
(Source: AirROI data, 2025, based on 2% licensed listings)
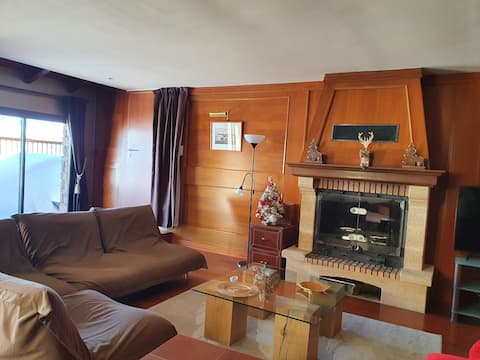
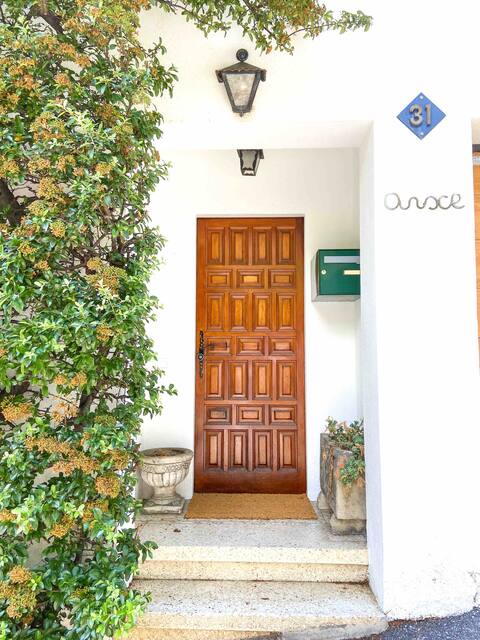
Top Performing Airbnb Properties in Encamp (2025)
Benchmark your potential! Explore examples of top-performing Airbnb properties in Encampbased on Trailing Twelve Month (TTM) revenue. Analyze their characteristics, revenue, occupancy rate, and ADR to understand what drives success in this market.
Unique Chalet 16 pers. slopes
Entire Place • 5 bedrooms
𓄃 Andorran House. Everything at your feet! 2 parking spaces
Entire Place • 4 bedrooms

𓇼Incredible Views | At the Foot of the Slopes | SKIING | 6p
Entire Place • 2 bedrooms

Borda del Molla
Entire Place • 2 bedrooms

Duplex with views | Terrace and parking in Encamp
Entire Place • 4 bedrooms

Beautiful 170 m2 apartment in Grandvalira
Entire Place • 3 bedrooms
Note: Performance varies based on location, size, amenities, seasonality, and management quality. Data reflects the past 12 months.
Top Performing Airbnb Hosts in Encamp (2025)
Learn from the best! This table showcases top-performing Airbnb hosts in Encamp based on the number of properties managed and estimated total revenue over the past year. Analyze their scale and performance metrics.
| Host Name | Properties | Grossing Revenue | Stay Reviews | Avg Rating |
|---|---|---|---|---|
| Proap | 12 | $339,097 | 324 | 4.48/5.0 |
| Victor | 30 | $314,608 | 274 | 3.95/5.0 |
| Marc | 15 | $272,145 | 6063 | 4.88/5.0 |
| BonesVacances Aida & Edu | 4 | $267,229 | 258 | 4.95/5.0 |
| Pisos A Dias | 11 | $182,140 | 239 | 4.57/5.0 |
| Marine | 5 | $160,421 | 49 | 4.69/5.0 |
| #Pasdelacasalovers #Pasfanati | 5 | $125,563 | 320 | 4.82/5.0 |
| Maria Jose | 5 | $123,932 | 664 | 4.78/5.0 |
| Juli | 2 | $122,328 | 90 | 4.97/5.0 |
| Ark | 3 | $119,903 | 441 | 4.66/5.0 |
Analyzing the strategies of top hosts, such as their property selection, pricing, and guest communication, can offer valuable lessons for optimizing your own Airbnb operations in Encamp.
Dive Deeper: Advanced Encamp STR Market Data (2025)
Ready to unlock more insights? AirROI provides access to advanced metrics and comprehensive Airbnb data for Encamp. Explore detailed analytics beyond this report to refine your investment strategy, optimize pricing, and maximize your vacation rental profits.
Explore Advanced MetricsEncamp Short-Term Rental Market Composition (2025): Property & Room Types
Room Type Distribution
Property Type Distribution
Market Composition Insights for Encamp
- The Encamp Airbnb market composition is heavily skewed towards Entire Home/Apt listings, which make up 99.4% of the 175 active rentals. This indicates strong guest preference for privacy and space.
- Looking at the property type distribution in Encamp, Apartment/Condo properties are the most common (76%), reflecting the local real estate landscape.
- Houses represent a significant 23.4% portion, catering likely to families or larger groups.
- Smaller segments like hotel/boutique (combined 0.6%) offer potential for unique stay experiences.
Encamp Airbnb Room Capacity Analysis (2025): Bedroom Distribution
Distribution of Listings by Number of Bedrooms
Room Capacity Insights for Encamp
- The dominant room capacity in Encamp is 1 bedroom listings, making up 42.3% of the market. This suggests a strong demand for properties suitable for couples or solo travelers.
- Together, 1 bedroom and 2 bedrooms properties represent 68.6% of the active Airbnb listings in Encamp, indicating a high concentration in these sizes.
- Listings with 3+ bedrooms (6.9%) represent a smaller niche, potentially indicating an underserved market for larger group accommodations in Encamp.
Encamp Vacation Rental Guest Capacity Trends (2025)
Distribution of Listings by Guest Capacity
Guest Capacity Insights for Encamp
- The most common guest capacity trend in Encamp vacation rentals is listings accommodating 4 guests (44.6%). This suggests the primary traveler segment is likely small families or groups.
- Properties designed for 4 guests and 6 guests dominate the Encamp STR market, accounting for 64.0% of listings.
- 26.2% of properties accommodate 6+ guests, serving the market segment for larger families or group travel in Encamp.
- On average, properties in Encamp are equipped to host 4.6 guests.
Encamp Airbnb Booking Patterns (2025): Available vs. Booked Days
Available Days Distribution
Booked Days Distribution
Booking Pattern Insights for Encamp
- The most common availability pattern in Encamp falls within the 271-366 days range, representing 49.1% of listings. This suggests many properties have significant open periods on their calendars.
- Approximately 84.5% of listings show high availability (181+ days open annually), indicating potential for increased bookings or specific owner usage patterns.
- For booked days, the 31-90 days range is most frequent in Encamp (37.7%), reflecting common guest stay durations or potential owner blocking patterns.
- A notable 17.1% of properties secure long booking periods (181+ days booked per year), highlighting successful long-term rental strategies or significant owner usage.
Encamp Airbnb Minimum Stay Requirements Analysis
Distribution of Listings by Minimum Night Requirement
1 Night
24 listings
14% of total
2 Nights
21 listings
12.3% of total
3 Nights
9 listings
5.3% of total
4-6 Nights
27 listings
15.8% of total
7-29 Nights
4 listings
2.3% of total
30+ Nights
86 listings
50.3% of total
Key Insights
- The most prevalent minimum stay requirement in Encamp is 30+ Nights, adopted by 50.3% of listings. This highlights the market's preference for longer commitments.
- A significant segment (50.3%) caters to monthly stays (30+ nights) in Encamp, pointing to opportunities in the extended-stay market.
Recommendations
- Align with the market by considering a 30+ Nights minimum stay, as 50.3% of Encamp hosts use this setting.
- If feasible, allowing 1-night stays, especially midweek or during low season, could capture last-minute bookings, as only 14% currently do.
- Explore offering discounts for stays of 30+ nights to attract the 50.3% of the market seeking extended stays.
- Adjust minimum nights based on seasonality – potentially shorter during low season and longer during peak demand periods in Encamp.
Encamp Airbnb Cancellation Policy Trends Analysis (2025)
Super Strict 30 Days
1 listings
0.6% of total
Super Strict 60 Days
1 listings
0.6% of total
Flexible
12 listings
7.1% of total
Moderate
25 listings
14.8% of total
Firm
30 listings
17.8% of total
Strict
100 listings
59.2% of total
Cancellation Policy Insights for Encamp
- The prevailing Airbnb cancellation policy trend in Encamp is Strict, used by 59.2% of listings.
- A majority (77.0%) of hosts in Encamp utilize Firm or Strict policies, indicating a market where hosts prioritize booking security.
Recommendations for Hosts
- Consider adopting a Strict policy to align with the 59.2% market standard in Encamp.
- With 59.2% using Strict terms, this is a viable option in Encamp, particularly for high-value properties or during peak demand periods.
- Regularly review your cancellation policy against competitors and market demand shifts in Encamp.
Encamp STR Booking Lead Time Analysis (2025)
Average Booking Lead Time by Month
Booking Lead Time Insights for Encamp
- The overall average booking lead time for vacation rentals in Encamp is 47 days.
- Guests book furthest in advance for stays during January (average 70 days), likely coinciding with peak travel demand or local events.
- The shortest booking windows occur for stays in September (average 20 days), indicating more last-minute travel plans during this time.
- Seasonally, Winter (67 days avg.) sees the longest lead times, while Fall (24 days avg.) has the shortest, reflecting typical travel planning cycles.
Recommendations for Hosts
- Use the overall average lead time (47 days) as a baseline for your pricing and availability strategy in Encamp.
- For January stays, consider implementing length-of-stay discounts or slightly higher rates for bookings made less than 70 days out to capitalize on advance planning.
- Target marketing efforts for the Winter season well in advance (at least 67 days) to capture early planners.
- Monitor your own booking lead times against these Encamp averages to identify opportunities for dynamic pricing adjustments.
Popular & Essential Airbnb Amenities in Encamp (2025)
Amenity data is currently unavailable for Encamp.
Encamp Airbnb Guest Demographics & Profile Analysis (2025)
Guest Profile Summary for Encamp
- The typical guest profile for Airbnb in Encamp consists of predominantly international visitors (99%), with top international origins including Spain, typically belonging to the Post-2000s (Gen Z/Alpha) group (50%), primarily speaking English or Spanish.
- Domestic travelers account for 0.6% of guests.
- Key international markets include France (36.9%) and Spain (36.2%).
- Top languages spoken are English (31.4%) followed by Spanish (28%).
- A significant demographic segment is the Post-2000s (Gen Z/Alpha) group, representing 50% of guests.
Recommendations for Hosts
- Focus marketing internationally, particularly towards travelers from Spain.
- Tailor amenities and listing descriptions to appeal to the dominant Post-2000s (Gen Z/Alpha) demographic (e.g., highlight fast WiFi, smart home features, local guides).
- Highlight unique local experiences or amenities relevant to the primary guest profile.
- Consider seasonal promotions aligned with peak travel times for key origin markets.
Nearby Short-Term Rental Market Comparison
How does the Encamp Airbnb market stack up against its neighbors? Compare key performance metrics like average monthly revenue, ADR, and occupancy rates in surrounding areas to understand the broader regional STR landscape.
| Market | Active Properties | Monthly Revenue | Daily Rate | Avg. Occupancy |
|---|---|---|---|---|
| Cornellà del Terri | 17 | $5,501 | $506.18 | 42% |
| Canyelles | 57 | $5,417 | $1060.72 | 35% |
| Bescanó | 10 | $5,344 | $477.30 | 48% |
| Vallirana | 10 | $5,316 | $331.13 | 58% |
| Amer | 11 | $4,801 | $460.94 | 37% |
| Tiana | 13 | $4,675 | $299.70 | 47% |
| Tei�à | 26 | $4,380 | $376.57 | 45% |
| Sant Vicenç de Montalt | 40 | $4,339 | $420.10 | 41% |
| Premià de Dalt | 32 | $4,252 | $336.70 | 48% |
| Alella | 43 | $4,190 | $464.68 | 47% |