Llorts Airbnb Market Analysis 2026: Short Term Rental Data & Vacation Rental Statistics in Ordino, Andorra
Is Airbnb profitable in Llorts in 2026? Explore comprehensive Airbnb analytics for Llorts, Ordino, Andorra to uncover income potential. This 2026 STR market report for Llorts, based on AirROI data from July 2024 to June 2025, reveals key trends in the niche market of 17 active listings.
Whether you're considering an Airbnb investment in Llorts, optimizing your existing vacation rental, or exploring rental arbitrage opportunities, understanding the Llorts Airbnb data is crucial. Leveraging the low regulation environment is key to maximizing your short term rental income potential. Let's dive into the specifics.
Key Llorts Airbnb Performance Metrics Overview
Monthly Airbnb Revenue Variations & Income Potential in Llorts (2026)
Understanding the monthly revenue variations for Airbnb listings in Llorts is key to maximizing your short term rental income potential. Seasonality significantly impacts earnings. Our analysis, based on data from the past 12 months, shows that the peak revenue month for STRs in Llorts is typically April, while February often presents the lowest earnings, highlighting opportunities for strategic pricing adjustments during shoulder and low seasons. Explore the typical Airbnb income in Llorts across different performance tiers:
- Best-in-class properties (Top 10%) achieve $6,609+ monthly, often utilizing dynamic pricing and superior guest experiences.
- Strong performing properties (Top 25%) earn $3,295 or more, indicating effective management and desirable locations/amenities.
- Typical properties (Median) generate around $1,601 per month, representing the average market performance.
- Entry-level properties (Bottom 25%) see earnings around $1,223, often with potential for optimization.
Average Monthly Airbnb Earnings Trend in Llorts
Llorts Airbnb Occupancy Rate Trends (2026)
Maximize your bookings by understanding the Llorts STR occupancy trends. Seasonal demand shifts significantly influence how often properties are booked. Typically, Augustsees the highest demand (peak season occupancy), while June experiences the lowest (low season). Effective strategies, like adjusting minimum stays or offering promotions, can boost occupancy during slower periods. Here's how different property tiers perform in Llorts:
- Best-in-class properties (Top 10%) achieve 57%+ occupancy, indicating high desirability and potentially optimized availability.
- Strong performing properties (Top 25%) maintain 37% or higher occupancy, suggesting good market fit and guest satisfaction.
- Typical properties (Median) have an occupancy rate around 24%.
- Entry-level properties (Bottom 25%) average 17% occupancy, potentially facing higher vacancy.
Average Monthly Occupancy Rate Trend in Llorts
Average Daily Rate (ADR) Airbnb Trends in Llorts (2026)
Effective short term rental pricing strategy in Llorts involves understanding monthly ADR fluctuations. The Average Daily Rate (ADR) for Airbnb in Llorts typically peaks in February and dips lowest during June. Leveraging Airbnb dynamic pricing tools or strategies based on this seasonality can significantly boost revenue. Here's a look at the typical nightly rates achieved:
- Best-in-class properties (Top 10%) command rates of $444+ per night, often due to premium features or locations.
- Strong performing properties (Top 25%) achieve nightly rates of $235 or more.
- Typical properties (Median) charge around $183 per night.
- Entry-level properties (Bottom 25%) earn around $173 per night.
Average Daily Rate (ADR) Trend by Month in Llorts
Get Live Llorts Market Intelligence 👇
Explore Real-time Analytics
Airbnb Seasonality Analysis & Trends in Llorts (2025)
Peak Season (April, March, August)
- Revenue averages $4,751 per month
- Occupancy rates average 39.2%
- Daily rates average $310
Shoulder Season
- Revenue averages $2,391 per month
- Occupancy maintains around 29.6%
- Daily rates hold near $284
Low Season (February, June, October)
- Revenue drops to average $1,891 per month
- Occupancy decreases to average 23.1%
- Daily rates adjust to average $305
Seasonality Insights for Llorts
- The Airbnb seasonality in Llorts shows highly seasonal trends requiring careful strategy. While the sections above show seasonal averages, it's also insightful to look at the extremes:
- During the high season, the absolute peak month showcases Llorts's highest earning potential, with monthly revenues capable of climbing to $6,290, occupancy reaching a high of 47.7%, and ADRs peaking at $368.
- Conversely, the slowest single month of the year, typically falling within the low season, marks the market's lowest point. In this month, revenue might dip to $1,855, occupancy could drop to 19.3%, and ADRs may adjust down to $266.
- Understanding both the seasonal averages and these monthly peaks and troughs in revenue, occupancy, and ADR is crucial for maximizing your Airbnb profit potential in Llorts.
Seasonal Strategies for Maximizing Profit
- Peak Season: Maximize revenue through premium pricing and potentially longer minimum stays. Ensure high availability.
- Low Season: Offer competitive pricing, special promotions (e.g., extended stay discounts), and flexible cancellation policies. Target off-season travelers like remote workers or budget-conscious guests.
- Shoulder Seasons: Implement dynamic pricing that balances peak and low rates. Target weekend travelers or specific events. Offer slightly more flexible terms than peak season.
- Regularly analyze your own performance against these Llorts seasonality benchmarks and adjust your pricing and availability strategy accordingly.
Best Areas for Airbnb Investment in Llorts (2026)
Exploring the top neighborhoods for short-term rentals in Llorts? This section highlights key areas, outlining why they are attractive for hosts and guests, along with notable local attractions. Consider these locations based on your target guest profile and investment strategy.
| Neighborhood / Area | Why Host Here? (Target Guests & Appeal) | Key Attractions & Landmarks |
|---|---|---|
| Llorts Village | Charming village with traditional Andorran architecture and a peaceful atmosphere. Ideal for guests looking to experience the authentic Andorran lifestyle. | Church of Llorts, Valira del Nord River, Nearby hiking trails, Cultural heritage sites |
| Ordino | The picturesque capital of the Ordino parish, offering beautiful landscapes, cultural experiences, and access to skiing in winter. Popular among families and nature lovers. | Casa d'Areny-Plandolit, Ordino-Arcalís Ski Area, La Cortinada Golf Course, Hiking trails, Museu National de l'Automòbil |
| Arcalís | Renowned for its ski resort, making it a prime location for winter tourism. Attracts skiing and snowboarding enthusiasts. | Arcalís Ski Resort, Gorgues del Montmal, Adventure sports activities, Scenic viewpoints |
| Naturlandia | An adventure park offering year-round outdoor activities, such as zip-lining and hiking. Draws families and adventure seekers. | Naturlandia Park, Tobotronc Alpine Coaster, Animal park, Hiking trails |
| La Massana | Close to various ski resorts and with a vibrant town center, great for both winter sports lovers and summer hikers. | La Massana Ski Resort, Telecabina de La Massana, Art galleries, Restaurants and shops |
| Pal-Arinsal | Ski area popular in winter and ideal for summer hiking, attracting an active outdoor crowd. | Pal-Arinsal Ski Resort, Mountain biking trails, Hiking paths, Restaurants and bars |
| Andorra la Vella | The capital city offers shopping, dining, and cultural experiences. Perfect for those looking for urban conveniences and attractions. | Shopping malls, Cultural sites, Restaurants, Nightlife |
| Incles Valley | Beautiful valley known for hiking and nature experiences with stunning views. Attracts nature and peace enthusiasts. | Hiking trails, Incles River, Wildlife photography opportunities, Scenic landscapes |
Understanding Airbnb License Requirements & STR Laws in Llorts (2026)
While Llorts, Ordino, Andorra currently shows low STR regulations, specific Airbnb license requirements might still exist or change. Always verify the latest short term rental regulations and Airbnb license requirements directly with local government authorities for Llorts to ensure full compliance before hosting.
(Source: AirROI data, 2026, finding no licensed listings among those analyzed)
Top Performing Airbnb Properties in Llorts (2026)
Benchmark your potential! Explore examples of top-performing Airbnb properties in Llortsbased on Trailing Twelve Month (TTM) revenue. Analyze their characteristics, revenue, occupancy rate, and ADR to understand what drives success in this market.

Isard Penthouse Ski in-Ski Out
Entire Place • 4 bedrooms
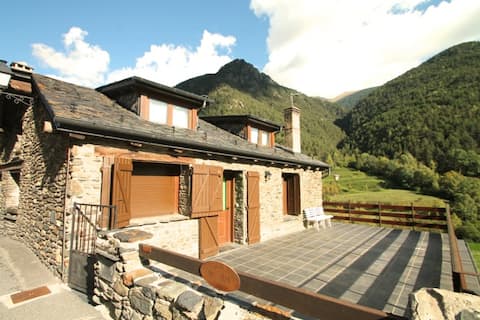
Andorran rustic house in Llorts
Entire Place • 4 bedrooms
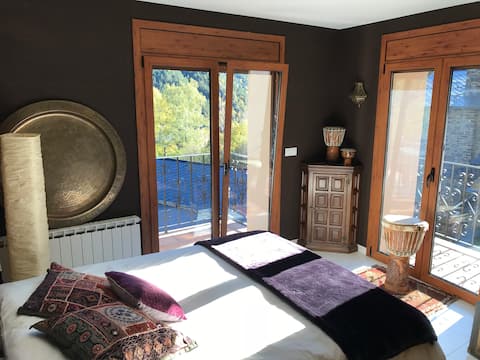
Charming house located in the head of the village of Llorts
Entire Place �• 4 bedrooms

Andorra 5 * Ordino Arcalis ski
Entire Place • 2 bedrooms
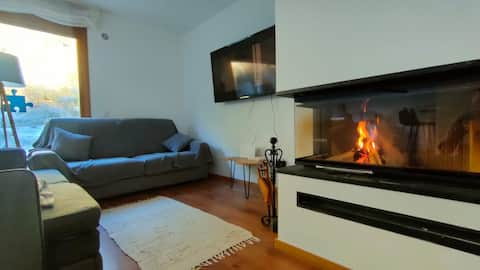
Lovely apartment in Llorts (Ordino)
Entire Place • 2 bedrooms
Two-bedroom apartment in Llorts.
Entire Place • 2 bedrooms
Note: Performance varies based on location, size, amenities, seasonality, and management quality. Data reflects the past 12 months.
Top Performing Airbnb Hosts in Llorts (2026)
Learn from the best! This table showcases top-performing Airbnb hosts in Llorts based on the number of properties managed and estimated total revenue over the past year. Analyze their scale and performance metrics.
| Host Name | Properties | Grossing Revenue | Stay Reviews | Avg Rating |
|---|---|---|---|---|
| Aleix | 1 | $73,002 | 1 | Not Rated |
| Josep Y Carla | 11 | $56,137 | 99 | 4.21/5.0 |
| Pisos A Dias | 1 | $43,854 | 79 | 4.44/5.0 |
| David | 2 | $39,262 | 41 | 5.00/5.0 |
| Fairouz | 1 | $30,870 | 3 | 5.00/5.0 |
| German | 1 | $26,302 | 15 | 4.80/5.0 |
Analyzing the strategies of top hosts, such as their property selection, pricing, and guest communication, can offer valuable lessons for optimizing your own Airbnb operations in Llorts.
Dive Deeper: Advanced Llorts STR Market Data (2026)
Ready to unlock more insights? AirROI provides access to advanced metrics and comprehensive Airbnb data for Llorts. Explore detailed analytics beyond this report to refine your investment strategy, optimize pricing, and maximize your vacation rental profits.
Explore Advanced MetricsLlorts Short-Term Rental Market Composition (2026): Property & Room Types
Room Type Distribution
Property Type Distribution
Market Composition Insights for Llorts
- The Llorts Airbnb market composition is heavily skewed towards Entire Home/Apt listings, which make up 94.1% of the 17 active rentals. This indicates strong guest preference for privacy and space.
- Looking at the property type distribution in Llorts, Apartment/Condo properties are the most common (82.4%), reflecting the local real estate landscape.
Llorts Airbnb Room Capacity Analysis (2026): Bedroom Distribution
Distribution of Listings by Number of Bedrooms
Room Capacity Insights for Llorts
- The dominant room capacity in Llorts is 2 bedrooms listings, making up 52.9% of the market. This suggests a strong demand for properties suitable for couples or solo travelers.
- Together, 2 bedrooms and 4 bedrooms properties represent 70.5% of the active Airbnb listings in Llorts, indicating a high concentration in these sizes.
- A significant 29.4% of listings offer 3+ bedrooms, catering to larger groups and families seeking more space in Llorts.
Llorts Vacation Rental Guest Capacity Trends (2026)
Distribution of Listings by Guest Capacity
Guest Capacity Insights for Llorts
- The most common guest capacity trend in Llorts vacation rentals is listings accommodating 6 guests (47.1%). This suggests the primary traveler segment is likely larger groups.
- Properties designed for 6 guests and 8+ guests dominate the Llorts STR market, accounting for 76.5% of listings.
- 76.5% of properties accommodate 6+ guests, serving the market segment for larger families or group travel in Llorts.
- On average, properties in Llorts are equipped to host 6.0 guests.
Llorts Airbnb Booking Patterns (2026): Available vs. Booked Days
Available Days Distribution
Booked Days Distribution
Booking Pattern Insights for Llorts
- The most common availability pattern in Llorts falls within the 271-366 days range, representing 82.4% of listings. This suggests many properties have significant open periods on their calendars.
- Approximately 100.0% of listings show high availability (181+ days open annually), indicating potential for increased bookings or specific owner usage patterns.
- For booked days, the 31-90 days range is most frequent in Llorts (47.1%), reflecting common guest stay durations or potential owner blocking patterns.
Llorts Airbnb Minimum Stay Requirements Analysis
Distribution of Listings by Minimum Night Requirement
1 Night
1 listings
5.9% of total
2 Nights
1 listings
5.9% of total
3 Nights
2 listings
11.8% of total
4-6 Nights
1 listings
5.9% of total
30+ Nights
12 listings
70.6% of total
Key Insights
- The most prevalent minimum stay requirement in Llorts is 30+ Nights, adopted by 70.6% of listings. This highlights the market's preference for longer commitments.
- Very short stays (1-2 nights) are less common (11.8%), suggesting hosts prefer slightly longer bookings to optimize turnover.
- A significant segment (70.6%) caters to monthly stays (30+ nights) in Llorts, pointing to opportunities in the extended-stay market.
Recommendations
- Align with the market by considering a 30+ Nights minimum stay, as 70.6% of Llorts hosts use this setting.
- If feasible, allowing 1-night stays, especially midweek or during low season, could capture last-minute bookings, as only 5.9% currently do.
- Explore offering discounts for stays of 30+ nights to attract the 70.6% of the market seeking extended stays.
- Adjust minimum nights based on seasonality – potentially shorter during low season and longer during peak demand periods in Llorts.
Llorts Airbnb Cancellation Policy Trends Analysis (2026)
Super Strict 30 Days
1 listings
5.9% of total
Flexible
3 listings
17.6% of total
Moderate
1 listings
5.9% of total
Strict
12 listings
70.6% of total
Cancellation Policy Insights for Llorts
- The prevailing Airbnb cancellation policy trend in Llorts is Strict, used by 70.6% of listings.
- A majority (70.6%) of hosts in Llorts utilize Firm or Strict policies, indicating a market where hosts prioritize booking security.
Recommendations for Hosts
- Consider adopting a Strict policy to align with the 70.6% market standard in Llorts.
- With 70.6% using Strict terms, this is a viable option in Llorts, particularly for high-value properties or during peak demand periods.
- Regularly review your cancellation policy against competitors and market demand shifts in Llorts.
Llorts STR Booking Lead Time Analysis (2026)
Average Booking Lead Time by Month
Booking Lead Time Insights for Llorts
- The overall average booking lead time for vacation rentals in Llorts is 41 days.
- Guests book furthest in advance for stays during June (average 61 days), likely coinciding with peak travel demand or local events.
- The shortest booking windows occur for stays in May (average 24 days), indicating more last-minute travel plans during this time.
- Seasonally, Summer (50 days avg.) sees the longest lead times, while Spring (31 days avg.) has the shortest, reflecting typical travel planning cycles.
Recommendations for Hosts
- Use the overall average lead time (41 days) as a baseline for your pricing and availability strategy in Llorts.
- For June stays, consider implementing length-of-stay discounts or slightly higher rates for bookings made less than 61 days out to capitalize on advance planning.
- Target marketing efforts for the Summer season well in advance (at least 50 days) to capture early planners.
- Monitor your own booking lead times against these Llorts averages to identify opportunities for dynamic pricing adjustments.
Popular & Essential Airbnb Amenities in Llorts (2026)
Amenity data is currently unavailable for Llorts.
Llorts Airbnb Guest Demographics & Profile Analysis (2026)
Guest Profile Summary for Llorts
- The typical guest profile for Airbnb in Llorts consists of predominantly international visitors (100%), with top international origins including Spain, typically belonging to the Post-2000s (Gen Z/Alpha) group (50%), primarily speaking Spanish or English.
- Domestic travelers account for 0.0% of guests.
- Key international markets include France (37.5%) and Spain (37.5%).
- Top languages spoken are Spanish (33.3%) followed by English (22.2%).
- A significant demographic segment is the Post-2000s (Gen Z/Alpha) group, representing 50% of guests.
Recommendations for Hosts
- Focus marketing internationally, particularly towards travelers from Spain.
- Offer listing details and communication support in Spanish.
- Tailor amenities and listing descriptions to appeal to the dominant Post-2000s (Gen Z/Alpha) demographic (e.g., highlight fast WiFi, smart home features, local guides).
- Highlight unique local experiences or amenities relevant to the primary guest profile.
- Consider seasonal promotions aligned with peak travel times for key origin markets.
Nearby Short-Term Rental Market Comparison
How does the Llorts Airbnb market stack up against its neighbors? Compare key performance metrics like average monthly revenue, ADR, and occupancy rates in surrounding areas to understand the broader regional STR landscape.
| Market | Active Properties | Monthly Revenue | Daily Rate | Avg. Occupancy |
|---|---|---|---|---|
| Cornellà del Terri | 17 | $5,501 | $506.18 | 42% |
| Canyelles | 57 | $5,417 | $1060.72 | 35% |
| Bescanó | 10 | $5,344 | $477.30 | 48% |
| Vallirana | 10 | $5,316 | $331.13 | 58% |
| Amer | 11 | $4,801 | $460.94 | 37% |
| Tiana | 13 | $4,675 | $299.70 | 47% |
| Teià | 26 | $4,380 | $376.57 | 45% |
| Sant Vicenç de Montalt | 40 | $4,339 | $420.10 | 41% |
| Premià de Dalt | 32 | $4,252 | $336.70 | 48% |
| Alella | 43 | $4,190 | $464.68 | 47% |