East End Airbnb Market Analysis 2025: Short Term Rental Data & Vacation Rental Statistics in East End, Anguilla
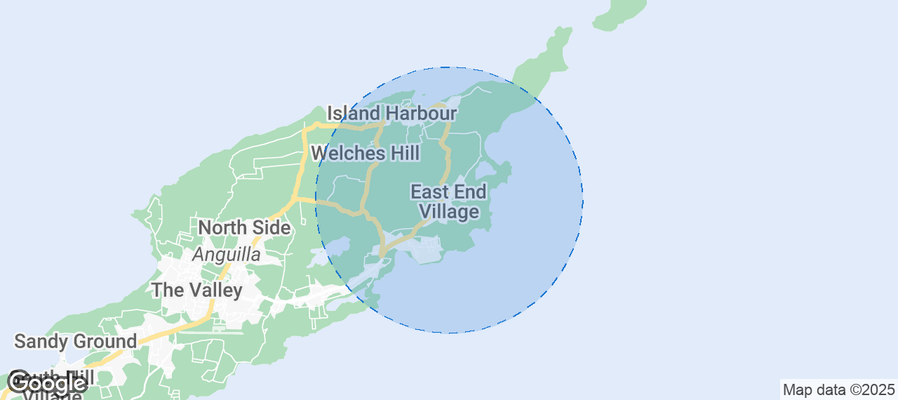
Is Airbnb profitable in East End in 2025? Explore comprehensive Airbnb analytics for East End, East End, Anguilla to uncover income potential. This 2025 STR market report for East End, based on AirROI data from July 2024 to June 2025, reveals key trends in the niche market of 24 active listings.
Whether you're considering an Airbnb investment in East End, optimizing your existing vacation rental, or exploring rental arbitrage opportunities, understanding the East End Airbnb data is crucial. Leveraging the low regulation environment is key to maximizing your short term rental income potential. Let's dive into the specifics.
Key East End Airbnb Performance Metrics Overview
Monthly Airbnb Revenue Variations & Income Potential in East End (2025)
Understanding the monthly revenue variations for Airbnb listings in East End is key to maximizing your short term rental income potential. Seasonality significantly impacts earnings. Our analysis, based on data from the past 12 months, shows that the peak revenue month for STRs in East End is typically September, while October often presents the lowest earnings, highlighting opportunities for strategic pricing adjustments during shoulder and low seasons. Explore the typical Airbnb income in East End across different performance tiers:
- Best-in-class properties (Top 10%) achieve $10,834+ monthly, often utilizing dynamic pricing and superior guest experiences.
- Strong performing properties (Top 25%) earn $3,739 or more, indicating effective management and desirable locations/amenities.
- Typical properties (Median) generate around $1,880 per month, representing the average market performance.
- Entry-level properties (Bottom 25%) see earnings around $1,020, often with potential for optimization.
Average Monthly Airbnb Earnings Trend in East End
East End Airbnb Occupancy Rate Trends (2025)
Maximize your bookings by understanding the East End STR occupancy trends. Seasonal demand shifts significantly influence how often properties are booked. Typically, Septembersees the highest demand (peak season occupancy), while October experiences the lowest (low season). Effective strategies, like adjusting minimum stays or offering promotions, can boost occupancy during slower periods. Here's how different property tiers perform in East End:
- Best-in-class properties (Top 10%) achieve 64%+ occupancy, indicating high desirability and potentially optimized availability.
- Strong performing properties (Top 25%) maintain 51% or higher occupancy, suggesting good market fit and guest satisfaction.
- Typical properties (Median) have an occupancy rate around 34%.
- Entry-level properties (Bottom 25%) average 21% occupancy, potentially facing higher vacancy.
Average Monthly Occupancy Rate Trend in East End
Average Daily Rate (ADR) Airbnb Trends in East End (2025)
Effective short term rental pricing strategy in East End involves understanding monthly ADR fluctuations. The Average Daily Rate (ADR) for Airbnb in East End typically peaks in December and dips lowest during May. Leveraging Airbnb dynamic pricing tools or strategies based on this seasonality can significantly boost revenue. Here's a look at the typical nightly rates achieved:
- Best-in-class properties (Top 10%) command rates of $1,367+ per night, often due to premium features or locations.
- Strong performing properties (Top 25%) achieve nightly rates of $507 or more.
- Typical properties (Median) charge around $161 per night.
- Entry-level properties (Bottom 25%) earn around $122 per night.
Average Daily Rate (ADR) Trend by Month in East End
Get Live East End Market Intelligence 👇
Explore Real-time Analytics
Airbnb Seasonality Analysis & Trends in East End (2025)
Peak Season (September, February, January)
- Revenue averages $6,102 per month
- Occupancy rates average 52.1%
- Daily rates average $463
Shoulder Season
- Revenue averages $4,688 per month
- Occupancy maintains around 36.6%
- Daily rates hold near $448
Low Season (June, October, November)
- Revenue drops to average $3,054 per month
- Occupancy decreases to average 26.4%
- Daily rates adjust to average $456
Seasonality Insights for East End
- The Airbnb seasonality in East End shows highly seasonal trends requiring careful strategy. While the sections above show seasonal averages, it's also insightful to look at the extremes:
- During the high season, the absolute peak month showcases East End's highest earning potential, with monthly revenues capable of climbing to $6,584, occupancy reaching a high of 65.8%, and ADRs peaking at $518.
- Conversely, the slowest single month of the year, typically falling within the low season, marks the market's lowest point. In this month, revenue might dip to $2,617, occupancy could drop to 19.4%, and ADRs may adjust down to $399.
- Understanding both the seasonal averages and these monthly peaks and troughs in revenue, occupancy, and ADR is crucial for maximizing your Airbnb profit potential in East End.
Seasonal Strategies for Maximizing Profit
- Peak Season: Maximize revenue through premium pricing and potentially longer minimum stays. Ensure high availability.
- Low Season: Offer competitive pricing, special promotions (e.g., extended stay discounts), and flexible cancellation policies. Target off-season travelers like remote workers or budget-conscious guests.
- Shoulder Seasons: Implement dynamic pricing that balances peak and low rates. Target weekend travelers or specific events. Offer slightly more flexible terms than peak season.
- Regularly analyze your own performance against these East End seasonality benchmarks and adjust your pricing and availability strategy accordingly.
Best Areas for Airbnb Investment in East End (2025)
Exploring the top neighborhoods for short-term rentals in East End? This section highlights key areas, outlining why they are attractive for hosts and guests, along with notable local attractions. Consider these locations based on your target guest profile and investment strategy.
| Neighborhood / Area | Why Host Here? (Target Guests & Appeal) | Key Attractions & Landmarks |
|---|---|---|
| Shoal Bay | Renowned for its stunning white sand beaches and crystal-clear waters. Shoal Bay is a prime location for tourists looking to enjoy water sports and the natural beauty of Anguilla. | Shoal Bay East, Scilly Cay, The Pumphouse, Elodia's Beach Bar, Anguilla Reef, Anguilla Watersports |
| Meads Bay | A luxurious beach destination with elegant resorts and restaurants. Popular among visitors seeking relaxation and fine dining experiences by the sea. | Meads Bay Beach, Viceroy Anguilla, Blanchards Beach Shack, Mango's Seaside Grill, CuisinArt Golf Resort & Spa, Ziggy's Beach Bar |
| Rendezvous Bay | A tranquil bay with picturesque views and a relaxed atmosphere. Attracts families and couples looking for a peaceful getaway. | Rendezvous Bay Beach, Dune Preserve, Anguilla Heritage Museum, Lil' bit of Heaven, Rendezvous Bay Villas |
| The Valley | The capital of Anguilla, offering cultural experiences and local dining options. Ideal for travelers wanting to explore local life and history. | The Valley Museum, Anguilla National Trust, Old Factory, St. Gerard's Roman Catholic Church, Tropical Wave Bar & Grill |
| Blowing Point | The main ferry terminal with easy access to St. Maarten. It's ideal for tourists who want to island-hop and explore neighboring islands. | Blowing Point Beach, Ferry Terminal, Sea Escape, The Revive Spa, Sunset Lounge |
| Long Bay | A stunning beach destination known for its clear waters and laid-back atmosphere, perfect for beach activities and relaxation. | Long Bay Beach, Luxury Villas, Beachfront dining, Snorkeling and diving, Kayaking experiences |
| Island Harbour | A charming fishing village with local restaurants and a glimpse into Anguilla's culture. Great for those wanting an authentic experience. | Island Harbour Beach, Hiking Trails, Local Fish Fry, Cultural Events, Shopping for local craft |
| Sandy Ground | Known for its vibrant nightlife and local eateries, it's a great location for those looking to experience Anguilla's social scene. | Sandy Ground Beach, Johnno's Beach Stop, Local bars and clubs, Live music events, Beachfront restaurants |
Understanding Airbnb License Requirements & STR Laws in East End (2025)
While East End, East End, Anguilla currently shows low STR regulations, specific Airbnb license requirements might still exist or change. Always verify the latest short term rental regulations and Airbnb license requirements directly with local government authorities for East End to ensure full compliance before hosting.
(Source: AirROI data, 2025, finding no licensed listings among those analyzed)
Top Performing Airbnb Properties in East End (2025)
Benchmark your potential! Explore examples of top-performing Airbnb properties in East Endbased on Trailing Twelve Month (TTM) revenue. Analyze their characteristics, revenue, occupancy rate, and ADR to understand what drives success in this market.
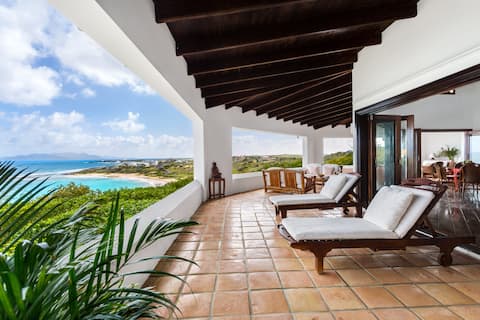
Beachfront Estate w/ Pool+Tennis Court
Entire Place • 7 bedrooms

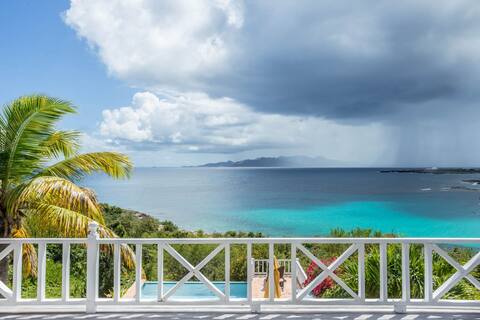
Oceanview villa with private pool, 5 mins to beach
Entire Place • 2 bedrooms

Fortune Rise. (Car rental available)
Entire Place • 2 bedrooms

Beach Front Villa With Swimming Pool
Entire Place • 3 bedrooms
Stunning Sea Feathers Villa
Entire Place • 3 bedrooms

Fortune Estate (Car rental available)
Entire Place • 1 bedroom
Note: Performance varies based on location, size, amenities, seasonality, and management quality. Data reflects the past 12 months.
Top Performing Airbnb Hosts in East End (2025)
Learn from the best! This table showcases top-performing Airbnb hosts in East End based on the number of properties managed and estimated total revenue over the past year. Analyze their scale and performance metrics.
| Host Name | Properties | Grossing Revenue | Stay Reviews | Avg Rating |
|---|---|---|---|---|
| Aline | 1 | $323,998 | 4 | 5.00/5.0 |
| Myron | 3 | $79,418 | 121 | 4.98/5.0 |
| Andrew Alison | 1 | $58,879 | 16 | 4.94/5.0 |
| Tommie | 1 | $36,814 | 16 | 4.75/5.0 |
| Stefan Szabo | 2 | $36,346 | 9 | 4.50/5.0 |
| Bonnie | 1 | $24,008 | 45 | 4.71/5.0 |
| CALVIN & ANITA | 2 | $22,784 | 53 | 4.97/5.0 |
| Lisbette | 1 | $20,635 | 1 | Not Rated |
| Danielle | 4 | $16,733 | 16 | 4.75/5.0 |
| Audric | 1 | $14,711 | 5 | 4.80/5.0 |
Analyzing the strategies of top hosts, such as their property selection, pricing, and guest communication, can offer valuable lessons for optimizing your own Airbnb operations in East End.
Dive Deeper: Advanced East End STR Market Data (2025)
Ready to unlock more insights? AirROI provides access to advanced metrics and comprehensive Airbnb data for East End. Explore detailed analytics beyond this report to refine your investment strategy, optimize pricing, and maximize your vacation rental profits.
Explore Advanced MetricsEast End Short-Term Rental Market Composition (2025): Property & Room Types
Room Type Distribution
Property Type Distribution
Market Composition Insights for East End
- The East End Airbnb market composition is heavily skewed towards Entire Home/Apt listings, which make up 87.5% of the 24 active rentals. This indicates strong guest preference for privacy and space.
- Looking at the property type distribution in East End, House properties are the most common (66.7%), reflecting the local real estate landscape.
- Houses represent a significant 66.7% portion, catering likely to families or larger groups.
East End Airbnb Room Capacity Analysis (2025): Bedroom Distribution
Distribution of Listings by Number of Bedrooms
Room Capacity Insights for East End
- The dominant room capacity in East End is 2 bedrooms listings, making up 33.3% of the market. This suggests a strong demand for properties suitable for couples or solo travelers.
- Together, 2 bedrooms and 1 bedroom properties represent 62.5% of the active Airbnb listings in East End, indicating a high concentration in these sizes.
- A significant 33.3% of listings offer 3+ bedrooms, catering to larger groups and families seeking more space in East End.
East End Vacation Rental Guest Capacity Trends (2025)
Distribution of Listings by Guest Capacity
Guest Capacity Insights for East End
- The most common guest capacity trend in East End vacation rentals is listings accommodating 4 guests (20.8%). This suggests the primary traveler segment is likely small families or groups.
- Properties designed for 4 guests and 2 guests dominate the East End STR market, accounting for 37.5% of listings.
- 37.6% of properties accommodate 6+ guests, serving the market segment for larger families or group travel in East End.
- On average, properties in East End are equipped to host 4.5 guests.
East End Airbnb Booking Patterns (2025): Available vs. Booked Days
Available Days Distribution
Booked Days Distribution
Booking Pattern Insights for East End
- The most common availability pattern in East End falls within the 271-366 days range, representing 58.3% of listings. This suggests many properties have significant open periods on their calendars.
- Approximately 95.8% of listings show high availability (181+ days open annually), indicating potential for increased bookings or specific owner usage patterns.
- For booked days, the 91-180 days range is most frequent in East End (41.7%), reflecting common guest stay durations or potential owner blocking patterns.
- A notable 4.2% of properties secure long booking periods (181+ days booked per year), highlighting successful long-term rental strategies or significant owner usage.
East End Airbnb Minimum Stay Requirements Analysis
Distribution of Listings by Minimum Night Requirement
1 Night
4 listings
18.2% of total
2 Nights
6 listings
27.3% of total
3 Nights
5 listings
22.7% of total
4-6 Nights
4 listings
18.2% of total
30+ Nights
3 listings
13.6% of total
Key Insights
- The most prevalent minimum stay requirement in East End is 2 Nights, adopted by 27.3% of listings. This highlights the market's preference for shorter, flexible bookings.
- A significant segment (13.6%) caters to monthly stays (30+ nights) in East End, pointing to opportunities in the extended-stay market.
Recommendations
- Align with the market by considering a 2 Nights minimum stay, as 27.3% of East End hosts use this setting.
- If feasible, allowing 1-night stays, especially midweek or during low season, could capture last-minute bookings, as only 18.2% currently do.
- Explore offering discounts for stays of 30+ nights to attract the 13.6% of the market seeking extended stays.
- Adjust minimum nights based on seasonality – potentially shorter during low season and longer during peak demand periods in East End.
East End Airbnb Cancellation Policy Trends Analysis (2025)
Flexible
8 listings
36.4% of total
Moderate
7 listings
31.8% of total
Firm
5 listings
22.7% of total
Strict
2 listings
9.1% of total
Cancellation Policy Insights for East End
- The prevailing Airbnb cancellation policy trend in East End is Flexible, used by 36.4% of listings.
- There's a relatively balanced mix between guest-friendly (68.2%) and stricter (31.8%) policies, offering choices for different guest needs.
- Strict cancellation policies are quite rare (9.1%), potentially making listings with this policy less competitive unless justified by high demand or property type.
Recommendations for Hosts
- Consider adopting a Flexible policy to align with the 36.4% market standard in East End.
- Using a Strict policy might deter some guests, as only 9.1% of listings use it. Evaluate if potential revenue protection outweighs possible lower booking rates.
- Regularly review your cancellation policy against competitors and market demand shifts in East End.
East End STR Booking Lead Time Analysis (2025)
Average Booking Lead Time by Month
Booking Lead Time Insights for East End
- The overall average booking lead time for vacation rentals in East End is 70 days.
- Guests book furthest in advance for stays during February (average 109 days), likely coinciding with peak travel demand or local events.
- The shortest booking windows occur for stays in September (average 12 days), indicating more last-minute travel plans during this time.
- Seasonally, Winter (98 days avg.) sees the longest lead times, while Fall (27 days avg.) has the shortest, reflecting typical travel planning cycles.
Recommendations for Hosts
- Use the overall average lead time (70 days) as a baseline for your pricing and availability strategy in East End.
- For February stays, consider implementing length-of-stay discounts or slightly higher rates for bookings made less than 109 days out to capitalize on advance planning.
- During September, focus on last-minute booking availability and promotions, as guests book with very short notice (12 days avg.).
- Target marketing efforts for the Winter season well in advance (at least 98 days) to capture early planners.
- Monitor your own booking lead times against these East End averages to identify opportunities for dynamic pricing adjustments.
Popular & Essential Airbnb Amenities in East End (2025)
Amenity data is currently unavailable for East End.
East End Airbnb Guest Demographics & Profile Analysis (2025)
Guest Profile Summary for East End
- The typical guest profile for Airbnb in East End consists of predominantly international visitors (100%), with top international origins including France, typically belonging to the Post-2000s (Gen Z/Alpha) group (50%), primarily speaking English or French.
- Domestic travelers account for 0.0% of guests.
- Key international markets include United States (48%) and France (12%).
- Top languages spoken are English (55.6%) followed by French (17.8%).
- A significant demographic segment is the Post-2000s (Gen Z/Alpha) group, representing 50% of guests.
Recommendations for Hosts
- Focus marketing internationally, particularly towards travelers from France.
- Tailor amenities and listing descriptions to appeal to the dominant Post-2000s (Gen Z/Alpha) demographic (e.g., highlight fast WiFi, smart home features, local guides).
- Highlight unique local experiences or amenities relevant to the primary guest profile.
- Consider seasonal promotions aligned with peak travel times for key origin markets.
Nearby Short-Term Rental Market Comparison
How does the East End Airbnb market stack up against its neighbors? Compare key performance metrics like average monthly revenue, ADR, and occupancy rates in surrounding areas to understand the broader regional STR landscape.
| Market | Active Properties | Monthly Revenue | Daily Rate | Avg. Occupancy |
|---|---|---|---|---|
| Fleming Estate | 16 | $6,262 | $609.38 | 49% |
| Saint Barthélemy | 545 | $6,216 | $1016.73 | 39% |
| Long Bay Village | 25 | $5,794 | $1064.81 | 35% |
| Simpson Bay | 54 | $5,357 | $582.47 | 42% |
| West End Village | 21 | $5,037 | $1065.82 | 37% |
| Island Harbour | 37 | $4,471 | $543.95 | 43% |
| Bolans | 81 | $3,917 | $448.70 | 39% |
| Cul-de-Sac | 280 | $3,806 | $360.39 | 44% |
| Simpson Bay | 214 | $3,696 | $336.87 | 48% |
| Christian Hill | 14 | $3,530 | $480.52 | 40% |