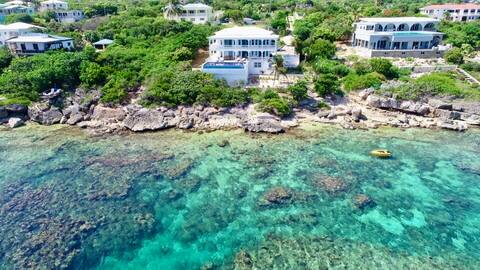
Island Harbour Airbnb Market Analysis 2026: Short Term Rental Data & Vacation Rental Statistics in Island Harbour, Anguilla
Is Airbnb profitable in Island Harbour in 2026? Explore comprehensive Airbnb analytics for Island Harbour, Island Harbour, Anguilla to uncover income potential. This 2026 STR market report for Island Harbour, based on AirROI data from February 2025 to January 2026, reveals key trends in the niche market of 40 active listings.
Whether you're considering an Airbnb investment in Island Harbour, optimizing your existing vacation rental, or exploring rental arbitrage opportunities, understanding the Island Harbour Airbnb data is crucial. Leveraging the low regulation environment is key to maximizing your short term rental income potential. Let's dive into the specifics.
Key Island Harbour Airbnb Performance Metrics Overview
Monthly Airbnb Revenue Variations & Income Potential in Island Harbour (2026)
Understanding the monthly revenue variations for Airbnb listings in Island Harbour is key to maximizing your short term rental income potential. Seasonality significantly impacts earnings. Our analysis, based on data from the past 12 months, shows that the peak revenue month for STRs in Island Harbour is typically March, while September often presents the lowest earnings, highlighting opportunities for strategic pricing adjustments during shoulder and low seasons. Explore the typical Airbnb income in Island Harbour across different performance tiers:
- Best-in-class properties (Top 10%) achieve $12,033+ monthly, often utilizing dynamic pricing and superior guest experiences.
- Strong performing properties (Top 25%) earn $5,210 or more, indicating effective management and desirable locations/amenities.
- Typical properties (Median) generate around $3,212 per month, representing the average market performance.
- Entry-level properties (Bottom 25%) see earnings around $1,643, often with potential for optimization.
Average Monthly Airbnb Earnings Trend in Island Harbour
Island Harbour Airbnb Occupancy Rate Trends (2026)
Maximize your bookings by understanding the Island Harbour STR occupancy trends. Seasonal demand shifts significantly influence how often properties are booked. Typically, Februarysees the highest demand (peak season occupancy), while September experiences the lowest (low season). Effective strategies, like adjusting minimum stays or offering promotions, can boost occupancy during slower periods. Here's how different property tiers perform in Island Harbour:
- Best-in-class properties (Top 10%) achieve 73%+ occupancy, indicating high desirability and potentially optimized availability.
- Strong performing properties (Top 25%) maintain 57% or higher occupancy, suggesting good market fit and guest satisfaction.
- Typical properties (Median) have an occupancy rate around 41%.
- Entry-level properties (Bottom 25%) average 23% occupancy, potentially facing higher vacancy.
Average Monthly Occupancy Rate Trend in Island Harbour
Average Daily Rate (ADR) Airbnb Trends in Island Harbour (2026)
Effective short term rental pricing strategy in Island Harbour involves understanding monthly ADR fluctuations. The Average Daily Rate (ADR) for Airbnb in Island Harbour typically peaks in February and dips lowest during October. Leveraging Airbnb dynamic pricing tools or strategies based on this seasonality can significantly boost revenue. Here's a look at the typical nightly rates achieved:
- Best-in-class properties (Top 10%) command rates of $1,226+ per night, often due to premium features or locations.
- Strong performing properties (Top 25%) achieve nightly rates of $569 or more.
- Typical properties (Median) charge around $247 per night.
- Entry-level properties (Bottom 25%) earn around $160 per night.
Average Daily Rate (ADR) Trend by Month in Island Harbour
Get Live Island Harbour Market Intelligence 👇

Explore Real-time Analytics
Airbnb Seasonality Analysis & Trends in Island Harbour (2026)
Peak Season (March, February, April)
- Revenue averages $8,309 per month
- Occupancy rates average 59.2%
- Daily rates average $581
Shoulder Season
- Revenue averages $4,188 per month
- Occupancy maintains around 39.1%
- Daily rates hold near $543
Low Season (August, September, October)
- Revenue drops to average $2,807 per month
- Occupancy decreases to average 30.9%
- Daily rates adjust to average $513
Seasonality Insights for Island Harbour
- The Airbnb seasonality in Island Harbour shows highly seasonal trends requiring careful strategy. While the sections above show seasonal averages, it's also insightful to look at the extremes:
- During the high season, the absolute peak month showcases Island Harbour's highest earning potential, with monthly revenues capable of climbing to $9,993, occupancy reaching a high of 73.1%, and ADRs peaking at $605.
- Conversely, the slowest single month of the year, typically falling within the low season, marks the market's lowest point. In this month, revenue might dip to $1,728, occupancy could drop to 26.5%, and ADRs may adjust down to $505.
- Understanding both the seasonal averages and these monthly peaks and troughs in revenue, occupancy, and ADR is crucial for maximizing your Airbnb profit potential in Island Harbour.
Seasonal Strategies for Maximizing Profit
- Peak Season: Maximize revenue through premium pricing and potentially longer minimum stays. Ensure high availability.
- Low Season: Offer competitive pricing, special promotions (e.g., extended stay discounts), and flexible cancellation policies. Target off-season travelers like remote workers or budget-conscious guests.
- Shoulder Seasons: Implement dynamic pricing that balances peak and low rates. Target weekend travelers or specific events. Offer slightly more flexible terms than peak season.
- Regularly analyze your own performance against these Island Harbour seasonality benchmarks and adjust your pricing and availability strategy accordingly.
Best Areas for Airbnb Investment in Island Harbour (2026)
Exploring the top neighborhoods for short-term rentals in Island Harbour? This section highlights key areas, outlining why they are attractive for hosts and guests, along with notable local attractions. Consider these locations based on your target guest profile and investment strategy.
| Neighborhood / Area | Why Host Here? (Target Guests & Appeal) | Key Attractions & Landmarks |
|---|---|---|
| Shoal Bay East | Renowned for its pristine white sands and crystal-clear waters, Shoal Bay East is a top destination for beach lovers and those seeking relaxation. Ideal for travelers wanting a serene getaway with beautiful views. | Shoal Bay East Beach, Snorkeling and diving spots, Local beach bars and restaurants, Kayaking and paddleboarding, Sunset views |
| Anguilla’s West End | This area is home to luxurious villas and upscale accommodations, making it a magnet for affluent travelers. The stunning beaches and gourmet dining attract discerning guests looking for a high-end experience. | Meads Bay, Sandy Ground, Blanchards Beach Shack, Maundays Bay, Villas and luxury resorts |
| South Hill | Offering a mix of local culture and close proximity to key attractions, South Hill is a great spot for those who want to experience the local life while still being near the beach. Perfect for families and longer stays. | South Hill Village, Local markets, Nearby beaches, Cultural experiences, Restaurants with local cuisine |
| Cove Bay | A quieter beach area perfect for those looking to escape the crowds. Cove Bay offers beautiful scenery and calm waters, making it ideal for families and couples. Great for relaxation and beach activities. | Cove Bay Beach, Beachfront dining, Water sports, Scenic views, Sunbathing spots |
| Long Bay | Long Bay is known for its stunning views and tranquil environment. It attracts guests looking for a peaceful retreat from bustling tourist areas, with plenty of opportunities for outdoor activities. | Long Bay Beach, Hiking trails, Outdoor sports, Secluded spots, Nature walks |
| Rendezvous Bay | Famous for its picturesque beach and luxurious resorts, Rendezvous Bay is perfect for travelers seeking romance and relaxation. The beautiful bay provides a stunning backdrop for vacations. | Rendezvous Bay Beach, Luxury resorts, Sunset views, Restaurants overlooking the bay, Water sports |
| Blowing Point | Located near the ferry terminal, Blowing Point is convenient for travelers arriving by boat. It offers a mix of local charm and easy access to nearby beaches and attractions. | Blowing Point Beach, Local restaurants, Access to ferry services, Nearby attractions, Cultural experiences |
| East End | This area is known for its untamed beauty and natural landscapes. Ideal for adventurous travelers looking to explore Anguilla’s natural side, with opportunities for hiking, snorkeling, and more. | East End beaches, Natural beauty, Hiking trails, Local wildlife, Snorkeling spots |
Understanding Airbnb License Requirements & STR Laws in Island Harbour (2026)
While Island Harbour, Island Harbour, Anguilla currently shows low STR regulations, specific Airbnb license requirements might still exist or change. Always verify the latest short term rental regulations and Airbnb license requirements directly with local government authorities for Island Harbour to ensure full compliance before hosting.
(Source: AirROI data, 2026, finding no licensed listings among those analyzed)
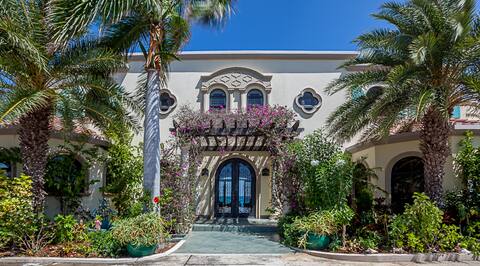
Top Performing Airbnb Properties in Island Harbour (2026)
Benchmark your potential! Explore examples of top-performing Airbnb properties in Island Harbourbased on Trailing Twelve Month (TTM) revenue. Analyze their characteristics, revenue, occupancy rate, and ADR to understand what drives success in this market.

Stunning Oceanfront Villa ~ Pool, Jacuzzi & Kayaks
Entire Place • 2 bedrooms
Caribbean Rhapsody Oceanfront Villa
Entire Place ��• 4 bedrooms
Beautiful island home!
Entire Place • 1 bedroom

Oceanfront 2BD Villa - Arawak Beach Club #6&7
Entire Place • 2 bedrooms

Yellow Villa
Entire Place • 5 bedrooms

Very Private Ocean Front Villa, Shoal Bay closeby
Entire Place • 2 bedrooms
Note: Performance varies based on location, size, amenities, seasonality, and management quality. Data reflects the past 12 months.
Top Performing Airbnb Hosts in Island Harbour (2026)
Learn from the best! This table showcases top-performing Airbnb hosts in Island Harbour based on the number of properties managed and estimated total revenue over the past year. Analyze their scale and performance metrics.
| Host Name | Properties | Grossing Revenue | Stay Reviews | Avg Rating |
|---|---|---|---|---|
| Arawak Beach Club | 11 | $656,464 | 520 | 4.86/5.0 |
| Paul And Donna | 1 | $189,148 | 20 | 5.00/5.0 |
| Wicky | 1 | $115,585 | 3 | 4.67/5.0 |
| Properties In Paradise | 1 | $78,707 | 0 | Not Rated |
| Mary Pat | 1 | $75,077 | 25 | 5.00/5.0 |
| Rose | 4 | $59,162 | 141 | 4.94/5.0 |
| Shannon | 1 | $58,502 | 94 | 4.89/5.0 |
| Peter | 3 | $49,537 | 5 | 5.00/5.0 |
| Margarita | 2 | $39,536 | 23 | 5.00/5.0 |
| Indira | 2 | $39,299 | 89 | 4.95/5.0 |
Analyzing the strategies of top hosts, such as their property selection, pricing, and guest communication, can offer valuable lessons for optimizing your own Airbnb operations in Island Harbour.
Dive Deeper: Advanced Island Harbour STR Market Data (2026)
Ready to unlock more insights? AirROI provides access to advanced metrics and comprehensive Airbnb data for Island Harbour. Explore detailed analytics beyond this report to refine your investment strategy, optimize pricing, and maximize your vacation rental profits.
Explore Advanced MetricsIsland Harbour Short-Term Rental Market Composition (2026): Property & Room Types
Room Type Distribution
Property Type Distribution
Market Composition Insights for Island Harbour
- The Island Harbour Airbnb market composition is heavily skewed towards Entire Home/Apt listings, which make up 87.5% of the 40 active rentals. This indicates strong guest preference for privacy and space.
- Looking at the property type distribution in Island Harbour, House properties are the most common (55%), reflecting the local real estate landscape.
- Houses represent a significant 55% portion, catering likely to families or larger groups.
- The presence of 10% Hotel/Boutique listings indicates integration with traditional hospitality.
- Smaller segments like unique stays (combined 2.5%) offer potential for unique stay experiences.
Island Harbour Airbnb Room Capacity Analysis (2026): Bedroom Distribution
Distribution of Listings by Number of Bedrooms
Room Capacity Insights for Island Harbour
- The dominant room capacity in Island Harbour is 1 bedroom listings, making up 52.5% of the market. This suggests a strong demand for properties suitable for couples or solo travelers.
- Together, 1 bedroom and 2 bedrooms properties represent 77.5% of the active Airbnb listings in Island Harbour, indicating a high concentration in these sizes.
- With over half the market (52.5%) consisting of studios or 1-bedroom units, Island Harbour is particularly well-suited for individuals or couples.
Island Harbour Vacation Rental Guest Capacity Trends (2026)
Distribution of Listings by Guest Capacity
Guest Capacity Insights for Island Harbour
- The most common guest capacity trend in Island Harbour vacation rentals is listings accommodating 2 guests (50%). This suggests the primary traveler segment is likely couples or solo travelers.
- Properties designed for 2 guests and 4 guests dominate the Island Harbour STR market, accounting for 70.0% of listings.
- A significant 50.0% of listings cater specifically to 1-2 guests, highlighting strong demand from couples and solo travelers in Island Harbour.
- 25.0% of properties accommodate 6+ guests, serving the market segment for larger families or group travel in Island Harbour.
- On average, properties in Island Harbour are equipped to host 3.8 guests.
Island Harbour Airbnb Booking Patterns (2026): Available vs. Booked Days
Available Days Distribution
Booked Days Distribution
Booking Pattern Insights for Island Harbour
- The most common availability pattern in Island Harbour falls within the 271-366 days range, representing 45% of listings. This suggests many properties have significant open periods on their calendars.
- Approximately 90.0% of listings show high availability (181+ days open annually), indicating potential for increased bookings or specific owner usage patterns.
- For booked days, the 91-180 days range is most frequent in Island Harbour (40%), reflecting common guest stay durations or potential owner blocking patterns.
- A notable 15.0% of properties secure long booking periods (181+ days booked per year), highlighting successful long-term rental strategies or significant owner usage.
Island Harbour Airbnb Minimum Stay Requirements Analysis
Distribution of Listings by Minimum Night Requirement
1 Night
4 listings
10% of total
2 Nights
13 listings
32.5% of total
3 Nights
3 listings
7.5% of total
4-6 Nights
5 listings
12.5% of total
7-29 Nights
2 listings
5% of total
30+ Nights
13 listings
32.5% of total
Key Insights
- The most prevalent minimum stay requirement in Island Harbour is 2 Nights, adopted by 32.5% of listings. This highlights the market's preference for shorter, flexible bookings.
- A significant segment (32.5%) caters to monthly stays (30+ nights) in Island Harbour, pointing to opportunities in the extended-stay market.
Recommendations
- Align with the market by considering a 2 Nights minimum stay, as 32.5% of Island Harbour hosts use this setting.
- If feasible, allowing 1-night stays, especially midweek or during low season, could capture last-minute bookings, as only 10% currently do.
- A 2-night minimum appears standard (32.5%). Consider this for weekends or peak periods.
- Explore offering discounts for stays of 30+ nights to attract the 32.5% of the market seeking extended stays.
- Adjust minimum nights based on seasonality – potentially shorter during low season and longer during peak demand periods in Island Harbour.
Island Harbour Airbnb Cancellation Policy Trends Analysis (2026)
Super Strict 30 Days
1 listings
2.5% of total
Super Strict 60 Days
1 listings
2.5% of total
Flexible
23 listings
57.5% of total
Moderate
3 listings
7.5% of total
Firm
7 listings
17.5% of total
Strict
5 listings
12.5% of total
Cancellation Policy Insights for Island Harbour
- The prevailing Airbnb cancellation policy trend in Island Harbour is Flexible, used by 57.5% of listings.
- There's a relatively balanced mix between guest-friendly (65.0%) and stricter (30.0%) policies, offering choices for different guest needs.
Recommendations for Hosts
- Consider adopting a Flexible policy to align with the 57.5% market standard in Island Harbour.
- Given the high prevalence of Flexible policies (57.5%), offering this can enhance booking appeal, especially during shoulder seasons.
- Using a Strict policy might deter some guests, as only 12.5% of listings use it. Evaluate if potential revenue protection outweighs possible lower booking rates.
- Regularly review your cancellation policy against competitors and market demand shifts in Island Harbour.
Island Harbour STR Booking Lead Time Analysis (2026)
Average Booking Lead Time by Month
Booking Lead Time Insights for Island Harbour
- The overall average booking lead time for vacation rentals in Island Harbour is 88 days.
- Guests book furthest in advance for stays during February (average 147 days), likely coinciding with peak travel demand or local events.
- The shortest booking windows occur for stays in September (average 32 days), indicating more last-minute travel plans during this time.
- Seasonally, Winter (124 days avg.) sees the longest lead times, while Summer (46 days avg.) has the shortest, reflecting typical travel planning cycles.
Recommendations for Hosts
- Use the overall average lead time (88 days) as a baseline for your pricing and availability strategy in Island Harbour.
- For February stays, consider implementing length-of-stay discounts or slightly higher rates for bookings made less than 147 days out to capitalize on advance planning.
- Target marketing efforts for the Winter season well in advance (at least 124 days) to capture early planners.
- Monitor your own booking lead times against these Island Harbour averages to identify opportunities for dynamic pricing adjustments.
Popular & Essential Airbnb Amenities in Island Harbour (2026)
Amenity Prevalence
Amenity Insights for Island Harbour
- Essential amenities in Island Harbour that guests expect include: Free parking on premises, Wifi, Air conditioning, Hangers, Kitchen. Lacking these (any) could significantly impact bookings.
- Popular amenities like Essentials, TV, Iron are common but not universal. Offering these can provide a competitive edge.
Recommendations for Hosts
- Ensure your listing includes all essential amenities for Island Harbour: Free parking on premises, Wifi, Air conditioning, Hangers, Kitchen.
- Prioritize adding missing essentials: Hangers, Kitchen.
- Consider adding popular differentiators like Essentials or TV to increase appeal.
- Highlight unique or less common amenities you offer (e.g., hot tub, dedicated workspace, EV charger) in your listing description and photos.
- Regularly check competitor amenities in Island Harbour to stay competitive.
Island Harbour Airbnb Guest Demographics & Profile Analysis (2026)
Guest Profile Summary for Island Harbour
- The typical guest profile for Airbnb in Island Harbour consists of predominantly international visitors (98%), with top international origins including Canada, typically belonging to the Post-2000s (Gen Z/Alpha) group (50%), primarily speaking English or Spanish.
- Domestic travelers account for 2.2% of guests.
- Key international markets include United States (64.9%) and Canada (8.1%).
- Top languages spoken are English (55.9%) followed by Spanish (14.7%).
- A significant demographic segment is the Post-2000s (Gen Z/Alpha) group, representing 50% of guests.
Recommendations for Hosts
- Focus marketing internationally, particularly towards travelers from Canada.
- Tailor amenities and listing descriptions to appeal to the dominant Post-2000s (Gen Z/Alpha) demographic (e.g., highlight fast WiFi, smart home features, local guides).
- Highlight unique local experiences or amenities relevant to the primary guest profile.
- Consider seasonal promotions aligned with peak travel times for key origin markets.
Nearby Short-Term Rental Market Comparison
How does the Island Harbour Airbnb market stack up against its neighbors? Compare key performance metrics like average monthly revenue, ADR, and occupancy rates in surrounding areas to understand the broader regional STR landscape.
| Market | Active Properties | Monthly Revenue | Daily Rate | Avg. Occupancy |
|---|---|---|---|---|
| Central | 15 | $7,894 | $1132.95 | 46% |
| Cruz Bay | 399 | $6,017 | $618.02 | 46% |
| Long Bay Village | 26 | $5,969 | $1098.49 | 32% |
| Saint Barthélemy | 554 | $5,892 | $1034.64 | 37% |
| Fleming Estate | 15 | $5,884 | $572.58 | 46% |
| Northside | 62 | $5,784 | $544.57 | 42% |
| Coral Harbour | 162 | $5,478 | $461.88 | 51% |
| Charlotte Amalie | 12 | $4,939 | $453.47 | 42% |
| West End Village | 21 | $4,844 | $1011.24 | 33% |
| Cruz Bay | 26 | $4,683 | $550.44 | 41% |