Beccar Airbnb Market Analysis 2026: Short Term Rental Data & Vacation Rental Statistics in Buenos Aires, Argentina
Is Airbnb profitable in Beccar in 2026? Explore comprehensive Airbnb analytics for Beccar, Buenos Aires, Argentina to uncover income potential. This 2026 STR market report for Beccar, based on AirROI data from February 2025 to January 2026, reveals key trends in the niche market of 74 active listings.
Whether you're considering an Airbnb investment in Beccar, optimizing your existing vacation rental, or exploring rental arbitrage opportunities, understanding the Beccar Airbnb data is crucial. Leveraging the low regulation environment is key to maximizing your short term rental income potential. Let's dive into the specifics.
Key Beccar Airbnb Performance Metrics Overview
Monthly Airbnb Revenue Variations & Income Potential in Beccar (2026)
Understanding the monthly revenue variations for Airbnb listings in Beccar is key to maximizing your short term rental income potential. Seasonality significantly impacts earnings. Our analysis, based on data from the past 12 months, shows that the peak revenue month for STRs in Beccar is typically December, while September often presents the lowest earnings, highlighting opportunities for strategic pricing adjustments during shoulder and low seasons. Explore the typical Airbnb income in Beccar across different performance tiers:
- Best-in-class properties (Top 10%) achieve $3,148+ monthly, often utilizing dynamic pricing and superior guest experiences.
- Strong performing properties (Top 25%) earn $1,557 or more, indicating effective management and desirable locations/amenities.
- Typical properties (Median) generate around $659 per month, representing the average market performance.
- Entry-level properties (Bottom 25%) see earnings around $251, often with potential for optimization.
Average Monthly Airbnb Earnings Trend in Beccar
Beccar Airbnb Occupancy Rate Trends (2026)
Maximize your bookings by understanding the Beccar STR occupancy trends. Seasonal demand shifts significantly influence how often properties are booked. Typically, Februarysees the highest demand (peak season occupancy), while May experiences the lowest (low season). Effective strategies, like adjusting minimum stays or offering promotions, can boost occupancy during slower periods. Here's how different property tiers perform in Beccar:
- Best-in-class properties (Top 10%) achieve 77%+ occupancy, indicating high desirability and potentially optimized availability.
- Strong performing properties (Top 25%) maintain 58% or higher occupancy, suggesting good market fit and guest satisfaction.
- Typical properties (Median) have an occupancy rate around 29%.
- Entry-level properties (Bottom 25%) average 12% occupancy, potentially facing higher vacancy.
Average Monthly Occupancy Rate Trend in Beccar
Average Daily Rate (ADR) Airbnb Trends in Beccar (2026)
Effective short term rental pricing strategy in Beccar involves understanding monthly ADR fluctuations. The Average Daily Rate (ADR) for Airbnb in Beccar typically peaks in December and dips lowest during February. Leveraging Airbnb dynamic pricing tools or strategies based on this seasonality can significantly boost revenue. Here's a look at the typical nightly rates achieved:
- Best-in-class properties (Top 10%) command rates of $251+ per night, often due to premium features or locations.
- Strong performing properties (Top 25%) achieve nightly rates of $142 or more.
- Typical properties (Median) charge around $78 per night.
- Entry-level properties (Bottom 25%) earn around $46 per night.
Average Daily Rate (ADR) Trend by Month in Beccar
Get Live Beccar Market Intelligence 👇

Explore Real-time Analytics
Airbnb Seasonality Analysis & Trends in Beccar (2026)
Peak Season (December, January, March)
- Revenue averages $1,728 per month
- Occupancy rates average 40.5%
- Daily rates average $118
Shoulder Season
- Revenue averages $1,096 per month
- Occupancy maintains around 37.4%
- Daily rates hold near $108
Low Season (May, September, October)
- Revenue drops to average $749 per month
- Occupancy decreases to average 28.7%
- Daily rates adjust to average $116
Seasonality Insights for Beccar
- The Airbnb seasonality in Beccar shows highly seasonal trends requiring careful strategy. While the sections above show seasonal averages, it's also insightful to look at the extremes:
- During the high season, the absolute peak month showcases Beccar's highest earning potential, with monthly revenues capable of climbing to $1,958, occupancy reaching a high of 47.6%, and ADRs peaking at $125.
- Conversely, the slowest single month of the year, typically falling within the low season, marks the market's lowest point. In this month, revenue might dip to $710, occupancy could drop to 26.5%, and ADRs may adjust down to $101.
- Understanding both the seasonal averages and these monthly peaks and troughs in revenue, occupancy, and ADR is crucial for maximizing your Airbnb profit potential in Beccar.
Seasonal Strategies for Maximizing Profit
- Peak Season: Maximize revenue through premium pricing and potentially longer minimum stays. Ensure high availability.
- Low Season: Offer competitive pricing, special promotions (e.g., extended stay discounts), and flexible cancellation policies. Target off-season travelers like remote workers or budget-conscious guests.
- Shoulder Seasons: Implement dynamic pricing that balances peak and low rates. Target weekend travelers or specific events. Offer slightly more flexible terms than peak season.
- Regularly analyze your own performance against these Beccar seasonality benchmarks and adjust your pricing and availability strategy accordingly.
Best Areas for Airbnb Investment in Beccar (2026)
Exploring the top neighborhoods for short-term rentals in Beccar? This section highlights key areas, outlining why they are attractive for hosts and guests, along with notable local attractions. Consider these locations based on your target guest profile and investment strategy.
| Neighborhood / Area | Why Host Here? (Target Guests & Appeal) | Key Attractions & Landmarks |
|---|---|---|
| Beccar Centro | The central area of Beccar, close to main transport links and local amenities. It's ideal for guests who want easy access to shops and restaurants. | Plaza de Beccar, Cinemark Beccar, Shopping Unicenter, Beccar Train Station, Local cafes and markets |
| San Isidro | Nearby San Isidro is well-known for its historical architecture, parks, and charming streets, attracting visitors who appreciate culture and nature. | San Isidro Cathedral, Vivero de Vistas, Museo Pueyrredon, Río de la Plata, Local artisan markets |
| Vicente López | This area is close to Beccar and offers a waterfront along the river with beautiful parks, ideal for families and outdoor enthusiasts. | Parque Vlady, Costanera Vicente López, Museo de Arte de Tigre, Rambla de la Costa, Beaches along the river |
| Martínez | Martínez offers a relaxed suburban atmosphere with good schools and green spaces, appealing to families and longer-term visitors. | Plaza Roca, Martínez Train Station, Local shops and restaurants, Parque de los Encuentros, Cultural events |
| Tigre | A popular tourist destination known for its waterways and recreational activities, including boat tours and sports, attracting both tourists and locals. | Parque de la Costa, Tigre Delta, Puerto de Frutos, Museo de Arte Tigre, Canal del Tigre |
| Santos Lugares | A more traditional area with local charm, perfect for guests looking for an authentic experience in the suburbs of Buenos Aires. | Local plazas, Cafes and bakeries, Cultural festivals, Workshops and local artisans, Proximity to main transport links |
| La Lucila | Often overlooked, this area has a strong community feel with proximity to parks and excellent transport options to greater Buenos Aires, attracting longer stays. | Plaza La Lucila, Cafes and bakeries, Local parks, Art galleries, Cultural events |
| Río de la Plata | The waterfront area along the Río de la Plata is ideal for outdoor activities and events, appealing to nature lovers and those looking for leisure. | Beaches along the river, Walking paths, Outdoor sports facilities, Local seafood restaurants, Scenic views |
Understanding Airbnb License Requirements & STR Laws in Beccar (2026)
While Beccar, Buenos Aires, Argentina currently shows low STR regulations, specific Airbnb license requirements might still exist or change. Always verify the latest short term rental regulations and Airbnb license requirements directly with local government authorities for Beccar to ensure full compliance before hosting.
(Source: AirROI data, 2026, finding no licensed listings among those analyzed)
Top Performing Airbnb Properties in Beccar (2026)
Benchmark your potential! Explore examples of top-performing Airbnb properties in Beccarbased on Trailing Twelve Month (TTM) revenue. Analyze their characteristics, revenue, occupancy rate, and ADR to understand what drives success in this market.
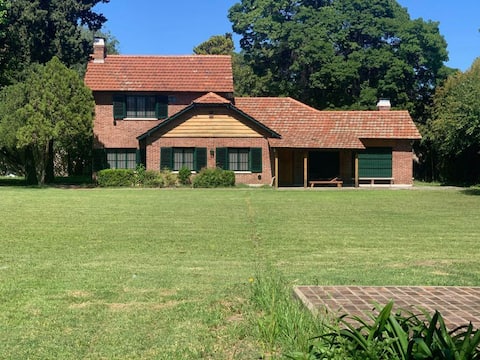
Country house in San Isidro
Entire Place • 5 bedrooms

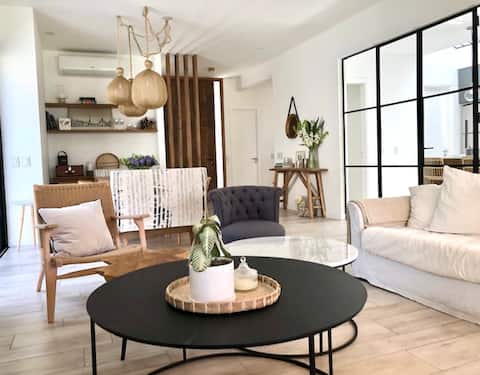
Casa Elflein
Entire Place • 3 bedrooms
Spacious house with garden and pool
Entire Place • 4 bedrooms

Beautiful house in a nice neighborhood
Entire Place • N/A

House with a pool and grill in San Isidro. Family-friendly
Entire Place • 3 bedrooms

Casa San Isidro Jardin Pileta.
Entire Place • 4 bedrooms
Note: Performance varies based on location, size, amenities, seasonality, and management quality. Data reflects the past 12 months.
Top Performing Airbnb Hosts in Beccar (2026)
Learn from the best! This table showcases top-performing Airbnb hosts in Beccar based on the number of properties managed and estimated total revenue over the past year. Analyze their scale and performance metrics.
| Host Name | Properties | Grossing Revenue | Stay Reviews | Avg Rating |
|---|---|---|---|---|
| Michay | 1 | $61,406 | 20 | 4.90/5.0 |
| Sandra Alicia | 1 | $37,279 | 5 | 5.00/5.0 |
| Sonia | 1 | $30,267 | 7 | 4.86/5.0 |
| Barbara | 5 | $27,633 | 100 | 4.76/5.0 |
| Felipe | 1 | $25,232 | 8 | 5.00/5.0 |
| Ana | 4 | $23,557 | 63 | 4.96/5.0 |
| Juan Ignacio | 1 | $22,742 | 10 | 5.00/5.0 |
| Federico Carlos | 1 | $21,165 | 25 | 5.00/5.0 |
| Gonzalo Maria | 1 | $20,975 | 35 | 4.86/5.0 |
| Martu Viglino | 1 | $20,611 | 21 | 4.90/5.0 |
Analyzing the strategies of top hosts, such as their property selection, pricing, and guest communication, can offer valuable lessons for optimizing your own Airbnb operations in Beccar.
Dive Deeper: Advanced Beccar STR Market Data (2026)
Ready to unlock more insights? AirROI provides access to advanced metrics and comprehensive Airbnb data for Beccar. Explore detailed analytics beyond this report to refine your investment strategy, optimize pricing, and maximize your vacation rental profits.
Explore Advanced MetricsBeccar Short-Term Rental Market Composition (2026): Property & Room Types
Room Type Distribution
Property Type Distribution
Market Composition Insights for Beccar
- The Beccar Airbnb market composition is heavily skewed towards Entire Home/Apt listings, which make up 78.4% of the 74 active rentals. This indicates strong guest preference for privacy and space.
- Looking at the property type distribution in Beccar, House properties are the most common (50%), reflecting the local real estate landscape.
- Houses represent a significant 50% portion, catering likely to families or larger groups.
- The presence of 9.5% Hotel/Boutique listings indicates integration with traditional hospitality.
- Smaller segments like others (combined 1.4%) offer potential for unique stay experiences.
Beccar Airbnb Room Capacity Analysis (2026): Bedroom Distribution
Distribution of Listings by Number of Bedrooms
Room Capacity Insights for Beccar
- The dominant room capacity in Beccar is 1 bedroom listings, making up 31.1% of the market. This suggests a strong demand for properties suitable for couples or solo travelers.
- Together, 1 bedroom and 2 bedrooms properties represent 55.4% of the active Airbnb listings in Beccar, indicating a high concentration in these sizes.
- A significant 24.4% of listings offer 3+ bedrooms, catering to larger groups and families seeking more space in Beccar.
Beccar Vacation Rental Guest Capacity Trends (2026)
Distribution of Listings by Guest Capacity
Guest Capacity Insights for Beccar
- The most common guest capacity trend in Beccar vacation rentals is listings accommodating 2 guests (27%). This suggests the primary traveler segment is likely couples or solo travelers.
- Properties designed for 2 guests and 4 guests dominate the Beccar STR market, accounting for 40.5% of listings.
- 20.4% of properties accommodate 6+ guests, serving the market segment for larger families or group travel in Beccar.
- On average, properties in Beccar are equipped to host 3.1 guests.
Beccar Airbnb Booking Patterns (2026): Available vs. Booked Days
Available Days Distribution
Booked Days Distribution
Booking Pattern Insights for Beccar
- The most common availability pattern in Beccar falls within the 271-366 days range, representing 64.9% of listings. This suggests many properties have significant open periods on their calendars.
- Approximately 90.6% of listings show high availability (181+ days open annually), indicating potential for increased bookings or specific owner usage patterns.
- For booked days, the 1-30 days range is most frequent in Beccar (32.4%), reflecting common guest stay durations or potential owner blocking patterns.
- A notable 9.5% of properties secure long booking periods (181+ days booked per year), highlighting successful long-term rental strategies or significant owner usage.
Beccar Airbnb Minimum Stay Requirements Analysis
Distribution of Listings by Minimum Night Requirement
1 Night
5 listings
6.8% of total
2 Nights
18 listings
24.3% of total
3 Nights
10 listings
13.5% of total
4-6 Nights
12 listings
16.2% of total
7-29 Nights
10 listings
13.5% of total
30+ Nights
19 listings
25.7% of total
Key Insights
- The most prevalent minimum stay requirement in Beccar is 30+ Nights, adopted by 25.7% of listings. This highlights the market's preference for longer commitments.
- A significant segment (25.7%) caters to monthly stays (30+ nights) in Beccar, pointing to opportunities in the extended-stay market.
Recommendations
- Align with the market by considering a 30+ Nights minimum stay, as 25.7% of Beccar hosts use this setting.
- If feasible, allowing 1-night stays, especially midweek or during low season, could capture last-minute bookings, as only 6.8% currently do.
- Explore offering discounts for stays of 30+ nights to attract the 25.7% of the market seeking extended stays.
- Adjust minimum nights based on seasonality – potentially shorter during low season and longer during peak demand periods in Beccar.
Beccar Airbnb Cancellation Policy Trends Analysis (2026)
Limited
1 listings
1.4% of total
Flexible
23 listings
31.1% of total
Moderate
19 listings
25.7% of total
Firm
31 listings
41.9% of total
Cancellation Policy Insights for Beccar
- The prevailing Airbnb cancellation policy trend in Beccar is Firm, used by 41.9% of listings.
- There's a relatively balanced mix between guest-friendly (56.8%) and stricter (41.9%) policies, offering choices for different guest needs.
Recommendations for Hosts
- Consider adopting a Firm policy to align with the 41.9% market standard in Beccar.
- Regularly review your cancellation policy against competitors and market demand shifts in Beccar.
Beccar STR Booking Lead Time Analysis (2026)
Average Booking Lead Time by Month
Booking Lead Time Insights for Beccar
- The overall average booking lead time for vacation rentals in Beccar is 38 days.
- Guests book furthest in advance for stays during March (average 60 days), likely coinciding with peak travel demand or local events.
- The shortest booking windows occur for stays in July (average 14 days), indicating more last-minute travel plans during this time.
- Seasonally, Winter (35 days avg.) sees the longest lead times, while Summer (16 days avg.) has the shortest, reflecting typical travel planning cycles.
Recommendations for Hosts
- Use the overall average lead time (38 days) as a baseline for your pricing and availability strategy in Beccar.
- For March stays, consider implementing length-of-stay discounts or slightly higher rates for bookings made less than 60 days out to capitalize on advance planning.
- During July, focus on last-minute booking availability and promotions, as guests book with very short notice (14 days avg.).
- Target marketing efforts for the Winter season well in advance (at least 35 days) to capture early planners.
- Monitor your own booking lead times against these Beccar averages to identify opportunities for dynamic pricing adjustments.
Popular & Essential Airbnb Amenities in Beccar (2026)
Amenity Prevalence
Amenity Insights for Beccar
- Essential amenities in Beccar that guests expect include: Wifi. Lacking these (this) could significantly impact bookings.
- Popular amenities like Heating, Kitchen, TV are common but not universal. Offering these can provide a competitive edge.
Recommendations for Hosts
- Ensure your listing includes all essential amenities for Beccar: Wifi.
- Prioritize adding missing essentials: Wifi.
- Consider adding popular differentiators like Heating or Kitchen to increase appeal.
- Highlight unique or less common amenities you offer (e.g., hot tub, dedicated workspace, EV charger) in your listing description and photos.
- Regularly check competitor amenities in Beccar to stay competitive.
Beccar Airbnb Guest Demographics & Profile Analysis (2026)
Guest Profile Summary for Beccar
- The typical guest profile for Airbnb in Beccar consists of a mix of domestic (53%) and international guests, often arriving from nearby Buenos Aires, typically belonging to the Post-2000s (Gen Z/Alpha) group (50%), primarily speaking English or Spanish.
- Domestic travelers account for 53.1% of guests.
- Key international markets include Argentina (53.1%) and United States (11.3%).
- Top languages spoken are English (37.3%) followed by Spanish (36.4%).
- A significant demographic segment is the Post-2000s (Gen Z/Alpha) group, representing 50% of guests.
Recommendations for Hosts
- Balance marketing efforts between domestic and international channels based on the guest mix.
- Tailor amenities and listing descriptions to appeal to the dominant Post-2000s (Gen Z/Alpha) demographic (e.g., highlight fast WiFi, smart home features, local guides).
- Highlight unique local experiences or amenities relevant to the primary guest profile.
- Consider seasonal promotions aligned with peak travel times for key origin markets.
Nearby Short-Term Rental Market Comparison
How does the Beccar Airbnb market stack up against its neighbors? Compare key performance metrics like average monthly revenue, ADR, and occupancy rates in surrounding areas to understand the broader regional STR landscape.
| Market | Active Properties | Monthly Revenue | Daily Rate | Avg. Occupancy |
|---|---|---|---|---|
| Colonia Esterella | 13 | $1,620 | $328.28 | 23% |
| Open Door | 12 | $1,533 | $211.34 | 27% |
| El Cazador | 25 | $1,285 | $174.20 | 33% |
| Luján | 49 | $1,278 | $152.81 | 36% |
| Don Torcuato | 14 | $1,272 | $205.31 | 35% |
| Lobos | 49 | $1,268 | $253.18 | 28% |
| General Pacheco | 13 | $1,250 | $196.50 | 35% |
| Carmelo | 40 | $1,230 | $172.77 | 27% |
| Manzanares | 18 | $1,227 | $216.77 | 30% |
| Exaltación de la Cruz | 32 | $1,124 | $181.17 | 32% |