Benavídez Airbnb Market Analysis 2026: Short Term Rental Data & Vacation Rental Statistics in Buenos Aires, Argentina
Is Airbnb profitable in Benavídez in 2026? Explore comprehensive Airbnb analytics for Benavídez, Buenos Aires, Argentina to uncover income potential. This 2026 STR market report for Benavídez, based on AirROI data from June 2024 to May 2025, reveals key trends in the niche market of 18 active listings.
Whether you're considering an Airbnb investment in Benavídez, optimizing your existing vacation rental, or exploring rental arbitrage opportunities, understanding the Benavídez Airbnb data is crucial. Leveraging the low regulation environment is key to maximizing your short term rental income potential. Let's dive into the specifics.
Key Benavídez Airbnb Performance Metrics Overview
Monthly Airbnb Revenue Variations & Income Potential in Benavídez (2026)
Understanding the monthly revenue variations for Airbnb listings in Benavídez is key to maximizing your short term rental income potential. Seasonality significantly impacts earnings. Our analysis, based on data from the past 12 months, shows that the peak revenue month for STRs in Benavídez is typically January, while August often presents the lowest earnings, highlighting opportunities for strategic pricing adjustments during shoulder and low seasons. Explore the typical Airbnb income in Benavídez across different performance tiers:
- Best-in-class properties (Top 10%) achieve $2,212+ monthly, often utilizing dynamic pricing and superior guest experiences.
- Strong performing properties (Top 25%) earn $1,205 or more, indicating effective management and desirable locations/amenities.
- Typical properties (Median) generate around $670 per month, representing the average market performance.
- Entry-level properties (Bottom 25%) see earnings around $293, often with potential for optimization.
Average Monthly Airbnb Earnings Trend in Benavídez
Benavídez Airbnb Occupancy Rate Trends (2026)
Maximize your bookings by understanding the Benavídez STR occupancy trends. Seasonal demand shifts significantly influence how often properties are booked. Typically, Januarysees the highest demand (peak season occupancy), while June experiences the lowest (low season). Effective strategies, like adjusting minimum stays or offering promotions, can boost occupancy during slower periods. Here's how different property tiers perform in Benavídez:
- Best-in-class properties (Top 10%) achieve 56%+ occupancy, indicating high desirability and potentially optimized availability.
- Strong performing properties (Top 25%) maintain 39% or higher occupancy, suggesting good market fit and guest satisfaction.
- Typical properties (Median) have an occupancy rate around 20%.
- Entry-level properties (Bottom 25%) average 7% occupancy, potentially facing higher vacancy.
Average Monthly Occupancy Rate Trend in Benavídez
Average Daily Rate (ADR) Airbnb Trends in Benavídez (2026)
Effective short term rental pricing strategy in Benavídez involves understanding monthly ADR fluctuations. The Average Daily Rate (ADR) for Airbnb in Benavídez typically peaks in February and dips lowest during July. Leveraging Airbnb dynamic pricing tools or strategies based on this seasonality can significantly boost revenue. Here's a look at the typical nightly rates achieved:
- Best-in-class properties (Top 10%) command rates of $317+ per night, often due to premium features or locations.
- Strong performing properties (Top 25%) achieve nightly rates of $229 or more.
- Typical properties (Median) charge around $119 per night.
- Entry-level properties (Bottom 25%) earn around $56 per night.
Average Daily Rate (ADR) Trend by Month in Benavídez
Get Live Benavídez Market Intelligence 👇

Explore Real-time Analytics
Airbnb Seasonality Analysis & Trends in Benavídez (2025)
Peak Season (January, December, April)
- Revenue averages $1,470 per month
- Occupancy rates average 32.7%
- Daily rates average $163
Shoulder Season
- Revenue averages $937 per month
- Occupancy maintains around 28.4%
- Daily rates hold near $158
Low Season (June, August, September)
- Revenue drops to average $449 per month
- Occupancy decreases to average 15.3%
- Daily rates adjust to average $136
Seasonality Insights for Benavídez
- The Airbnb seasonality in Benavídez shows highly seasonal trends requiring careful strategy. While the sections above show seasonal averages, it's also insightful to look at the extremes:
- During the high season, the absolute peak month showcases Benavídez's highest earning potential, with monthly revenues capable of climbing to $1,599, occupancy reaching a high of 38.7%, and ADRs peaking at $185.
- Conversely, the slowest single month of the year, typically falling within the low season, marks the market's lowest point. In this month, revenue might dip to $199, occupancy could drop to 11.5%, and ADRs may adjust down to $134.
- Understanding both the seasonal averages and these monthly peaks and troughs in revenue, occupancy, and ADR is crucial for maximizing your Airbnb profit potential in Benavídez.
Seasonal Strategies for Maximizing Profit
- Peak Season: Maximize revenue through premium pricing and potentially longer minimum stays. Ensure high availability.
- Low Season: Offer competitive pricing, special promotions (e.g., extended stay discounts), and flexible cancellation policies. Target off-season travelers like remote workers or budget-conscious guests.
- Shoulder Seasons: Implement dynamic pricing that balances peak and low rates. Target weekend travelers or specific events. Offer slightly more flexible terms than peak season.
- Regularly analyze your own performance against these Benavídez seasonality benchmarks and adjust your pricing and availability strategy accordingly.
Best Areas for Airbnb Investment in Benavídez (2026)
Exploring the top neighborhoods for short-term rentals in Benavídez? This section highlights key areas, outlining why they are attractive for hosts and guests, along with notable local attractions. Consider these locations based on your target guest profile and investment strategy.
| Neighborhood / Area | Why Host Here? (Target Guests & Appeal) | Key Attractions & Landmarks |
|---|---|---|
| Benavídez Centro | The bustling center of Benavídez with shops, restaurants, and easy access to public transport. Suitable for travelers looking for convenience and local experience. | Estación Benavídez, Plaza de los Italianos, Local markets, Restaurants and cafes |
| Villa Nueva | A tranquil residential area with family-friendly amenities, perfect for visitors seeking a peaceful retreat. | Parque de la Unidad Nacional, Local parks, Riverbank views |
| Barrio Parque | A picturesque neighborhood known for its green spaces and charming homes, attracting families and nature lovers. | Parque El Jagüel, Scenic walking trails, Community events |
| Rincón de Milberg | A quiet suburb near the river, ideal for guests wanting to escape the city hustle while still being close to amenities. | Rio Lujan, Fishing spots, Nature walks |
| Tigre | Close to the Tigre Delta, offering water sports and natural beauty. A popular destination for weekend getaways. | Parque de la Costa, Canoeing experiences, Tigre Museum |
| Don Torcuato | A suburban area with a local vibe, perfect for experiencing the everyday life of Argentine residents. | Local shops, Cafés, Cultural events |
| Nordelta | An upscale gated community with luxury amenities, appealing to affluent travelers looking for a premium experience. | Nordelta Shopping, Lakes and parks, Exclusive restaurants |
| Pilar | A growing city nearby, known for its shopping and recreational options, great for business and leisure travelers alike. | Shopping centers, Golf courses, Cultural sites |
Understanding Airbnb License Requirements & STR Laws in Benavídez (2026)
While Benavídez, Buenos Aires, Argentina currently shows low STR regulations, specific Airbnb license requirements might still exist or change. Always verify the latest short term rental regulations and Airbnb license requirements directly with local government authorities for Benavídez to ensure full compliance before hosting.
(Source: AirROI data, 2026, finding no licensed listings among those analyzed)
Top Performing Airbnb Properties in Benavídez (2026)
Benchmark your potential! Explore examples of top-performing Airbnb properties in Benavídezbased on Trailing Twelve Month (TTM) revenue. Analyze their characteristics, revenue, occupancy rate, and ADR to understand what drives success in this market.
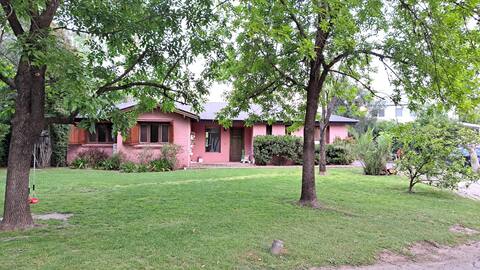
Casa en Barrio Las Glorias
Entire Place • 3 bedrooms

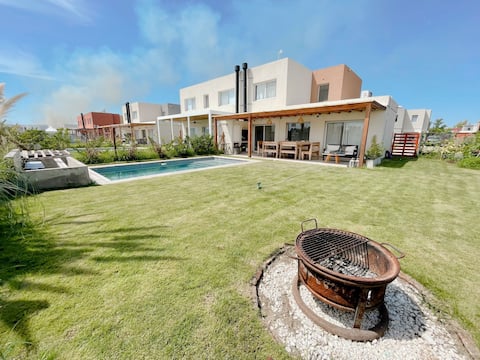
Cabana Nordelta C / POOL ON THE EDGE OF THE RIVER
Entire Place • 2 bedrooms

Casa en el Bosque
Entire Place • 4 bedrooms

Espectacular casa a la laguna
Entire Place • 4 bedrooms
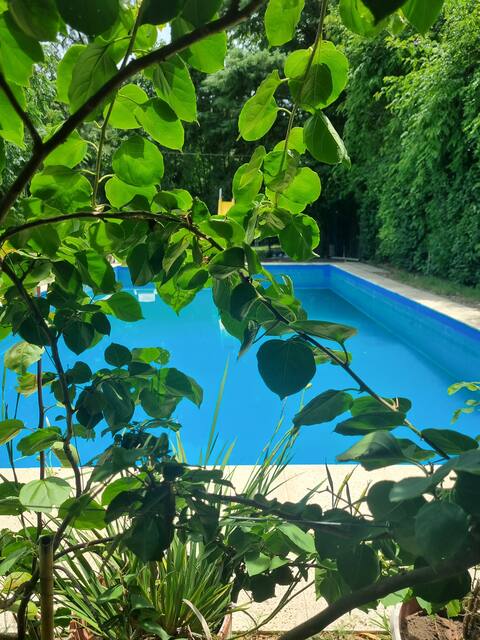
Casa con pileta en Benavidez
Entire Place • 2 bedrooms
5th Benavidez
Entire Place • 3 bedrooms
Note: Performance varies based on location, size, amenities, seasonality, and management quality. Data reflects the past 12 months.
Top Performing Airbnb Hosts in Benavídez (2026)
Learn from the best! This table showcases top-performing Airbnb hosts in Benavídez based on the number of properties managed and estimated total revenue over the past year. Analyze their scale and performance metrics.
| Host Name | Properties | Grossing Revenue | Stay Reviews | Avg Rating |
|---|---|---|---|---|
| Host #226575500 | 1 | $13,779 | 0 | Not Rated |
| Luciano | 1 | $12,446 | 8 | 4.50/5.0 |
| Host #52294532 | 1 | $11,352 | 0 | Not Rated |
| Host #117323370 | 1 | $9,499 | 0 | Not Rated |
| Host #66601551 | 1 | $9,242 | 0 | Not Rated |
| Anabella | 1 | $9,099 | 3 | 5.00/5.0 |
| Host #461546748 | 1 | $8,458 | 0 | Not Rated |
| Mariano | 1 | $7,729 | 99 | 4.89/5.0 |
| Gabriel | 1 | $4,932 | 53 | 4.83/5.0 |
| Gustavo | 1 | $3,614 | 3 | 5.00/5.0 |
Analyzing the strategies of top hosts, such as their property selection, pricing, and guest communication, can offer valuable lessons for optimizing your own Airbnb operations in Benavídez.
Dive Deeper: Advanced Benavídez STR Market Data (2026)
Ready to unlock more insights? AirROI provides access to advanced metrics and comprehensive Airbnb data for Benavídez. Explore detailed analytics beyond this report to refine your investment strategy, optimize pricing, and maximize your vacation rental profits.
Explore Advanced MetricsBenavídez Short-Term Rental Market Composition (2026): Property & Room Types
Room Type Distribution
Property Type Distribution
Market Composition Insights for Benavídez
- The Benavídez Airbnb market composition is heavily skewed towards Entire Home/Apt listings, which make up 88.9% of the 18 active rentals. This indicates strong guest preference for privacy and space.
- Looking at the property type distribution in Benavídez, House properties are the most common (66.7%), reflecting the local real estate landscape.
- Houses represent a significant 66.7% portion, catering likely to families or larger groups.
- The presence of 11.1% Hotel/Boutique listings indicates integration with traditional hospitality.
Benavídez Airbnb Room Capacity Analysis (2026): Bedroom Distribution
Distribution of Listings by Number of Bedrooms
Room Capacity Insights for Benavídez
- The dominant room capacity in Benavídez is 3 bedrooms listings, making up 33.3% of the market. This suggests a strong demand for properties suitable for families or small groups.
- Together, 3 bedrooms and 2 bedrooms properties represent 55.5% of the active Airbnb listings in Benavídez, indicating a high concentration in these sizes.
- A significant 61.1% of listings offer 3+ bedrooms, catering to larger groups and families seeking more space in Benavídez.
Benavídez Vacation Rental Guest Capacity Trends (2026)
Distribution of Listings by Guest Capacity
Guest Capacity Insights for Benavídez
- The most common guest capacity trend in Benavídez vacation rentals is listings accommodating 7 guests (27.8%). This suggests the primary traveler segment is likely larger groups.
- Properties designed for 7 guests and 4 guests dominate the Benavídez STR market, accounting for 50.0% of listings.
- 44.5% of properties accommodate 6+ guests, serving the market segment for larger families or group travel in Benavídez.
- On average, properties in Benavídez are equipped to host 4.9 guests.
Benavídez Airbnb Booking Patterns (2026): Available vs. Booked Days
Available Days Distribution
Booked Days Distribution
Booking Pattern Insights for Benavídez
- The most common availability pattern in Benavídez falls within the 271-366 days range, representing 83.3% of listings. This suggests many properties have significant open periods on their calendars.
- Approximately 100.0% of listings show high availability (181+ days open annually), indicating potential for increased bookings or specific owner usage patterns.
- For booked days, the 1-30 days range is most frequent in Benavídez (50%), reflecting common guest stay durations or potential owner blocking patterns.
Benavídez Airbnb Minimum Stay Requirements Analysis
Distribution of Listings by Minimum Night Requirement
1 Night
3 listings
17.6% of total
3 Nights
2 listings
11.8% of total
4-6 Nights
2 listings
11.8% of total
7-29 Nights
7 listings
41.2% of total
30+ Nights
3 listings
17.6% of total
Key Insights
- The most prevalent minimum stay requirement in Benavídez is 7-29 Nights, adopted by 41.2% of listings. This highlights the market's preference for shorter, flexible bookings.
- Very short stays (1-2 nights) are less common (17.6%), suggesting hosts prefer slightly longer bookings to optimize turnover.
- A significant segment (17.6%) caters to monthly stays (30+ nights) in Benavídez, pointing to opportunities in the extended-stay market.
Recommendations
- Align with the market by considering a 7-29 Nights minimum stay, as 41.2% of Benavídez hosts use this setting.
- If feasible, allowing 1-night stays, especially midweek or during low season, could capture last-minute bookings, as only 17.6% currently do.
- Explore offering discounts for stays of 30+ nights to attract the 17.6% of the market seeking extended stays.
- Adjust minimum nights based on seasonality – potentially shorter during low season and longer during peak demand periods in Benavídez.
Benavídez Airbnb Cancellation Policy Trends Analysis (2026)
Flexible
3 listings
33.3% of total
Moderate
1 listings
11.1% of total
Firm
4 listings
44.4% of total
Strict
1 listings
11.1% of total
Cancellation Policy Insights for Benavídez
- The prevailing Airbnb cancellation policy trend in Benav�ídez is Firm, used by 44.4% of listings.
- A majority (55.5%) of hosts in Benavídez utilize Firm or Strict policies, indicating a market where hosts prioritize booking security.
Recommendations for Hosts
- Consider adopting a Firm policy to align with the 44.4% market standard in Benavídez.
- Using a Strict policy might deter some guests, as only 11.1% of listings use it. Evaluate if potential revenue protection outweighs possible lower booking rates.
- Regularly review your cancellation policy against competitors and market demand shifts in Benavídez.
Benavídez STR Booking Lead Time Analysis (2026)
Average Booking Lead Time by Month
Booking Lead Time Insights for Benavídez
- The overall average booking lead time for vacation rentals in Benavídez is 29 days.
- Guests book furthest in advance for stays during July (average 83 days), likely coinciding with peak travel demand or local events.
- The shortest booking windows occur for stays in May (average 8 days), indicating more last-minute travel plans during this time.
- Seasonally, Summer (47 days avg.) sees the longest lead times, while Spring (17 days avg.) has the shortest, reflecting typical travel planning cycles.
Recommendations for Hosts
- Use the overall average lead time (29 days) as a baseline for your pricing and availability strategy in Benavídez.
- For July stays, consider implementing length-of-stay discounts or slightly higher rates for bookings made less than 83 days out to capitalize on advance planning.
- During May, focus on last-minute booking availability and promotions, as guests book with very short notice (8 days avg.).
- Target marketing efforts for the Summer season well in advance (at least 47 days) to capture early planners.
- Monitor your own booking lead times against these Benavídez averages to identify opportunities for dynamic pricing adjustments.
Popular & Essential Airbnb Amenities in Benavídez (2026)
Amenity Prevalence
Amenity Insights for Benavídez
- Essential amenities in Benavídez that guests expect include: Wifi, Air conditioning. Lacking these (any) could significantly impact bookings.
- Popular amenities like TV, Pool, Free parking on premises are common but not universal. Offering these can provide a competitive edge.
- A pool is a highly desired but not standard amenity, making it a key feature for attracting guests seeking leisure in Benavídez.
Recommendations for Hosts
- Ensure your listing includes all essential amenities for Benavídez: Wifi, Air conditioning.
- Consider adding popular differentiators like TV or Pool to increase appeal.
- Highlight unique or less common amenities you offer (e.g., hot tub, dedicated workspace, EV charger) in your listing description and photos.
- Regularly check competitor amenities in Benavídez to stay competitive.
Benavídez Airbnb Guest Demographics & Profile Analysis (2026)
Guest Profile Summary for Benavídez
- The typical guest profile for Airbnb in Benavídez consists of a mix of domestic (65%) and international guests, often arriving from nearby Buenos Aires, typically belonging to the 1980s (Millennials) group (50%), primarily speaking Spanish or English.
- Domestic travelers account for 65.0% of guests.
- Key international markets include Argentina (65%) and Brazil (10%).
- Top languages spoken are Spanish (44%) followed by English (28%).
- A significant demographic segment is the Post-2000s (Gen Z/Alpha) group, representing 50% of guests.
Recommendations for Hosts
- Target domestic marketing efforts towards travelers from Buenos Aires and Santiago.
- Tailor amenities and listing descriptions to appeal to the dominant 1980s (Millennials) demographic (e.g., highlight fast WiFi, smart home features, local guides).
- Highlight unique local experiences or amenities relevant to the primary guest profile.
- Consider seasonal promotions aligned with peak travel times for key origin markets.
Nearby Short-Term Rental Market Comparison
How does the Benavídez Airbnb market stack up against its neighbors? Compare key performance metrics like average monthly revenue, ADR, and occupancy rates in surrounding areas to understand the broader regional STR landscape.
| Market | Active Properties | Monthly Revenue | Daily Rate | Avg. Occupancy |
|---|---|---|---|---|
| Colonia Esterella | 10 | $1,823 | $256.09 | 33% |
| Open Door | 11 | $1,814 | $215.17 | 35% |
| Exaltación de la Cruz | 23 | $1,275 | $175.76 | 34% |
| Lobos | 52 | $1,256 | $212.94 | 27% |
| El Cazador | 28 | $1,253 | $180.39 | 34% |
| Rincón de Milberg | 55 | $1,150 | $168.68 | 38% |
| General Pacheco | 14 | $1,112 | $178.82 | 37% |
| Manzanares | 22 | $1,081 | $179.55 | 31% |
| Don Torcuato | 21 | $1,021 | $171.27 | 28% |
| Ingeniero Maschwitz | 40 | $956 | $134.80 | 34% |