Cañuelas Airbnb Market Analysis 2026: Short Term Rental Data & Vacation Rental Statistics in Buenos Aires, Argentina
Is Airbnb profitable in Cañuelas in 2026? Explore comprehensive Airbnb analytics for Cañuelas, Buenos Aires, Argentina to uncover income potential. This 2026 STR market report for Cañuelas, based on AirROI data from January 2025 to December 2025, reveals key trends in the niche market of 18 active listings.
Whether you're considering an Airbnb investment in Cañuelas, optimizing your existing vacation rental, or exploring rental arbitrage opportunities, understanding the Cañuelas Airbnb data is crucial. Leveraging the low regulation environment is key to maximizing your short term rental income potential. Let's dive into the specifics.
Key Cañuelas Airbnb Performance Metrics Overview
Monthly Airbnb Revenue Variations & Income Potential in Cañuelas (2026)
Understanding the monthly revenue variations for Airbnb listings in Cañuelas is key to maximizing your short term rental income potential. Seasonality significantly impacts earnings. Our analysis, based on data from the past 12 months, shows that the peak revenue month for STRs in Cañuelas is typically March, while June often presents the lowest earnings, highlighting opportunities for strategic pricing adjustments during shoulder and low seasons. Explore the typical Airbnb income in Cañuelas across different performance tiers:
- Best-in-class properties (Top 10%) achieve $3,549+ monthly, often utilizing dynamic pricing and superior guest experiences.
- Strong performing properties (Top 25%) earn $1,539 or more, indicating effective management and desirable locations/amenities.
- Typical properties (Median) generate around $605 per month, representing the average market performance.
- Entry-level properties (Bottom 25%) see earnings around $378, often with potential for optimization.
Average Monthly Airbnb Earnings Trend in Cañuelas
Cañuelas Airbnb Occupancy Rate Trends (2026)
Maximize your bookings by understanding the Cañuelas STR occupancy trends. Seasonal demand shifts significantly influence how often properties are booked. Typically, Februarysees the highest demand (peak season occupancy), while May experiences the lowest (low season). Effective strategies, like adjusting minimum stays or offering promotions, can boost occupancy during slower periods. Here's how different property tiers perform in Cañuelas:
- Best-in-class properties (Top 10%) achieve 56%+ occupancy, indicating high desirability and potentially optimized availability.
- Strong performing properties (Top 25%) maintain 32% or higher occupancy, suggesting good market fit and guest satisfaction.
- Typical properties (Median) have an occupancy rate around 21%.
- Entry-level properties (Bottom 25%) average 13% occupancy, potentially facing higher vacancy.
Average Monthly Occupancy Rate Trend in Cañuelas
Average Daily Rate (ADR) Airbnb Trends in Cañuelas (2026)
Effective short term rental pricing strategy in Cañuelas involves understanding monthly ADR fluctuations. The Average Daily Rate (ADR) for Airbnb in Cañuelas typically peaks in December and dips lowest during April. Leveraging Airbnb dynamic pricing tools or strategies based on this seasonality can significantly boost revenue. Here's a look at the typical nightly rates achieved:
- Best-in-class properties (Top 10%) command rates of $289+ per night, often due to premium features or locations.
- Strong performing properties (Top 25%) achieve nightly rates of $173 or more.
- Typical properties (Median) charge around $118 per night.
- Entry-level properties (Bottom 25%) earn around $67 per night.
Average Daily Rate (ADR) Trend by Month in Cañuelas
Get Live Cañuelas Market Intelligence 👇

Explore Real-time Analytics
Airbnb Seasonality Analysis & Trends in Cañuelas (2025)
Peak Season (March, February, December)
- Revenue averages $2,234 per month
- Occupancy rates average 34.5%
- Daily rates average $153
Shoulder Season
- Revenue averages $1,196 per month
- Occupancy maintains around 22.7%
- Daily rates hold near $152
Low Season (June, September, October)
- Revenue drops to average $800 per month
- Occupancy decreases to average 22.3%
- Daily rates adjust to average $154
Seasonality Insights for Cañuelas
- The Airbnb seasonality in Cañuelas shows highly seasonal trends requiring careful strategy. While the sections above show seasonal averages, it's also insightful to look at the extremes:
- During the high season, the absolute peak month showcases Cañuelas's highest earning potential, with monthly revenues capable of climbing to $2,381, occupancy reaching a high of 39.3%, and ADRs peaking at $177.
- Conversely, the slowest single month of the year, typically falling within the low season, marks the market's lowest point. In this month, revenue might dip to $488, occupancy could drop to 14.9%, and ADRs may adjust down to $139.
- Understanding both the seasonal averages and these monthly peaks and troughs in revenue, occupancy, and ADR is crucial for maximizing your Airbnb profit potential in Cañuelas.
Seasonal Strategies for Maximizing Profit
- Peak Season: Maximize revenue through premium pricing and potentially longer minimum stays. Ensure high availability.
- Low Season: Offer competitive pricing, special promotions (e.g., extended stay discounts), and flexible cancellation policies. Target off-season travelers like remote workers or budget-conscious guests.
- Shoulder Seasons: Implement dynamic pricing that balances peak and low rates. Target weekend travelers or specific events. Offer slightly more flexible terms than peak season.
- Regularly analyze your own performance against these Cañuelas seasonality benchmarks and adjust your pricing and availability strategy accordingly.
Best Areas for Airbnb Investment in Cañuelas (2026)
Exploring the top neighborhoods for short-term rentals in Cañuelas? This section highlights key areas, outlining why they are attractive for hosts and guests, along with notable local attractions. Consider these locations based on your target guest profile and investment strategy.
| Neighborhood / Area | Why Host Here? (Target Guests & Appeal) | Key Attractions & Landmarks |
|---|---|---|
| Cañuelas Centro | The central area of Cañuelas with easy access to shops and restaurants. Ideal for guests who want to experience local culture and convenience. | Plaza San Martín, Cañuelas Railway Station, Museo Histórico Municipal, Parroquia San Juan Bautista |
| La Garita | A picturesque neighborhood on the outskirts, known for its rural charm and green spaces, attracting nature lovers and families. | La Garita Park, Estancias, Local farms |
| Cañuelas Golf Club | A popular destination for golf enthusiasts with leisure facilities, making it attractive for those looking for a luxury stay in a green environment. | Cañuelas Golf Club facilities, Scenic views, Golf courses |
| Los Pozos | A rural locality featuring tranquil landscapes and outdoor activities, appealing to guests seeking peace and nature. | Nature trails, Rural retreats, Local vineyards |
| Cañuelas - Ruta 6 | Strategically located near the highway, providing easy access for travelers heading to Buenos Aires or Montevideo, ideal for transient guests. | Local roadside attractions, Gastronomic stops, Diverse local markets |
| Devoto | A nearby town with a strong residential community and local charm, appealing to guests looking for authenticity and local immersion. | Local festivals, Artisan markets, Cultural events |
| Villa Cañuelas | A suburban area with beautiful houses and parks, suitable for families and longer stays in a more relaxed setting. | Plazas de Villa Cañuelas, Family-friendly parks, Community events |
| Parque del Lago | A scenic area by the lake offering outdoor activities and natural beauty, attracting those who enjoy water and recreational activities. | The Lake, Walking trails, Picnic areas |
Understanding Airbnb License Requirements & STR Laws in Cañuelas (2026)
While Cañuelas, Buenos Aires, Argentina currently shows low STR regulations, specific Airbnb license requirements might still exist or change. Always verify the latest short term rental regulations and Airbnb license requirements directly with local government authorities for Cañuelas to ensure full compliance before hosting.
(Source: AirROI data, 2026, finding no licensed listings among those analyzed)
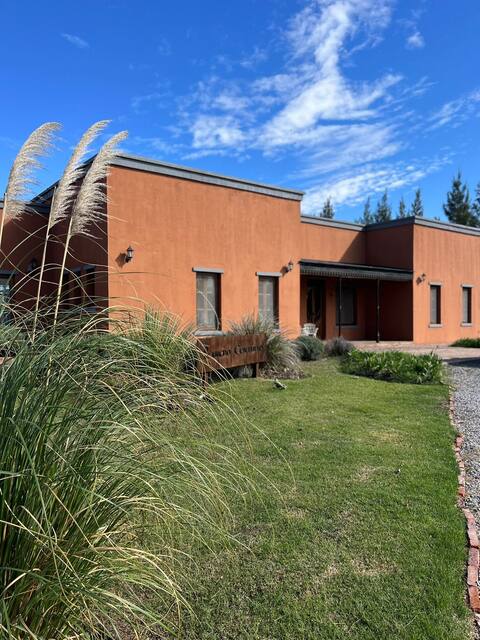
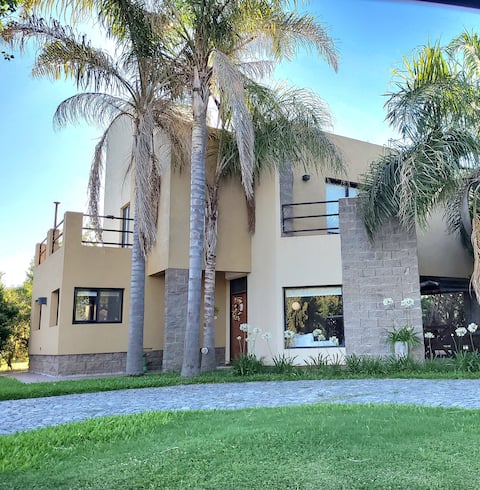
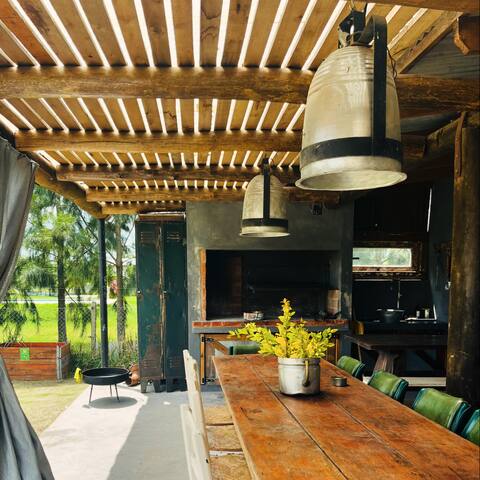
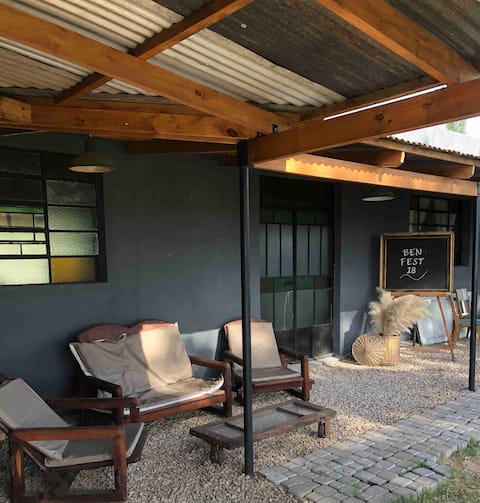
Top Performing Airbnb Properties in Cañuelas (2026)
Benchmark your potential! Explore examples of top-performing Airbnb properties in Cañuelasbased on Trailing Twelve Month (TTM) revenue. Analyze their characteristics, revenue, occupancy rate, and ADR to understand what drives success in this market.

Apartment in the best area of Buenos Aires
Entire Place • 7 bedrooms
Rancho Contento Polo House.
Private Room • 4 bedrooms
House in a gated community
Entire Place • 2 bedrooms

Las Pepenitas
Entire Place • 2 bedrooms
Casa de Campo - Quinta Cañuelas 'Oma Lenni'
Entire Place • 2 bedrooms
Casa Descanso Cañuelas Pet Friendly “Oma Lenni”
Entire Place • 2 bedrooms
Note: Performance varies based on location, size, amenities, seasonality, and management quality. Data reflects the past 12 months.
Top Performing Airbnb Hosts in Cañuelas (2026)
Learn from the best! This table showcases top-performing Airbnb hosts in Cañuelas based on the number of properties managed and estimated total revenue over the past year. Analyze their scale and performance metrics.
| Host Name | Properties | Grossing Revenue | Stay Reviews | Avg Rating |
|---|---|---|---|---|
| Antonia | 1 | $69,155 | 21 | 5.00/5.0 |
| Enrique Esteban | 1 | $25,446 | 5 | 4.60/5.0 |
| Ceci | 3 | $16,878 | 30 | 4.90/5.0 |
| Monica | 1 | $16,839 | 14 | 4.93/5.0 |
| Gabriela | 1 | $14,119 | 14 | 4.64/5.0 |
| Mariela Gladis | 2 | $6,840 | 3 | Not Rated |
| Espacio | 2 | $5,773 | 21 | 4.89/5.0 |
| Romina | 1 | $4,318 | 34 | 4.62/5.0 |
| Laura | 1 | $2,890 | 13 | 4.69/5.0 |
| María Yasmin | 1 | $2,158 | 3 | 4.67/5.0 |
Analyzing the strategies of top hosts, such as their property selection, pricing, and guest communication, can offer valuable lessons for optimizing your own Airbnb operations in Cañuelas.
Dive Deeper: Advanced Cañuelas STR Market Data (2026)
Ready to unlock more insights? AirROI provides access to advanced metrics and comprehensive Airbnb data for Cañuelas. Explore detailed analytics beyond this report to refine your investment strategy, optimize pricing, and maximize your vacation rental profits.
Explore Advanced MetricsCañuelas Short-Term Rental Market Composition (2026): Property & Room Types
Room Type Distribution
Property Type Distribution
Market Composition Insights for Cañuelas
- The Cañuelas Airbnb market composition is heavily skewed towards Entire Home/Apt listings, which make up 94.4% of the 18 active rentals. This indicates strong guest preference for privacy and space.
- Looking at the property type distribution in Cañuelas, House properties are the most common (83.3%), reflecting the local real estate landscape.
- Houses represent a significant 83.3% portion, catering likely to families or larger groups.
Cañuelas Airbnb Room Capacity Analysis (2026): Bedroom Distribution
Distribution of Listings by Number of Bedrooms
Room Capacity Insights for Cañuelas
- The dominant room capacity in Cañuelas is 1 bedroom listings, making up 38.9% of the market. This suggests a strong demand for properties suitable for couples or solo travelers.
- Together, 1 bedroom and 2 bedrooms properties represent 66.7% of the active Airbnb listings in Cañuelas, indicating a high concentration in these sizes.
- A significant 33.4% of listings offer 3+ bedrooms, catering to larger groups and families seeking more space in Cañuelas.
Cañuelas Vacation Rental Guest Capacity Trends (2026)
Distribution of Listings by Guest Capacity
Guest Capacity Insights for Cañuelas
- The most common guest capacity trend in Cañuelas vacation rentals is listings accommodating 4 guests (33.3%). This suggests the primary traveler segment is likely small families or groups.
- Properties designed for 4 guests and 8+ guests dominate the Cañuelas STR market, accounting for 55.5% of listings.
- 33.4% of properties accommodate 6+ guests, serving the market segment for larger families or group travel in Cañuelas.
- On average, properties in Cañuelas are equipped to host 4.8 guests.
Cañuelas Airbnb Booking Patterns (2026): Available vs. Booked Days
Available Days Distribution
Booked Days Distribution
Booking Pattern Insights for Cañuelas
- The most common availability pattern in Cañuelas falls within the 271-366 days range, representing 88.9% of listings. This suggests many properties have significant open periods on their calendars.
- Approximately 94.5% of listings show high availability (181+ days open annually), indicating potential for increased bookings or specific owner usage patterns.
- For booked days, the 1-30 days range is most frequent in Cañuelas (44.4%), reflecting common guest stay durations or potential owner blocking patterns.
- A notable 5.6% of properties secure long booking periods (181+ days booked per year), highlighting successful long-term rental strategies or significant owner usage.
Cañuelas Airbnb Minimum Stay Requirements Analysis
Distribution of Listings by Minimum Night Requirement
1 Night
7 listings
38.9% of total
2 Nights
1 listings
5.6% of total
4-6 Nights
3 listings
16.7% of total
30+ Nights
7 listings
38.9% of total
Key Insights
- The most prevalent minimum stay requirement in Cañuelas is 1 Night, adopted by 38.9% of listings. This highlights the market's preference for shorter, flexible bookings.
- A significant segment (38.9%) caters to monthly stays (30+ nights) in Cañuelas, pointing to opportunities in the extended-stay market.
Recommendations
- Align with the market by considering a 1 Night minimum stay, as 38.9% of Cañuelas hosts use this setting.
- Explore offering discounts for stays of 30+ nights to attract the 38.9% of the market seeking extended stays.
- Adjust minimum nights based on seasonality – potentially shorter during low season and longer during peak demand periods in Cañuelas.
Cañuelas Airbnb Cancellation Policy Trends Analysis (2026)
Limited
2 listings
11.1% of total
Flexible
5 listings
27.8% of total
Moderate
7 listings
38.9% of total
Firm
2 listings
11.1% of total
Strict
2 listings
11.1% of total
Cancellation Policy Insights for Cañuelas
- The prevailing Airbnb cancellation policy trend in Cañuelas is Moderate, used by 38.9% of listings.
- There's a relatively balanced mix between guest-friendly (66.7%) and stricter (22.2%) policies, offering choices for different guest needs.
Recommendations for Hosts
- Consider adopting a Moderate policy to align with the 38.9% market standard in Cañuelas.
- Using a Strict policy might deter some guests, as only 11.1% of listings use it. Evaluate if potential revenue protection outweighs possible lower booking rates.
- Regularly review your cancellation policy against competitors and market demand shifts in Cañuelas.
Cañuelas STR Booking Lead Time Analysis (2026)
Average Booking Lead Time by Month
Booking Lead Time Insights for Cañuelas
- The overall average booking lead time for vacation rentals in Cañuelas is 18 days.
- Guests book furthest in advance for stays during December (average 37 days), likely coinciding with peak travel demand or local events.
- The shortest booking windows occur for stays in June (average 9 days), indicating more last-minute travel plans during this time.
- Seasonally, Winter (28 days avg.) sees the longest lead times, while Summer (17 days avg.) has the shortest, reflecting typical travel planning cycles.
Recommendations for Hosts
- Use the overall average lead time (18 days) as a baseline for your pricing and availability strategy in Cañuelas.
- For December stays, consider implementing length-of-stay discounts or slightly higher rates for bookings made less than 37 days out to capitalize on advance planning.
- During June, focus on last-minute booking availability and promotions, as guests book with very short notice (9 days avg.).
- Target marketing efforts for the Winter season well in advance (at least 28 days) to capture early planners.
- Monitor your own booking lead times against these Cañuelas averages to identify opportunities for dynamic pricing adjustments.
Popular & Essential Airbnb Amenities in Cañuelas (2026)
Amenity Prevalence
Amenity Insights for Cañuelas
- Essential amenities in Cañuelas that guests expect include: Kitchen, Refrigerator, Dishes and silverware. Lacking these (any) could significantly impact bookings.
- Popular amenities like Wifi, TV, Hot water are common but not universal. Offering these can provide a competitive edge.
- Warning: Wifi is not universally provided but is considered essential globally. Ensure reliable Wifi is offered.
Recommendations for Hosts
- Ensure your listing includes all essential amenities for Cañuelas: Kitchen, Refrigerator, Dishes and silverware.
- Consider adding popular differentiators like Wifi or TV to increase appeal.
- Highlight unique or less common amenities you offer (e.g., hot tub, dedicated workspace, EV charger) in your listing description and photos.
- Regularly check competitor amenities in Cañuelas to stay competitive.
Cañuelas Airbnb Guest Demographics & Profile Analysis (2026)
Guest Profile Summary for Cañuelas
- The typical guest profile for Airbnb in Cañuelas consists of primarily domestic travelers (79%), often arriving from nearby Buenos Aires, typically belonging to the Post-2000s (Gen Z/Alpha) group (50%), primarily speaking Spanish or English.
- Domestic travelers account for 79.2% of guests.
- Key international markets include Argentina (79.2%) and France (4.2%).
- Top languages spoken are Spanish (40.5%) followed by English (37.8%).
- A significant demographic segment is the Post-2000s (Gen Z/Alpha) group, representing 50% of guests.
Recommendations for Hosts
- Target domestic marketing efforts towards travelers from Buenos Aires and Berazategui.
- Tailor amenities and listing descriptions to appeal to the dominant Post-2000s (Gen Z/Alpha) demographic (e.g., highlight fast WiFi, smart home features, local guides).
- Highlight unique local experiences or amenities relevant to the primary guest profile.
- Consider seasonal promotions aligned with peak travel times for key origin markets.
Nearby Short-Term Rental Market Comparison
How does the Cañuelas Airbnb market stack up against its neighbors? Compare key performance metrics like average monthly revenue, ADR, and occupancy rates in surrounding areas to understand the broader regional STR landscape.
| Market | Active Properties | Monthly Revenue | Daily Rate | Avg. Occupancy |
|---|---|---|---|---|
| Open Door | 12 | $1,712 | $213.53 | 28% |
| Lobos | 49 | $1,531 | $254.26 | 32% |
| Don Torcuato | 13 | $1,362 | $208.01 | 33% |
| General Pacheco | 13 | $1,324 | $194.12 | 39% |
| El Cazador | 26 | $1,323 | $171.32 | 35% |
| Luján | 51 | $1,321 | $148.19 | 37% |
| Exaltación de la Cruz | 32 | $1,207 | $182.95 | 33% |
| Manzanares | 19 | $1,204 | $205.04 | 31% |
| Del Viso | 11 | $1,082 | $146.58 | 36% |
| Balneario Santa Ana | 10 | $1,075 | $147.08 | 39% |