Concordia Airbnb Market Analysis 2026: Short Term Rental Data & Vacation Rental Statistics in Entre Ríos Province, Argentina
Is Airbnb profitable in Concordia in 2026? Explore comprehensive Airbnb analytics for Concordia, Entre Ríos Province, Argentina to uncover income potential. This 2026 STR market report for Concordia, based on AirROI data from February 2025 to January 2026, reveals key trends in the niche market of 81 active listings.
Whether you're considering an Airbnb investment in Concordia, optimizing your existing vacation rental, or exploring rental arbitrage opportunities, understanding the Concordia Airbnb data is crucial. Leveraging the low regulation environment is key to maximizing your short term rental income potential. Let's dive into the specifics.
Key Concordia Airbnb Performance Metrics Overview
Monthly Airbnb Revenue Variations & Income Potential in Concordia (2026)
Understanding the monthly revenue variations for Airbnb listings in Concordia is key to maximizing your short term rental income potential. Seasonality significantly impacts earnings. Our analysis, based on data from the past 12 months, shows that the peak revenue month for STRs in Concordia is typically January, while June often presents the lowest earnings, highlighting opportunities for strategic pricing adjustments during shoulder and low seasons. Explore the typical Airbnb income in Concordia across different performance tiers:
- Best-in-class properties (Top 10%) achieve $953+ monthly, often utilizing dynamic pricing and superior guest experiences.
- Strong performing properties (Top 25%) earn $609 or more, indicating effective management and desirable locations/amenities.
- Typical properties (Median) generate around $330 per month, representing the average market performance.
- Entry-level properties (Bottom 25%) see earnings around $160, often with potential for optimization.
Average Monthly Airbnb Earnings Trend in Concordia
Concordia Airbnb Occupancy Rate Trends (2026)
Maximize your bookings by understanding the Concordia STR occupancy trends. Seasonal demand shifts significantly influence how often properties are booked. Typically, Februarysees the highest demand (peak season occupancy), while June experiences the lowest (low season). Effective strategies, like adjusting minimum stays or offering promotions, can boost occupancy during slower periods. Here's how different property tiers perform in Concordia:
- Best-in-class properties (Top 10%) achieve 58%+ occupancy, indicating high desirability and potentially optimized availability.
- Strong performing properties (Top 25%) maintain 40% or higher occupancy, suggesting good market fit and guest satisfaction.
- Typical properties (Median) have an occupancy rate around 20%.
- Entry-level properties (Bottom 25%) average 9% occupancy, potentially facing higher vacancy.
Average Monthly Occupancy Rate Trend in Concordia
Average Daily Rate (ADR) Airbnb Trends in Concordia (2026)
Effective short term rental pricing strategy in Concordia involves understanding monthly ADR fluctuations. The Average Daily Rate (ADR) for Airbnb in Concordia typically peaks in January and dips lowest during March. Leveraging Airbnb dynamic pricing tools or strategies based on this seasonality can significantly boost revenue. Here's a look at the typical nightly rates achieved:
- Best-in-class properties (Top 10%) command rates of $120+ per night, often due to premium features or locations.
- Strong performing properties (Top 25%) achieve nightly rates of $76 or more.
- Typical properties (Median) charge around $51 per night.
- Entry-level properties (Bottom 25%) earn around $40 per night.
Average Daily Rate (ADR) Trend by Month in Concordia
Get Live Concordia Market Intelligence 👇

Explore Real-time Analytics
Airbnb Seasonality Analysis & Trends in Concordia (2026)
Peak Season (January, December, February)
- Revenue averages $644 per month
- Occupancy rates average 31.5%
- Daily rates average $70
Shoulder Season
- Revenue averages $460 per month
- Occupancy maintains around 27.2%
- Daily rates hold near $65
Low Season (May, June, November)
- Revenue drops to average $335 per month
- Occupancy decreases to average 19.7%
- Daily rates adjust to average $67
Seasonality Insights for Concordia
- The Airbnb seasonality in Concordia shows highly seasonal trends requiring careful strategy. While the sections above show seasonal averages, it's also insightful to look at the extremes:
- During the high season, the absolute peak month showcases Concordia's highest earning potential, with monthly revenues capable of climbing to $689, occupancy reaching a high of 36.2%, and ADRs peaking at $74.
- Conversely, the slowest single month of the year, typically falling within the low season, marks the market's lowest point. In this month, revenue might dip to $297, occupancy could drop to 18.2%, and ADRs may adjust down to $62.
- Understanding both the seasonal averages and these monthly peaks and troughs in revenue, occupancy, and ADR is crucial for maximizing your Airbnb profit potential in Concordia.
Seasonal Strategies for Maximizing Profit
- Peak Season: Maximize revenue through premium pricing and potentially longer minimum stays. Ensure high availability.
- Low Season: Offer competitive pricing, special promotions (e.g., extended stay discounts), and flexible cancellation policies. Target off-season travelers like remote workers or budget-conscious guests.
- Shoulder Seasons: Implement dynamic pricing that balances peak and low rates. Target weekend travelers or specific events. Offer slightly more flexible terms than peak season.
- Regularly analyze your own performance against these Concordia seasonality benchmarks and adjust your pricing and availability strategy accordingly.
Best Areas for Airbnb Investment in Concordia (2026)
Exploring the top neighborhoods for short-term rentals in Concordia? This section highlights key areas, outlining why they are attractive for hosts and guests, along with notable local attractions. Consider these locations based on your target guest profile and investment strategy.
| Neighborhood / Area | Why Host Here? (Target Guests & Appeal) | Key Attractions & Landmarks |
|---|---|---|
| Centro | The heart of Concordia where history meets culture. This area attracts visitors with its local shops, restaurants, and quick access to attractions like the local cathedral and plazas. | Plaza 25 de Mayo, Concordia Cathedral, Museum of Digital Art, Concordia Casino, Local dining spots |
| Costanera | A beautiful waterfront area along the Uruguay River, perfect for both leisure and recreation. Ideal for those looking for waterfront views and outdoor activities. | Costanera de Concordia, Parque San Carlos, Uruguay River views, Fishing spots, Walking and biking trails |
| Ex Estación de Trenes | This area is rich in history and architecture, featuring the old train station and surrounding neighborhoods. It attracts tourists interested in historical sites. | Old Train Station, Local architectural sites, Cultural events, Photography spots |
| Termas de Concordia | Famous for its thermal baths, this area draws health and wellness tourists looking to relax and enjoy natural hot springs. | Thermal spa resorts, Health and wellness services, Outdoor swimming areas, Nature walks |
| Barrio La Bianca | A residential area that offers a mix of tranquility and local life, suitable for families and longer stays. | Shopping centers, Local parks, Family-friendly activities |
| San Carlos | A suburban area that offers a peaceful retreat with access to nature parks and riverside activities, great for families and nature lovers. | Parque San Carlos, Nature trails, Fishing spots, Family picnic areas |
| Villa Zorraquín | A neighborhood known for its green spaces and quiet atmosphere, ideal for those seeking tranquility away from the city center. | Green parks, Playgrounds, Riverside activities |
| 8 de Abril | A locally vibrant area known for its quick access to amenities and local culture, attracting a mix of locals and tourists. | Local markets, Cultural events, Nearby parks, Dining options |
Understanding Airbnb License Requirements & STR Laws in Concordia (2026)
While Concordia, Entre Ríos Province, Argentina currently shows low STR regulations, specific Airbnb license requirements might still exist or change. Always verify the latest short term rental regulations and Airbnb license requirements directly with local government authorities for Concordia to ensure full compliance before hosting.
(Source: AirROI data, 2026, finding no licensed listings among those analyzed)
Top Performing Airbnb Properties in Concordia (2026)
Benchmark your potential! Explore examples of top-performing Airbnb properties in Concordiabased on Trailing Twelve Month (TTM) revenue. Analyze their characteristics, revenue, occupancy rate, and ADR to understand what drives success in this market.

House on the Lake, Heaven on Earth
Entire Place • 3 bedrooms
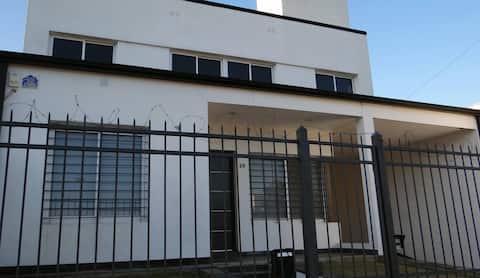
Rila Apart Concordia. A strategic location.
Entire Place • 3 bedrooms

Casa Norte
Entire Place • 3 bedrooms

Downtown Concordia •Pedestrian•Couples•Carnival
Entire Place • 1 bedroom
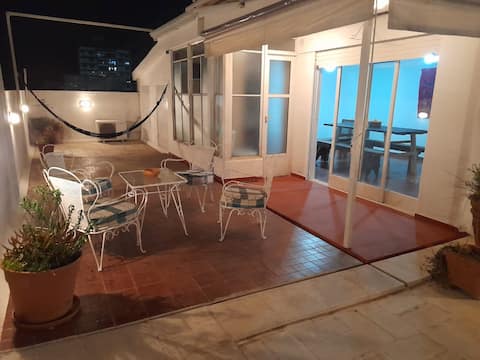
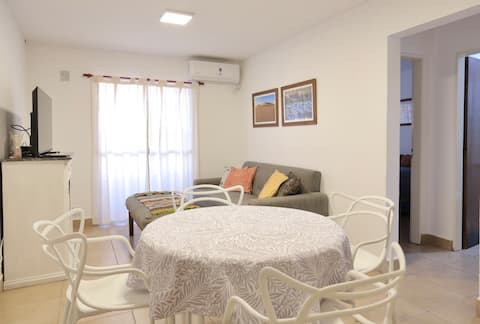
A bright, centrally located apartment with a terrace
Entire Place • 3 bedrooms
Bernard 52
Entire Place • 2 bedrooms
Note: Performance varies based on location, size, amenities, seasonality, and management quality. Data reflects the past 12 months.
Top Performing Airbnb Hosts in Concordia (2026)
Learn from the best! This table showcases top-performing Airbnb hosts in Concordia based on the number of properties managed and estimated total revenue over the past year. Analyze their scale and performance metrics.
| Host Name | Properties | Grossing Revenue | Stay Reviews | Avg Rating |
|---|---|---|---|---|
| Nicolas | 1 | $37,792 | 18 | 4.94/5.0 |
| Magali | 10 | $36,160 | 106 | 4.81/5.0 |
| Diego | 3 | $17,748 | 54 | 4.96/5.0 |
| Manuela | 2 | $17,697 | 141 | 4.88/5.0 |
| Dante | 1 | $12,602 | 163 | 4.94/5.0 |
| Florencia | 2 | $10,756 | 4 | 5.00/5.0 |
| Diana | 1 | $8,839 | 20 | 4.70/5.0 |
| Nahuel | 1 | $8,415 | 87 | 4.89/5.0 |
| Adrian | 1 | $6,908 | 32 | 4.69/5.0 |
| Delfina | 1 | $6,867 | 69 | 4.81/5.0 |
Analyzing the strategies of top hosts, such as their property selection, pricing, and guest communication, can offer valuable lessons for optimizing your own Airbnb operations in Concordia.
Dive Deeper: Advanced Concordia STR Market Data (2026)
Ready to unlock more insights? AirROI provides access to advanced metrics and comprehensive Airbnb data for Concordia. Explore detailed analytics beyond this report to refine your investment strategy, optimize pricing, and maximize your vacation rental profits.
Explore Advanced MetricsConcordia Short-Term Rental Market Composition (2026): Property & Room Types
Room Type Distribution
Property Type Distribution
Market Composition Insights for Concordia
- The Concordia Airbnb market composition is heavily skewed towards Entire Home/Apt listings, which make up 93.8% of the 81 active rentals. This indicates strong guest preference for privacy and space.
- Looking at the property type distribution in Concordia, Apartment/Condo properties are the most common (63%), reflecting the local real estate landscape.
- Houses represent a significant 27.2% portion, catering likely to families or larger groups.
- Smaller segments like others, hotel/boutique (combined 2.4%) offer potential for unique stay experiences.
Concordia Airbnb Room Capacity Analysis (2026): Bedroom Distribution
Distribution of Listings by Number of Bedrooms
Room Capacity Insights for Concordia
- The dominant room capacity in Concordia is 1 bedroom listings, making up 51.9% of the market. This suggests a strong demand for properties suitable for couples or solo travelers.
- Together, 1 bedroom and 2 bedrooms properties represent 81.5% of the active Airbnb listings in Concordia, indicating a high concentration in these sizes.
- With over half the market (51.9%) consisting of studios or 1-bedroom units, Concordia is particularly well-suited for individuals or couples.
Concordia Vacation Rental Guest Capacity Trends (2026)
Distribution of Listings by Guest Capacity
Guest Capacity Insights for Concordia
- The most common guest capacity trend in Concordia vacation rentals is listings accommodating 4 guests (38.3%). This suggests the primary traveler segment is likely small families or groups.
- Properties designed for 4 guests and 3 guests dominate the Concordia STR market, accounting for 53.1% of listings.
- 16.0% of properties accommodate 6+ guests, serving the market segment for larger families or group travel in Concordia.
- On average, properties in Concordia are equipped to host 4.0 guests.
Concordia Airbnb Booking Patterns (2026): Available vs. Booked Days
Available Days Distribution
Booked Days Distribution
Booking Pattern Insights for Concordia
- The most common availability pattern in Concordia falls within the 271-366 days range, representing 80.2% of listings. This suggests many properties have significant open periods on their calendars.
- Approximately 93.8% of listings show high availability (181+ days open annually), indicating potential for increased bookings or specific owner usage patterns.
- For booked days, the 1-30 days range is most frequent in Concordia (39.5%), reflecting common guest stay durations or potential owner blocking patterns.
- A notable 6.2% of properties secure long booking periods (181+ days booked per year), highlighting successful long-term rental strategies or significant owner usage.
Concordia Airbnb Minimum Stay Requirements Analysis
Distribution of Listings by Minimum Night Requirement
1 Night
34 listings
42% of total
2 Nights
32 listings
39.5% of total
3 Nights
2 listings
2.5% of total
30+ Nights
13 listings
16% of total
Key Insights
- The most prevalent minimum stay requirement in Concordia is 1 Night, adopted by 42% of listings. This highlights the market's preference for shorter, flexible bookings.
- A strong majority (81.5%) of the Concordia Airbnb data shows acceptance of very short stays (1-2 nights), indicating a dynamic, high-turnover market.
- A significant segment (16%) caters to monthly stays (30+ nights) in Concordia, pointing to opportunities in the extended-stay market.
Recommendations
- Align with the market by considering a 1 Night minimum stay, as 42% of Concordia hosts use this setting.
- Explore offering discounts for stays of 30+ nights to attract the 16% of the market seeking extended stays.
- Adjust minimum nights based on seasonality – potentially shorter during low season and longer during peak demand periods in Concordia.
Concordia Airbnb Cancellation Policy Trends Analysis (2026)
Limited
1 listings
1.3% of total
Flexible
39 listings
48.8% of total
Moderate
27 listings
33.8% of total
Firm
11 listings
13.8% of total
Strict
2 listings
2.5% of total
Cancellation Policy Insights for Concordia
- The prevailing Airbnb cancellation policy trend in Concordia is Flexible, used by 48.8% of listings.
- The market strongly favors guest-friendly terms, with 82.6% of listings offering Flexible or Moderate policies. This suggests guests in Concordia may expect booking flexibility.
- Strict cancellation policies are quite rare (2.5%), potentially making listings with this policy less competitive unless justified by high demand or property type.
Recommendations for Hosts
- Consider adopting a Flexible policy to align with the 48.8% market standard in Concordia.
- Using a Strict policy might deter some guests, as only 2.5% of listings use it. Evaluate if potential revenue protection outweighs possible lower booking rates.
- Regularly review your cancellation policy against competitors and market demand shifts in Concordia.
Concordia STR Booking Lead Time Analysis (2026)
Average Booking Lead Time by Month
Booking Lead Time Insights for Concordia
- The overall average booking lead time for vacation rentals in Concordia is 22 days.
- Guests book furthest in advance for stays during January (average 32 days), likely coinciding with peak travel demand or local events.
- The shortest booking windows occur for stays in May (average 11 days), indicating more last-minute travel plans during this time.
- Seasonally, Winter (26 days avg.) sees the longest lead times, while Spring (16 days avg.) has the shortest, reflecting typical travel planning cycles.
Recommendations for Hosts
- Use the overall average lead time (22 days) as a baseline for your pricing and availability strategy in Concordia.
- During May, focus on last-minute booking availability and promotions, as guests book with very short notice (11 days avg.).
- Target marketing efforts for the Winter season well in advance (at least 26 days) to capture early planners.
- Monitor your own booking lead times against these Concordia averages to identify opportunities for dynamic pricing adjustments.
Popular & Essential Airbnb Amenities in Concordia (2026)
Amenity Prevalence
Amenity Insights for Concordia
- Essential amenities in Concordia that guests expect include: Wifi, Kitchen, TV. Lacking these (any) could significantly impact bookings.
- Popular amenities like Air conditioning, Heating, Dishes and silverware are common but not universal. Offering these can provide a competitive edge.
Recommendations for Hosts
- Ensure your listing includes all essential amenities for Concordia: Wifi, Kitchen, TV.
- Prioritize adding missing essentials: Kitchen, TV.
- Consider adding popular differentiators like Air conditioning or Heating to increase appeal.
- Highlight unique or less common amenities you offer (e.g., hot tub, dedicated workspace, EV charger) in your listing description and photos.
- Regularly check competitor amenities in Concordia to stay competitive.
Concordia Airbnb Guest Demographics & Profile Analysis (2026)
Guest Profile Summary for Concordia
- The typical guest profile for Airbnb in Concordia consists of a mix of domestic (60%) and international guests, often arriving from nearby Buenos Aires, typically belonging to the Post-2000s (Gen Z/Alpha) group (50%), primarily speaking Spanish or English.
- Domestic travelers account for 60.2% of guests.
- Key international markets include Argentina (60.2%) and Uruguay (12.5%).
- Top languages spoken are Spanish (40.3%) followed by English (33.9%).
- A significant demographic segment is the Post-2000s (Gen Z/Alpha) group, representing 50% of guests.
Recommendations for Hosts
- Target domestic marketing efforts towards travelers from Buenos Aires and Montevideo.
- Tailor amenities and listing descriptions to appeal to the dominant Post-2000s (Gen Z/Alpha) demographic (e.g., highlight fast WiFi, smart home features, local guides).
- Highlight unique local experiences or amenities relevant to the primary guest profile.
- Consider seasonal promotions aligned with peak travel times for key origin markets.
Nearby Short-Term Rental Market Comparison
How does the Concordia Airbnb market stack up against its neighbors? Compare key performance metrics like average monthly revenue, ADR, and occupancy rates in surrounding areas to understand the broader regional STR landscape.
| Market | Active Properties | Monthly Revenue | Daily Rate | Avg. Occupancy |
|---|---|---|---|---|
| Salto | 51 | $529 | $86.97 | 30% |
| Ituzaingó | 12 | $503 | $102.92 | 30% |
| Paysandú | 52 | $464 | $61.61 | 33% |
| Termas del Daymán | 56 | $391 | $63.94 | 25% |
| Federación | 119 | $372 | $72.85 | 24% |
| Concepción del Uruguay | 70 | $318 | $67.21 | 24% |
| Chajarí | 16 | $288 | $63.72 | 21% |
| Colón | 90 | $271 | $67.79 | 24% |
| San José | 17 | $268 | $64.33 | 22% |