Villa Elisa Airbnb Market Analysis 2026: Short Term Rental Data & Vacation Rental Statistics in Entre Ríos Province, Argentina
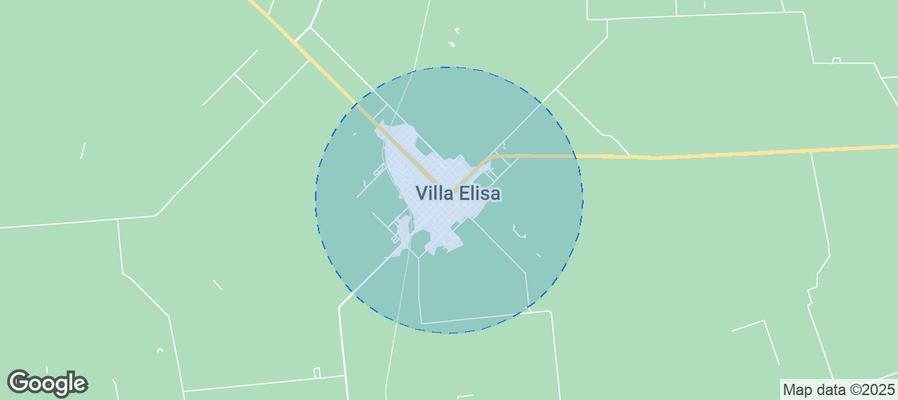
Is Airbnb profitable in Villa Elisa in 2026? Explore comprehensive Airbnb analytics for Villa Elisa, Entre Ríos Province, Argentina to uncover income potential. This 2026 STR market report for Villa Elisa, based on AirROI data from December 2024 to November 2025, reveals key trends in the niche market of 18 active listings.
Whether you're considering an Airbnb investment in Villa Elisa, optimizing your existing vacation rental, or exploring rental arbitrage opportunities, understanding the Villa Elisa Airbnb data is crucial. Leveraging the low regulation environment is key to maximizing your short term rental income potential. Let's dive into the specifics.
Key Villa Elisa Airbnb Performance Metrics Overview
Monthly Airbnb Revenue Variations & Income Potential in Villa Elisa (2026)
Understanding the monthly revenue variations for Airbnb listings in Villa Elisa is key to maximizing your short term rental income potential. Seasonality significantly impacts earnings. Our analysis, based on data from the past 12 months, shows that the peak revenue month for STRs in Villa Elisa is typically February, while May often presents the lowest earnings, highlighting opportunities for strategic pricing adjustments during shoulder and low seasons. Explore the typical Airbnb income in Villa Elisa across different performance tiers:
- Best-in-class properties (Top 10%) achieve $853+ monthly, often utilizing dynamic pricing and superior guest experiences.
- Strong performing properties (Top 25%) earn $561 or more, indicating effective management and desirable locations/amenities.
- Typical properties (Median) generate around $312 per month, representing the average market performance.
- Entry-level properties (Bottom 25%) see earnings around $192, often with potential for optimization.
Average Monthly Airbnb Earnings Trend in Villa Elisa
Villa Elisa Airbnb Occupancy Rate Trends (2026)
Maximize your bookings by understanding the Villa Elisa STR occupancy trends. Seasonal demand shifts significantly influence how often properties are booked. Typically, Februarysees the highest demand (peak season occupancy), while May experiences the lowest (low season). Effective strategies, like adjusting minimum stays or offering promotions, can boost occupancy during slower periods. Here's how different property tiers perform in Villa Elisa:
- Best-in-class properties (Top 10%) achieve 45%+ occupancy, indicating high desirability and potentially optimized availability.
- Strong performing properties (Top 25%) maintain 30% or higher occupancy, suggesting good market fit and guest satisfaction.
- Typical properties (Median) have an occupancy rate around 18%.
- Entry-level properties (Bottom 25%) average 10% occupancy, potentially facing higher vacancy.
Average Monthly Occupancy Rate Trend in Villa Elisa
Average Daily Rate (ADR) Airbnb Trends in Villa Elisa (2026)
Effective short term rental pricing strategy in Villa Elisa involves understanding monthly ADR fluctuations. The Average Daily Rate (ADR) for Airbnb in Villa Elisa typically peaks in June and dips lowest during September. Leveraging Airbnb dynamic pricing tools or strategies based on this seasonality can significantly boost revenue. Here's a look at the typical nightly rates achieved:
- Best-in-class properties (Top 10%) command rates of $134+ per night, often due to premium features or locations.
- Strong performing properties (Top 25%) achieve nightly rates of $86 or more.
- Typical properties (Median) charge around $54 per night.
- Entry-level properties (Bottom 25%) earn around $44 per night.
Average Daily Rate (ADR) Trend by Month in Villa Elisa
Get Live Villa Elisa Market Intelligence 👇
Explore Real-time Analytics
Airbnb Seasonality Analysis & Trends in Villa Elisa (2025)
Peak Season (February, January, December)
- Revenue averages $735 per month
- Occupancy rates average 33.5%
- Daily rates average $73
Shoulder Season
- Revenue averages $393 per month
- Occupancy maintains around 20.5%
- Daily rates hold near $70
Low Season (May, August, September)
- Revenue drops to average $267 per month
- Occupancy decreases to average 15.4%
- Daily rates adjust to average $69
Seasonality Insights for Villa Elisa
- The Airbnb seasonality in Villa Elisa shows highly seasonal trends requiring careful strategy. While the sections above show seasonal averages, it's also insightful to look at the extremes:
- During the high season, the absolute peak month showcases Villa Elisa's highest earning potential, with monthly revenues capable of climbing to $852, occupancy reaching a high of 38.9%, and ADRs peaking at $74.
- Conversely, the slowest single month of the year, typically falling within the low season, marks the market's lowest point. In this month, revenue might dip to $223, occupancy could drop to 12.0%, and ADRs may adjust down to $67.
- Understanding both the seasonal averages and these monthly peaks and troughs in revenue, occupancy, and ADR is crucial for maximizing your Airbnb profit potential in Villa Elisa.
Seasonal Strategies for Maximizing Profit
- Peak Season: Maximize revenue through premium pricing and potentially longer minimum stays. Ensure high availability.
- Low Season: Offer competitive pricing, special promotions (e.g., extended stay discounts), and flexible cancellation policies. Target off-season travelers like remote workers or budget-conscious guests.
- Shoulder Seasons: Implement dynamic pricing that balances peak and low rates. Target weekend travelers or specific events. Offer slightly more flexible terms than peak season.
- Regularly analyze your own performance against these Villa Elisa seasonality benchmarks and adjust your pricing and availability strategy accordingly.
Best Areas for Airbnb Investment in Villa Elisa (2026)
Exploring the top neighborhoods for short-term rentals in Villa Elisa? This section highlights key areas, outlining why they are attractive for hosts and guests, along with notable local attractions. Consider these locations based on your target guest profile and investment strategy.
| Neighborhood / Area | Why Host Here? (Target Guests & Appeal) | Key Attractions & Landmarks |
|---|---|---|
| Centro | The heart of Villa Elisa, known for its cultural activities and local amenities. It's a prime location for tourists wanting to experience the local lifestyle and attractions. | Parque Nacional Quebrada delCondorito, Termas de Villa Elisa, Plaza San Martín, Museo de la Historia de Villa Elisa, Iglesia San Martín |
| Termal Center | Famous for its thermal baths and wellness tourism. A great location for guests seeking relaxation and holistic experiences. | Termas del Arapey, Complejo Termal Villa Elisa, Spa de Termas, Olive oil museum, Natural parks nearby |
| Club de Golf | Surrounded by beautiful landscapes and golf courses. Ideal for guests who are golf enthusiasts or nature lovers. | Club de Golf Villa Elisa, Scenic walking trails, Lakes for fishing, Nearby vineyards |
| Residential Villas | A peaceful area with residential charm, perfect for families and longer stays. It offers a home-like feel near nature. | Local shops and cafes, Scenic parks, Family-friendly activities, Community events |
| Cultural District | Rich in history and culture, this area offers a glimpse into local traditions and events. Attracts cultural enthusiasts and those interested in Argentinian heritage. | Cultural festivals, Art and music events, Local cuisine experiences |
| Rural Retreats | Ideal for guests looking to escape the city. Provides a quintessential countryside experience with opportunities for outdoor activities. | Horseback riding, Country side hikes, Local farm visits |
| Eco Parks | Known for its ecological parks and nature reserves. Great for eco-tourism and nature lovers looking for exploration and adventure. | Wildlife watching, Nature trails, Educational eco-tours |
| Local Wineries | Famous for its regional wines and vineyard tours. Attracts wine enthusiasts and those looking to taste exquisite local flavors. | Wine tasting tours, Vineyard picnics, Wine festivals |
Understanding Airbnb License Requirements & STR Laws in Villa Elisa (2026)
While Villa Elisa, Entre Ríos Province, Argentina currently shows low STR regulations, specific Airbnb license requirements might still exist or change. Always verify the latest short term rental regulations and Airbnb license requirements directly with local government authorities for Villa Elisa to ensure full compliance before hosting.
(Source: AirROI data, 2026, finding no licensed listings among those analyzed)
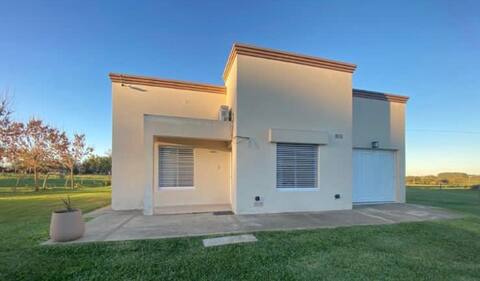
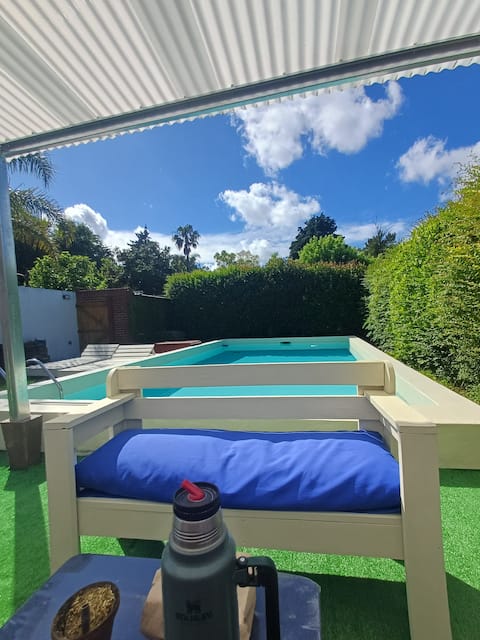
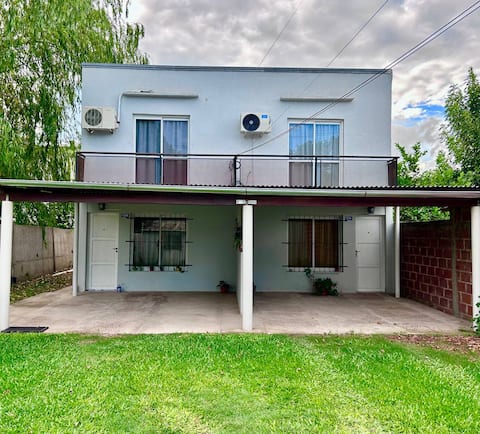
Top Performing Airbnb Properties in Villa Elisa (2026)
Benchmark your potential! Explore examples of top-performing Airbnb properties in Villa Elisabased on Trailing Twelve Month (TTM) revenue. Analyze their characteristics, revenue, occupancy rate, and ADR to understand what drives success in this market.
Los Alamos Country House
Entire Place • N/A
La quintita
Entire Place • 2 bedrooms
Spacious apartment 5 minutes from the hot springs.
Entire Place • 2 bedrooms
Natural setting, pool and Wi-Fi
Entire Place • N/A

Garden of the Center accommodation
Entire Place • 2 bedrooms
Accommodation in Villa Elisa
Entire Place • 1 bedroom
Note: Performance varies based on location, size, amenities, seasonality, and management quality. Data reflects the past 12 months.
Top Performing Airbnb Hosts in Villa Elisa (2026)
Learn from the best! This table showcases top-performing Airbnb hosts in Villa Elisa based on the number of properties managed and estimated total revenue over the past year. Analyze their scale and performance metrics.
| Host Name | Properties | Grossing Revenue | Stay Reviews | Avg Rating |
|---|---|---|---|---|
| Nicolás Alberto | 2 | $7,726 | 17 | 4.88/5.0 |
| Mariana | 1 | $7,331 | 19 | 4.74/5.0 |
| Zaca | 1 | $6,705 | 3 | 5.00/5.0 |
| Carlos | 2 | $5,755 | 11 | 5.00/5.0 |
| Inés | 1 | $5,006 | 22 | 4.77/5.0 |
| Carolina | 1 | $4,548 | 6 | 4.83/5.0 |
| Claudia | 2 | $4,048 | 48 | 4.95/5.0 |
| Jeremias | 1 | $3,998 | 9 | 4.33/5.0 |
| Rocio | 1 | $2,592 | 7 | 4.86/5.0 |
| Florentina | 1 | $2,069 | 20 | 4.90/5.0 |
Analyzing the strategies of top hosts, such as their property selection, pricing, and guest communication, can offer valuable lessons for optimizing your own Airbnb operations in Villa Elisa.
Dive Deeper: Advanced Villa Elisa STR Market Data (2026)
Ready to unlock more insights? AirROI provides access to advanced metrics and comprehensive Airbnb data for Villa Elisa. Explore detailed analytics beyond this report to refine your investment strategy, optimize pricing, and maximize your vacation rental profits.
Explore Advanced MetricsVilla Elisa Short-Term Rental Market Composition (2026): Property & Room Types
Room Type Distribution
Property Type Distribution
Market Composition Insights for Villa Elisa
- The Villa Elisa Airbnb market composition is heavily skewed towards Entire Home/Apt listings, which make up 88.9% of the 18 active rentals. This indicates strong guest preference for privacy and space.
- Looking at the property type distribution in Villa Elisa, House properties are the most common (55.6%), reflecting the local real estate landscape.
- Houses represent a significant 55.6% portion, catering likely to families or larger groups.
Villa Elisa Airbnb Room Capacity Analysis (2026): Bedroom Distribution
Distribution of Listings by Number of Bedrooms
Room Capacity Insights for Villa Elisa
- The dominant room capacity in Villa Elisa is 2 bedrooms listings, making up 38.9% of the market. This suggests a strong demand for properties suitable for couples or solo travelers.
- Together, 2 bedrooms and 1 bedroom properties represent 72.2% of the active Airbnb listings in Villa Elisa, indicating a high concentration in these sizes.
Villa Elisa Vacation Rental Guest Capacity Trends (2026)
Distribution of Listings by Guest Capacity
Guest Capacity Insights for Villa Elisa
- The most common guest capacity trend in Villa Elisa vacation rentals is listings accommodating 4 guests (22.2%). This suggests the primary traveler segment is likely small families or groups.
- Properties designed for 4 guests and 6 guests dominate the Villa Elisa STR market, accounting for 44.4% of listings.
- 22.2% of properties accommodate 6+ guests, serving the market segment for larger families or group travel in Villa Elisa.
- On average, properties in Villa Elisa are equipped to host 3.7 guests.
Villa Elisa Airbnb Booking Patterns (2026): Available vs. Booked Days
Available Days Distribution
Booked Days Distribution
Booking Pattern Insights for Villa Elisa
- The most common availability pattern in Villa Elisa falls within the 271-366 days range, representing 88.9% of listings. This suggests many properties have significant open periods on their calendars.
- Approximately 100.0% of listings show high availability (181+ days open annually), indicating potential for increased bookings or specific owner usage patterns.
- For booked days, the 31-90 days range is most frequent in Villa Elisa (55.6%), reflecting common guest stay durations or potential owner blocking patterns.
Villa Elisa Airbnb Minimum Stay Requirements Analysis
Distribution of Listings by Minimum Night Requirement
1 Night
7 listings
38.9% of total
2 Nights
9 listings
50% of total
7-29 Nights
1 listings
5.6% of total
30+ Nights
1 listings
5.6% of total
Key Insights
- The most prevalent minimum stay requirement in Villa Elisa is 2 Nights, adopted by 50% of listings. This highlights the market's preference for shorter, flexible bookings.
- A strong majority (88.9%) of the Villa Elisa Airbnb data shows acceptance of very short stays (1-2 nights), indicating a dynamic, high-turnover market.
Recommendations
- Align with the market by considering a 2 Nights minimum stay, as 50% of Villa Elisa hosts use this setting.
- Explore offering discounts for stays of 30+ nights to attract the 5.6% of the market seeking extended stays.
- Adjust minimum nights based on seasonality – potentially shorter during low season and longer during peak demand periods in Villa Elisa.
Villa Elisa Airbnb Cancellation Policy Trends Analysis (2026)
Flexible
9 listings
50% of total
Moderate
4 listings
22.2% of total
Firm
5 listings
27.8% of total
Cancellation Policy Insights for Villa Elisa
- The prevailing Airbnb cancellation policy trend in Villa Elisa is Flexible, used by 50% of listings.
- The market strongly favors guest-friendly terms, with 72.2% of listings offering Flexible or Moderate policies. This suggests guests in Villa Elisa may expect booking flexibility.
Recommendations for Hosts
- Consider adopting a Flexible policy to align with the 50% market standard in Villa Elisa.
- Regularly review your cancellation policy against competitors and market demand shifts in Villa Elisa.
Villa Elisa STR Booking Lead Time Analysis (2026)
Average Booking Lead Time by Month
Booking Lead Time Insights for Villa Elisa
- The overall average booking lead time for vacation rentals in Villa Elisa is 22 days.
- Guests book furthest in advance for stays during April (average 45 days), likely coinciding with peak travel demand or local events.
- The shortest booking windows occur for stays in February (average 16 days), indicating more last-minute travel plans during this time.
- Seasonally, Spring (33 days avg.) sees the longest lead times, while Winter (20 days avg.) has the shortest, reflecting typical travel planning cycles.
Recommendations for Hosts
- Use the overall average lead time (22 days) as a baseline for your pricing and availability strategy in Villa Elisa.
- For April stays, consider implementing length-of-stay discounts or slightly higher rates for bookings made less than 45 days out to capitalize on advance planning.
- Target marketing efforts for the Spring season well in advance (at least 33 days) to capture early planners.
- Monitor your own booking lead times against these Villa Elisa averages to identify opportunities for dynamic pricing adjustments.
Popular & Essential Airbnb Amenities in Villa Elisa (2026)
Amenity Prevalence
Amenity Insights for Villa Elisa
- Essential amenities in Villa Elisa that guests expect include: Kitchen, Wifi. Lacking these (any) could significantly impact bookings.
- Popular amenities like TV, Free parking on premises, Air conditioning are common but not universal. Offering these can provide a competitive edge.
Recommendations for Hosts
- Ensure your listing includes all essential amenities for Villa Elisa: Kitchen, Wifi.
- Consider adding popular differentiators like TV or Free parking on premises to increase appeal.
- Highlight unique or less common amenities you offer (e.g., hot tub, dedicated workspace, EV charger) in your listing description and photos.
- Regularly check competitor amenities in Villa Elisa to stay competitive.
Villa Elisa Airbnb Guest Demographics & Profile Analysis (2026)
Guest Profile Summary for Villa Elisa
- The typical guest profile for Airbnb in Villa Elisa consists of a mix of domestic (57%) and international guests, often arriving from nearby Buenos Aires, typically belonging to the Post-2000s (Gen Z/Alpha) group (50%), primarily speaking Spanish or English.
- Domestic travelers account for 57.1% of guests.
- Key international markets include Argentina (57.1%) and Uruguay (38.1%).
- Top languages spoken are Spanish (57.9%) followed by English (31.6%).
- A significant demographic segment is the Post-2000s (Gen Z/Alpha) group, representing 50% of guests.
Recommendations for Hosts
- Balance marketing efforts between domestic and international channels based on the guest mix.
- Tailor amenities and listing descriptions to appeal to the dominant Post-2000s (Gen Z/Alpha) demographic (e.g., highlight fast WiFi, smart home features, local guides).
- Highlight unique local experiences or amenities relevant to the primary guest profile.
- Consider seasonal promotions aligned with peak travel times for key origin markets.
Nearby Short-Term Rental Market Comparison
How does the Villa Elisa Airbnb market stack up against its neighbors? Compare key performance metrics like average monthly revenue, ADR, and occupancy rates in surrounding areas to understand the broader regional STR landscape.
| Market | Active Properties | Monthly Revenue | Daily Rate | Avg. Occupancy |
|---|---|---|---|---|
| Open Door | 12 | $1,716 | $216.34 | 28% |
| Colonia Esterella | 13 | $1,658 | $312.12 | 26% |
| General Pacheco | 11 | $1,532 | $192.43 | 39% |
| El Cazador | 24 | $1,509 | $180.19 | 38% |
| Don Torcuato | 14 | $1,373 | $232.38 | 37% |
| Exaltación de la Cruz | 30 | $1,371 | $185.96 | 35% |
| Luján | 51 | $1,328 | $152.27 | 37% |
| Carmelo | 41 | $1,296 | $174.61 | 28% |
| Zelaya | 24 | $1,292 | $165.17 | 33% |
| Manzanares | 20 | $1,255 | $196.83 | 32% |