Municipio de Maimará Airbnb Market Analysis 2026: Short Term Rental Data & Vacation Rental Statistics in Jujuy, Argentina
Is Airbnb profitable in Municipio de Maimará in 2026? Explore comprehensive Airbnb analytics for Municipio de Maimará, Jujuy, Argentina to uncover income potential. This 2026 STR market report for Municipio de Maimará, based on AirROI data from February 2025 to January 2026, reveals key trends in the niche market of 56 active listings.
Whether you're considering an Airbnb investment in Municipio de Maimará, optimizing your existing vacation rental, or exploring rental arbitrage opportunities, understanding the Municipio de Maimará Airbnb data is crucial. Leveraging the low regulation environment is key to maximizing your short term rental income potential. Let's dive into the specifics.
Key Municipio de Maimará Airbnb Performance Metrics Overview
Monthly Airbnb Revenue Variations & Income Potential in Municipio de Maimará (2026)
Understanding the monthly revenue variations for Airbnb listings in Municipio de Maimará is key to maximizing your short term rental income potential. Seasonality significantly impacts earnings. Our analysis, based on data from the past 12 months, shows that the peak revenue month for STRs in Municipio de Maimará is typically July, while December often presents the lowest earnings, highlighting opportunities for strategic pricing adjustments during shoulder and low seasons. Explore the typical Airbnb income in Municipio de Maimará across different performance tiers:
- Best-in-class properties (Top 10%) achieve $1,771+ monthly, often utilizing dynamic pricing and superior guest experiences.
- Strong performing properties (Top 25%) earn $955 or more, indicating effective management and desirable locations/amenities.
- Typical properties (Median) generate around $421 per month, representing the average market performance.
- Entry-level properties (Bottom 25%) see earnings around $184, often with potential for optimization.
Average Monthly Airbnb Earnings Trend in Municipio de Maimará
Municipio de Maimará Airbnb Occupancy Rate Trends (2026)
Maximize your bookings by understanding the Municipio de Maimará STR occupancy trends. Seasonal demand shifts significantly influence how often properties are booked. Typically, Julysees the highest demand (peak season occupancy), while December experiences the lowest (low season). Effective strategies, like adjusting minimum stays or offering promotions, can boost occupancy during slower periods. Here's how different property tiers perform in Municipio de Maimará:
- Best-in-class properties (Top 10%) achieve 67%+ occupancy, indicating high desirability and potentially optimized availability.
- Strong performing properties (Top 25%) maintain 47% or higher occupancy, suggesting good market fit and guest satisfaction.
- Typical properties (Median) have an occupancy rate around 25%.
- Entry-level properties (Bottom 25%) average 13% occupancy, potentially facing higher vacancy.
Average Monthly Occupancy Rate Trend in Municipio de Maimará
Average Daily Rate (ADR) Airbnb Trends in Municipio de Maimará (2026)
Effective short term rental pricing strategy in Municipio de Maimará involves understanding monthly ADR fluctuations. The Average Daily Rate (ADR) for Airbnb in Municipio de Maimará typically peaks in February and dips lowest during November. Leveraging Airbnb dynamic pricing tools or strategies based on this seasonality can significantly boost revenue. Here's a look at the typical nightly rates achieved:
- Best-in-class properties (Top 10%) command rates of $131+ per night, often due to premium features or locations.
- Strong performing properties (Top 25%) achieve nightly rates of $83 or more.
- Typical properties (Median) charge around $53 per night.
- Entry-level properties (Bottom 25%) earn around $36 per night.
Average Daily Rate (ADR) Trend by Month in Municipio de Maimará
Get Live Municipio de Maimará Market Intelligence 👇

Explore Real-time Analytics
Airbnb Seasonality Analysis & Trends in Municipio de Maimará (2026)
Peak Season (July, April, August)
- Revenue averages $944 per month
- Occupancy rates average 38.4%
- Daily rates average $72
Shoulder Season
- Revenue averages $678 per month
- Occupancy maintains around 30.3%
- Daily rates hold near $68
Low Season (September, November, December)
- Revenue drops to average $558 per month
- Occupancy decreases to average 29.0%
- Daily rates adjust to average $59
Seasonality Insights for Municipio de Maimará
- The Airbnb seasonality in Municipio de Maimará shows highly seasonal trends requiring careful strategy. While the sections above show seasonal averages, it's also insightful to look at the extremes:
- During the high season, the absolute peak month showcases Municipio de Maimará's highest earning potential, with monthly revenues capable of climbing to $1,176, occupancy reaching a high of 47.9%, and ADRs peaking at $77.
- Conversely, the slowest single month of the year, typically falling within the low season, marks the market's lowest point. In this month, revenue might dip to $513, occupancy could drop to 26.3%, and ADRs may adjust down to $58.
- Understanding both the seasonal averages and these monthly peaks and troughs in revenue, occupancy, and ADR is crucial for maximizing your Airbnb profit potential in Municipio de Maimará.
Seasonal Strategies for Maximizing Profit
- Peak Season: Maximize revenue through premium pricing and potentially longer minimum stays. Ensure high availability.
- Low Season: Offer competitive pricing, special promotions (e.g., extended stay discounts), and flexible cancellation policies. Target off-season travelers like remote workers or budget-conscious guests.
- Shoulder Seasons: Implement dynamic pricing that balances peak and low rates. Target weekend travelers or specific events. Offer slightly more flexible terms than peak season.
- Regularly analyze your own performance against these Municipio de Maimará seasonality benchmarks and adjust your pricing and availability strategy accordingly.
Best Areas for Airbnb Investment in Municipio de Maimará (2026)
Exploring the top neighborhoods for short-term rentals in Municipio de Maimará? This section highlights key areas, outlining why they are attractive for hosts and guests, along with notable local attractions. Consider these locations based on your target guest profile and investment strategy.
| Neighborhood / Area | Why Host Here? (Target Guests & Appeal) | Key Attractions & Landmarks |
|---|---|---|
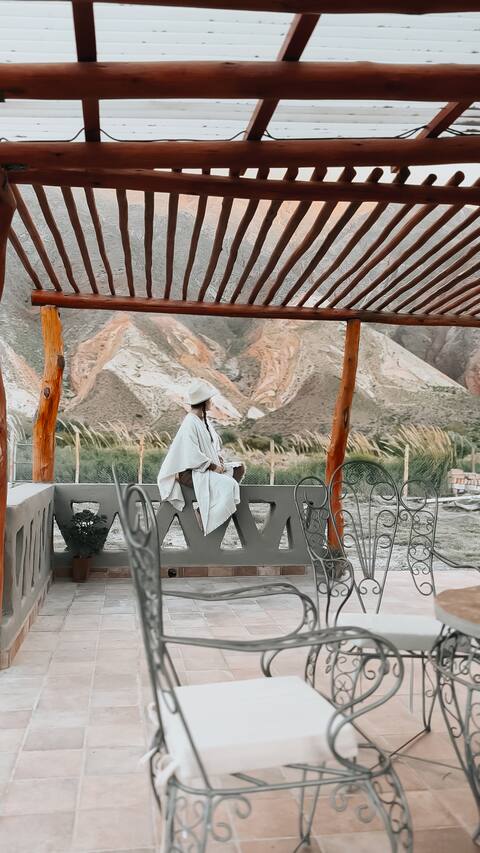
| Maimará Center | The heart of Maimará, offering easy access to local shops, restaurants, and the famous Serenata de la Puna festival. Perfect for tourists looking to immerse themselves in local culture. | Cerro de los Siete Colores, Cerro El Porito, Local Artisan Markets, Historic Train Station, Purmamarca |
| Quebrada de Humahuaca | A UNESCO World Heritage site, known for its stunning landscapes and traditional villages. This area attracts nature lovers and those seeking adventure sports like hiking and trekking. | Uquia Church, Sabana de Reyes, Humahuaca Village, Tilcara, Purmamarca |
| Potrero de los Funes | A beautiful village with scenic landscapes, popular for outdoor activities. It's a great area for families and tourists looking for relaxation and nature. | Lake Potrero de los Funes, Natural Parks, Scenic Trails |
| Purmamarca | Famous for the Hill of Seven Colors and a popular tourist destination. Offers a vibrant local craft market, making it attractive for Airbnb hosting. | Cerro de los Siete Colores, Traditional Market, Iglesia de Purmamarca, Caminos del Viento |
| Tilcara | Rich in cultural heritage and surrounded by beautiful landscapes. A great spot for tourists interested in history and the natural beauty of the Andes. | Pucará de Tilcara, Tilcara Archaeological Museum, Quebrada de Humahuaca, Cultural Events |
| Los colorados | Known for its unique rock formations and trekking opportunities. It's a hidden gem for tourists looking for adventure and photography. | Cerrillos, Hiking Trails, Breathtaking Views |
| The Humahuaca Puna | An area of stunning natural beauty and cultural richness, perfect for eco-tourism and cultural experiences with local communities. | Cultural Festivals, Traditional Indigenous Communities, Natural Reserves |
| Algarrobal | A quieter rural area with beautiful landscapes, ideal for those looking to escape the busier tourist spots. Offers a unique experience and tranquility. | Nature Reserves, Horseback Riding, Local Farms |
Understanding Airbnb License Requirements & STR Laws in Municipio de Maimará (2026)
While Municipio de Maimará, Jujuy, Argentina currently shows low STR regulations, specific Airbnb license requirements might still exist or change. Always verify the latest short term rental regulations and Airbnb license requirements directly with local government authorities for Municipio de Maimará to ensure full compliance before hosting.
(Source: AirROI data, 2026, finding no licensed listings among those analyzed)
Top Performing Airbnb Properties in Municipio de Maimará (2026)
Benchmark your potential! Explore examples of top-performing Airbnb properties in Municipio de Maimarábased on Trailing Twelve Month (TTM) revenue. Analyze their characteristics, revenue, occupancy rate, and ADR to understand what drives success in this market.

The House of Molle
Entire Place • 5 bedrooms

House in the mountains
Entire Place • 3 bedrooms

La Candelaria Farm
Entire Place • 3 bedrooms

Casa del Pintor
Entire Place • 3 bedrooms
La Bonita in Maimará
Entire Place • 2 bedrooms
Beautiful attached accommodation with a privileged view
Entire Place • 2 bedrooms
Note: Performance varies based on location, size, amenities, seasonality, and management quality. Data reflects the past 12 months.
Top Performing Airbnb Hosts in Municipio de Maimará (2026)
Learn from the best! This table showcases top-performing Airbnb hosts in Municipio de Maimará based on the number of properties managed and estimated total revenue over the past year. Analyze their scale and performance metrics.
| Host Name | Properties | Grossing Revenue | Stay Reviews | Avg Rating |
|---|---|---|---|---|
| Monserrat | 3 | $48,920 | 47 | 4.76/5.0 |
| La Paleta Del | 5 | $45,937 | 25 | 4.93/5.0 |
| Ignacio | 1 | $31,437 | 72 | 4.94/5.0 |
| Candelaria | 1 | $25,209 | 94 | 4.53/5.0 |
| Jimena | 1 | $22,600 | 3 | 5.00/5.0 |
| Laura Mariana | 1 | $18,354 | 133 | 4.94/5.0 |
| Paula Carolina | 3 | $15,980 | 148 | 4.82/5.0 |
| Marina | 1 | $11,565 | 39 | 5.00/5.0 |
| María Isolina | 1 | $11,091 | 2 | Not Rated |
| Carla | 1 | $9,598 | 14 | 4.93/5.0 |
Analyzing the strategies of top hosts, such as their property selection, pricing, and guest communication, can offer valuable lessons for optimizing your own Airbnb operations in Municipio de Maimará.
Dive Deeper: Advanced Municipio de Maimará STR Market Data (2026)
Ready to unlock more insights? AirROI provides access to advanced metrics and comprehensive Airbnb data for Municipio de Maimará. Explore detailed analytics beyond this report to refine your investment strategy, optimize pricing, and maximize your vacation rental profits.
Explore Advanced MetricsMunicipio de Maimará Short-Term Rental Market Composition (2026): Property & Room Types
Room Type Distribution
Property Type Distribution
Market Composition Insights for Municipio de Maimará
- The Municipio de Maimará Airbnb market composition is heavily skewed towards Entire Home/Apt listings, which make up 66.1% of the 56 active rentals. This indicates strong guest preference for privacy and space.
- However, a notable 33.9% share for Private Rooms suggests opportunities for budget-conscious travelers or hosts renting out spare rooms.
- Looking at the property type distribution in Municipio de Maimará, House properties are the most common (46.4%), reflecting the local real estate landscape.
- Houses represent a significant 46.4% portion, catering likely to families or larger groups.
- The presence of 19.6% Hotel/Boutique listings indicates integration with traditional hospitality.
- Smaller segments like others (combined 1.8%) offer potential for unique stay experiences.
Municipio de Maimará Airbnb Room Capacity Analysis (2026): Bedroom Distribution
Distribution of Listings by Number of Bedrooms
Room Capacity Insights for Municipio de Maimará
- The dominant room capacity in Municipio de Maimará is 1 bedroom listings, making up 46.4% of the market. This suggests a strong demand for properties suitable for couples or solo travelers.
- Together, 1 bedroom and 2 bedrooms properties represent 76.8% of the active Airbnb listings in Municipio de Maimará, indicating a high concentration in these sizes.
- Listings with 3+ bedrooms (7.2%) represent a smaller niche, potentially indicating an underserved market for larger group accommodations in Municipio de Maimará.
Municipio de Maimará Vacation Rental Guest Capacity Trends (2026)
Distribution of Listings by Guest Capacity
Guest Capacity Insights for Municipio de Maimará
- The most common guest capacity trend in Municipio de Maimará vacation rentals is listings accommodating 2 guests (21.4%). This suggests the primary traveler segment is likely couples or solo travelers.
- Properties designed for 2 guests and 5 guests dominate the Municipio de Maimará STR market, accounting for 37.5% of listings.
- 19.7% of properties accommodate 6+ guests, serving the market segment for larger families or group travel in Municipio de Maimará.
- On average, properties in Municipio de Maimará are equipped to host 3.4 guests.
Municipio de Maimará Airbnb Booking Patterns (2026): Available vs. Booked Days
Available Days Distribution
Booked Days Distribution
Booking Pattern Insights for Municipio de Maimará
- The most common availability pattern in Municipio de Maimará falls within the 271-366 days range, representing 64.3% of listings. This suggests many properties have significant open periods on their calendars.
- Approximately 85.7% of listings show high availability (181+ days open annually), indicating potential for increased bookings or specific owner usage patterns.
- For booked days, the 31-90 days range is most frequent in Municipio de Maimará (33.9%), reflecting common guest stay durations or potential owner blocking patterns.
- A notable 16.1% of properties secure long booking periods (181+ days booked per year), highlighting successful long-term rental strategies or significant owner usage.
Municipio de Maimará Airbnb Minimum Stay Requirements Analysis
Distribution of Listings by Minimum Night Requirement
1 Night
29 listings
51.8% of total
2 Nights
17 listings
30.4% of total
3 Nights
1 listings
1.8% of total
30+ Nights
9 listings
16.1% of total
Key Insights
- The most prevalent minimum stay requirement in Municipio de Maimará is 1 Night, adopted by 51.8% of listings. This highlights the market's preference for shorter, flexible bookings.
- A strong majority (82.2%) of the Municipio de Maimará Airbnb data shows acceptance of very short stays (1-2 nights), indicating a dynamic, high-turnover market.
- A significant segment (16.1%) caters to monthly stays (30+ nights) in Municipio de Maimará, pointing to opportunities in the extended-stay market.
Recommendations
- Align with the market by considering a 1 Night minimum stay, as 51.8% of Municipio de Maimará hosts use this setting.
- Explore offering discounts for stays of 30+ nights to attract the 16.1% of the market seeking extended stays.
- Adjust minimum nights based on seasonality – potentially shorter during low season and longer during peak demand periods in Municipio de Maimará.
Municipio de Maimará Airbnb Cancellation Policy Trends Analysis (2026)
Limited
3 listings
5.5% of total
Flexible
22 listings
40% of total
Moderate
20 listings
36.4% of total
Firm
9 listings
16.4% of total
Strict
1 listings
1.8% of total
Cancellation Policy Insights for Municipio de Maimará
- The prevailing Airbnb cancellation policy trend in Municipio de Maimará is Flexible, used by 40% of listings.
- The market strongly favors guest-friendly terms, with 76.4% of listings offering Flexible or Moderate policies. This suggests guests in Municipio de Maimará may expect booking flexibility.
- Strict cancellation policies are quite rare (1.8%), potentially making listings with this policy less competitive unless justified by high demand or property type.
Recommendations for Hosts
- Consider adopting a Flexible policy to align with the 40% market standard in Municipio de Maimará.
- Using a Strict policy might deter some guests, as only 1.8% of listings use it. Evaluate if potential revenue protection outweighs possible lower booking rates.
- Regularly review your cancellation policy against competitors and market demand shifts in Municipio de Maimará.
Municipio de Maimará STR Booking Lead Time Analysis (2026)
Average Booking Lead Time by Month
Booking Lead Time Insights for Municipio de Maimará
- The overall average booking lead time for vacation rentals in Municipio de Maimará is 43 days.
- Guests book furthest in advance for stays during December (average 74 days), likely coinciding with peak travel demand or local events.
- The shortest booking windows occur for stays in September (average 25 days), indicating more last-minute travel plans during this time.
- Seasonally, Winter (63 days avg.) sees the longest lead times, while Spring (37 days avg.) has the shortest, reflecting typical travel planning cycles.
Recommendations for Hosts
- Use the overall average lead time (43 days) as a baseline for your pricing and availability strategy in Municipio de Maimará.
- For December stays, consider implementing length-of-stay discounts or slightly higher rates for bookings made less than 74 days out to capitalize on advance planning.
- Target marketing efforts for the Winter season well in advance (at least 63 days) to capture early planners.
- Monitor your own booking lead times against these Municipio de Maimará averages to identify opportunities for dynamic pricing adjustments.
Popular & Essential Airbnb Amenities in Municipio de Maimará (2026)
Amenity Prevalence
Amenity Insights for Municipio de Maimará
- Popular amenities like Wifi, BBQ grill, Free parking on premises are common but not universal. Offering these can provide a competitive edge.
- Warning: Wifi is not universally provided but is considered essential globally. Ensure reliable Wifi is offered.
Recommendations for Hosts
- Consider adding popular differentiators like Wifi or BBQ grill to increase appeal.
- Highlight unique or less common amenities you offer (e.g., hot tub, dedicated workspace, EV charger) in your listing description and photos.
- Regularly check competitor amenities in Municipio de Maimará to stay competitive.
Municipio de Maimará Airbnb Guest Demographics & Profile Analysis (2026)
Guest Profile Summary for Municipio de Maimará
- The typical guest profile for Airbnb in Municipio de Maimará consists of predominantly international visitors (68%), with top international origins including France, typically belonging to the Post-2000s (Gen Z/Alpha) group (50%), primarily speaking English or Spanish.
- Domestic travelers account for 32.3% of guests.
- Key international markets include Argentina (32.3%) and France (15.3%).
- Top languages spoken are English (32.9%) followed by Spanish (30.7%).
- A significant demographic segment is the Post-2000s (Gen Z/Alpha) group, representing 50% of guests.
Recommendations for Hosts
- Focus marketing internationally, particularly towards travelers from France.
- Tailor amenities and listing descriptions to appeal to the dominant Post-2000s (Gen Z/Alpha) demographic (e.g., highlight fast WiFi, smart home features, local guides).
- Highlight unique local experiences or amenities relevant to the primary guest profile.
- Consider seasonal promotions aligned with peak travel times for key origin markets.
Nearby Short-Term Rental Market Comparison
How does the Municipio de Maimará Airbnb market stack up against its neighbors? Compare key performance metrics like average monthly revenue, ADR, and occupancy rates in surrounding areas to understand the broader regional STR landscape.
| Market | Active Properties | Monthly Revenue | Daily Rate | Avg. Occupancy |
|---|---|---|---|---|
| Municipio de Tilcara | 47 | $895 | $109.96 | 32% |
| Municipio de Purmamarca | 39 | $845 | $96.19 | 34% |
| San Lorenzo | 49 | $833 | $147.34 | 26% |
| Municipio de Salta | 12 | $642 | $179.08 | 32% |
| Tilcara | 131 | $565 | $87.80 | 29% |
| Purmamarca | 18 | $501 | $96.85 | 32% |
| Salta | 809 | $402 | $53.15 | 38% |
| Municipio de Campo Quijano | 27 | $380 | $92.25 | 25% |
| Municipio de Vaqueros | 11 | $300 | $88.53 | 23% |
| Municipio de Yala | 30 | $286 | $88.76 | 21% |