Distrito El Nihuil Airbnb Market Analysis 2026: Short Term Rental Data & Vacation Rental Statistics in Mendoza, Argentina
Is Airbnb profitable in Distrito El Nihuil in 2026? Explore comprehensive Airbnb analytics for Distrito El Nihuil, Mendoza, Argentina to uncover income potential. This 2026 STR market report for Distrito El Nihuil, based on AirROI data from June 2024 to May 2025, reveals key trends in the niche market of 18 active listings.
Whether you're considering an Airbnb investment in Distrito El Nihuil, optimizing your existing vacation rental, or exploring rental arbitrage opportunities, understanding the Distrito El Nihuil Airbnb data is crucial. Leveraging the low regulation environment is key to maximizing your short term rental income potential. Let's dive into the specifics.
Key Distrito El Nihuil Airbnb Performance Metrics Overview
Monthly Airbnb Revenue Variations & Income Potential in Distrito El Nihuil (2026)
Understanding the monthly revenue variations for Airbnb listings in Distrito El Nihuil is key to maximizing your short term rental income potential. Seasonality significantly impacts earnings. Our analysis, based on data from the past 12 months, shows that the peak revenue month for STRs in Distrito El Nihuil is typically January, while June often presents the lowest earnings, highlighting opportunities for strategic pricing adjustments during shoulder and low seasons. Explore the typical Airbnb income in Distrito El Nihuil across different performance tiers:
- Best-in-class properties (Top 10%) achieve $2,008+ monthly, often utilizing dynamic pricing and superior guest experiences.
- Strong performing properties (Top 25%) earn $1,533 or more, indicating effective management and desirable locations/amenities.
- Typical properties (Median) generate around $987 per month, representing the average market performance.
- Entry-level properties (Bottom 25%) see earnings around $507, often with potential for optimization.
Average Monthly Airbnb Earnings Trend in Distrito El Nihuil
Distrito El Nihuil Airbnb Occupancy Rate Trends (2026)
Maximize your bookings by understanding the Distrito El Nihuil STR occupancy trends. Seasonal demand shifts significantly influence how often properties are booked. Typically, Januarysees the highest demand (peak season occupancy), while May experiences the lowest (low season). Effective strategies, like adjusting minimum stays or offering promotions, can boost occupancy during slower periods. Here's how different property tiers perform in Distrito El Nihuil:
- Best-in-class properties (Top 10%) achieve 57%+ occupancy, indicating high desirability and potentially optimized availability.
- Strong performing properties (Top 25%) maintain 44% or higher occupancy, suggesting good market fit and guest satisfaction.
- Typical properties (Median) have an occupancy rate around 24%.
- Entry-level properties (Bottom 25%) average 14% occupancy, potentially facing higher vacancy.
Average Monthly Occupancy Rate Trend in Distrito El Nihuil
Average Daily Rate (ADR) Airbnb Trends in Distrito El Nihuil (2026)
Effective short term rental pricing strategy in Distrito El Nihuil involves understanding monthly ADR fluctuations. The Average Daily Rate (ADR) for Airbnb in Distrito El Nihuil typically peaks in February and dips lowest during September. Leveraging Airbnb dynamic pricing tools or strategies based on this seasonality can significantly boost revenue. Here's a look at the typical nightly rates achieved:
- Best-in-class properties (Top 10%) command rates of $162+ per night, often due to premium features or locations.
- Strong performing properties (Top 25%) achieve nightly rates of $130 or more.
- Typical properties (Median) charge around $97 per night.
- Entry-level properties (Bottom 25%) earn around $61 per night.
Average Daily Rate (ADR) Trend by Month in Distrito El Nihuil
Get Live Distrito El Nihuil Market Intelligence 👇

Explore Real-time Analytics
Airbnb Seasonality Analysis & Trends in Distrito El Nihuil (2025)
Peak Season (January, February, March)
- Revenue averages $2,150 per month
- Occupancy rates average 38.8%
- Daily rates average $138
Shoulder Season
- Revenue averages $939 per month
- Occupancy maintains around 32.0%
- Daily rates hold near $87
Low Season (May, June, September)
- Revenue drops to average $416 per month
- Occupancy decreases to average 17.6%
- Daily rates adjust to average $91
Seasonality Insights for Distrito El Nihuil
- The Airbnb seasonality in Distrito El Nihuil shows highly seasonal trends requiring careful strategy. While the sections above show seasonal averages, it's also insightful to look at the extremes:
- During the high season, the absolute peak month showcases Distrito El Nihuil's highest earning potential, with monthly revenues capable of climbing to $3,110, occupancy reaching a high of 43.5%, and ADRs peaking at $144.
- Conversely, the slowest single month of the year, typically falling within the low season, marks the market's lowest point. In this month, revenue might dip to $285, occupancy could drop to 14.0%, and ADRs may adjust down to $76.
- Understanding both the seasonal averages and these monthly peaks and troughs in revenue, occupancy, and ADR is crucial for maximizing your Airbnb profit potential in Distrito El Nihuil.
Seasonal Strategies for Maximizing Profit
- Peak Season: Maximize revenue through premium pricing and potentially longer minimum stays. Ensure high availability.
- Low Season: Offer competitive pricing, special promotions (e.g., extended stay discounts), and flexible cancellation policies. Target off-season travelers like remote workers or budget-conscious guests.
- Shoulder Seasons: Implement dynamic pricing that balances peak and low rates. Target weekend travelers or specific events. Offer slightly more flexible terms than peak season.
- Regularly analyze your own performance against these Distrito El Nihuil seasonality benchmarks and adjust your pricing and availability strategy accordingly.
Best Areas for Airbnb Investment in Distrito El Nihuil (2026)
Exploring the top neighborhoods for short-term rentals in Distrito El Nihuil? This section highlights key areas, outlining why they are attractive for hosts and guests, along with notable local attractions. Consider these locations based on your target guest profile and investment strategy.
| Neighborhood / Area | Why Host Here? (Target Guests & Appeal) | Key Attractions & Landmarks |
|---|---|---|
| El Nihuil Lake | A beautiful spot for water sports and relaxation, attracting visitors looking for adventure and tranquility. | El Nihuil Dam, Water sports activities, Fishing, Nature trails, Photography opportunities |
| Los Andes | A picturesque area ideal for outdoor enthusiasts and those seeking to explore the stunning Andes mountains. | Hiking trails, Stunning mountain views, Cultural experiences, Wildlife observation, Ski resorts nearby |
| Cerca Valle Grande | Known for its scenic beauty and outdoor activities, perfect for those who love nature and adventure. | Valle Grande Canyon, Rafting, Hiking, Outdoor adventure tours, Paragliding |
| Malargüe | A vibrant small town with rich culture and outdoor activities, appealing to tourists interested in local experiences. | Malargüe Museum, Nahuel Huapi National Park, Adventure sports, Local cuisine, Puma tracking tours |
| El Sosneado | A tranquil area for those who want to get away from the hustle and bustle, perfect for retreats and nature lovers. | Hot springs, Nature walks, Relaxing environment, Wildlife, Camping areas |
| Las Leñas | A renowned ski resort attracting winter sports enthusiasts and those seeking a luxurious mountain getaway. | Skiing, Snowboarding, Mountain lodges, Gourmet dining, Apres-ski activities |
| Villa 25 de Mayo | A charming village with local culture and beautiful landscapes, perfect for visitors looking to experience rural life in Mendoza. | Local artisanal markets, Vineyard tours, Scenic vistas, Traditional cuisine, Cultural festivals |
| San Rafael | A larger town nearby, offering urban amenities along with access to nature and adventure, appealing to a wide range of travelers. | San Rafael's wineries, Cerro Victoria, Museum of Natural Science, Adventure tourism, Cultural events |
Understanding Airbnb License Requirements & STR Laws in Distrito El Nihuil (2026)
While Distrito El Nihuil, Mendoza, Argentina currently shows low STR regulations, specific Airbnb license requirements might still exist or change. Always verify the latest short term rental regulations and Airbnb license requirements directly with local government authorities for Distrito El Nihuil to ensure full compliance before hosting.
(Source: AirROI data, 2026, finding no licensed listings among those analyzed)
Top Performing Airbnb Properties in Distrito El Nihuil (2026)
Benchmark your potential! Explore examples of top-performing Airbnb properties in Distrito El Nihuilbased on Trailing Twelve Month (TTM) revenue. Analyze their characteristics, revenue, occupancy rate, and ADR to understand what drives success in this market.

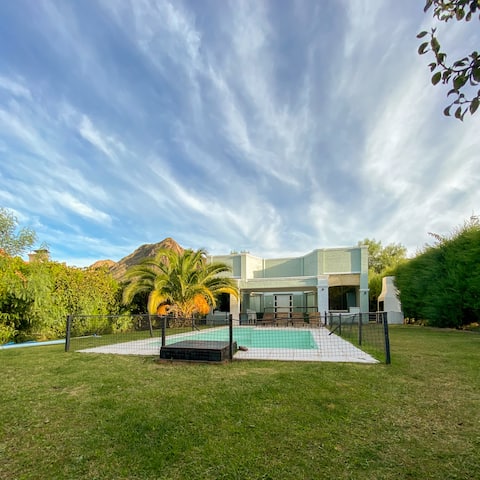
Exclusive Mountain Chalet with Pool and Waterfall
Entire Place • 2 bedrooms
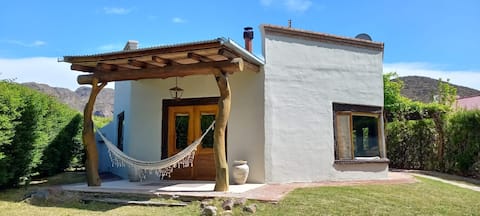
El Solar. Country Houses 1
Entire Place • 2 bedrooms

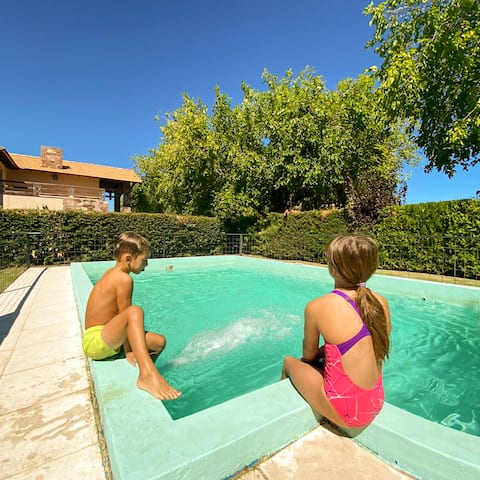
El Solar. Country Houses 2
Entire Place • 2 bedrooms
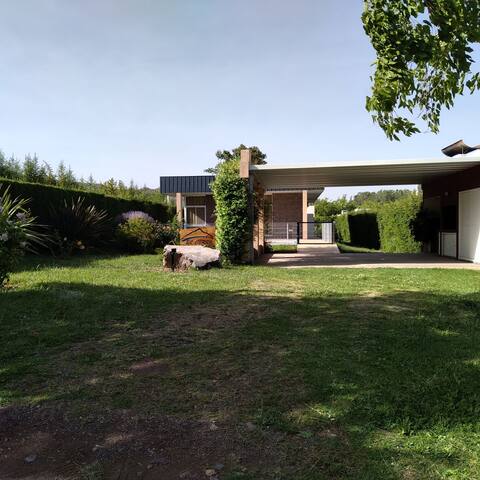
Casa María
Entire Place • 2 bedrooms
El Solar. Country houses 3
Entire Place • 2 bedrooms
El cerro
Entire Place • 3 bedrooms
Note: Performance varies based on location, size, amenities, seasonality, and management quality. Data reflects the past 12 months.
Top Performing Airbnb Hosts in Distrito El Nihuil (2026)
Learn from the best! This table showcases top-performing Airbnb hosts in Distrito El Nihuil based on the number of properties managed and estimated total revenue over the past year. Analyze their scale and performance metrics.
| Host Name | Properties | Grossing Revenue | Stay Reviews | Avg Rating |
|---|---|---|---|---|
| Florencia | 3 | $47,815 | 45 | 4.85/5.0 |
| Gabriela | 1 | $26,322 | 7 | 5.00/5.0 |
| Brunella | 1 | $15,852 | 7 | 4.57/5.0 |
| Host #488029999 | 1 | $11,230 | 1 | Not Rated |
| Sofia | 1 | $10,274 | 7 | 4.71/5.0 |
| Host #320673735 | 1 | $6,987 | 0 | Not Rated |
| Host #463938262 | 1 | $6,919 | 0 | Not Rated |
| Gustavo | 1 | $3,917 | 5 | 5.00/5.0 |
| Silvia | 1 | $3,615 | 41 | 4.90/5.0 |
| Host #497980815 | 1 | $2,941 | 1 | Not Rated |
Analyzing the strategies of top hosts, such as their property selection, pricing, and guest communication, can offer valuable lessons for optimizing your own Airbnb operations in Distrito El Nihuil.
Dive Deeper: Advanced Distrito El Nihuil STR Market Data (2026)
Ready to unlock more insights? AirROI provides access to advanced metrics and comprehensive Airbnb data for Distrito El Nihuil. Explore detailed analytics beyond this report to refine your investment strategy, optimize pricing, and maximize your vacation rental profits.
Explore Advanced MetricsDistrito El Nihuil Short-Term Rental Market Composition (2026): Property & Room Types
Room Type Distribution
Property Type Distribution
Market Composition Insights for Distrito El Nihuil
- The Distrito El Nihuil Airbnb market composition is heavily skewed towards Entire Home/Apt listings, which make up 100% of the 18 active rentals. This indicates strong guest preference for privacy and space.
- Looking at the property type distribution in Distrito El Nihuil, House properties are the most common (77.8%), reflecting the local real estate landscape.
- Houses represent a significant 77.8% portion, catering likely to families or larger groups.
Distrito El Nihuil Airbnb Room Capacity Analysis (2026): Bedroom Distribution
Distribution of Listings by Number of Bedrooms
Room Capacity Insights for Distrito El Nihuil
- The dominant room capacity in Distrito El Nihuil is 2 bedrooms listings, making up 55.6% of the market. This suggests a strong demand for properties suitable for couples or solo travelers.
- Together, 2 bedrooms and 1 bedroom properties represent 72.3% of the active Airbnb listings in Distrito El Nihuil, indicating a high concentration in these sizes.
- A significant 22.2% of listings offer 3+ bedrooms, catering to larger groups and families seeking more space in Distrito El Nihuil.
Distrito El Nihuil Vacation Rental Guest Capacity Trends (2026)
Distribution of Listings by Guest Capacity
Guest Capacity Insights for Distrito El Nihuil
- The most common guest capacity trend in Distrito El Nihuil vacation rentals is listings accommodating 6 guests (44.4%). This suggests the primary traveler segment is likely larger groups.
- Properties designed for 6 guests and 5 guests dominate the Distrito El Nihuil STR market, accounting for 66.6% of listings.
- 72.2% of properties accommodate 6+ guests, serving the market segment for larger families or group travel in Distrito El Nihuil.
- On average, properties in Distrito El Nihuil are equipped to host 6.1 guests.
Distrito El Nihuil Airbnb Booking Patterns (2026): Available vs. Booked Days
Available Days Distribution
Booked Days Distribution
Booking Pattern Insights for Distrito El Nihuil
- The most common availability pattern in Distrito El Nihuil falls within the 271-366 days range, representing 72.2% of listings. This suggests many properties have significant open periods on their calendars.
- Approximately 94.4% of listings show high availability (181+ days open annually), indicating potential for increased bookings or specific owner usage patterns.
- For booked days, the 31-90 days range is most frequent in Distrito El Nihuil (38.9%), reflecting common guest stay durations or potential owner blocking patterns.
- A notable 5.6% of properties secure long booking periods (181+ days booked per year), highlighting successful long-term rental strategies or significant owner usage.
Distrito El Nihuil Airbnb Minimum Stay Requirements Analysis
Distribution of Listings by Minimum Night Requirement
2 Nights
5 listings
27.8% of total
3 Nights
8 listings
44.4% of total
4-6 Nights
1 listings
5.6% of total
30+ Nights
4 listings
22.2% of total
Key Insights
- The most prevalent minimum stay requirement in Distrito El Nihuil is 3 Nights, adopted by 44.4% of listings. This highlights the market's preference for longer commitments.
- A significant segment (22.2%) caters to monthly stays (30+ nights) in Distrito El Nihuil, pointing to opportunities in the extended-stay market.
Recommendations
- Align with the market by considering a 3 Nights minimum stay, as 44.4% of Distrito El Nihuil hosts use this setting.
- Explore offering discounts for stays of 30+ nights to attract the 22.2% of the market seeking extended stays.
- Adjust minimum nights based on seasonality – potentially shorter during low season and longer during peak demand periods in Distrito El Nihuil.
Distrito El Nihuil Airbnb Cancellation Policy Trends Analysis (2026)
Flexible
4 listings
33.3% of total
Moderate
1 listings
8.3% of total
Firm
7 listings
58.3% of total
Cancellation Policy Insights for Distrito El Nihuil
- The prevailing Airbnb cancellation policy trend in Distrito El Nihuil is Firm, used by 58.3% of listings.
- A majority (58.3%) of hosts in Distrito El Nihuil utilize Firm or Strict policies, indicating a market where hosts prioritize booking security.
Recommendations for Hosts
- Consider adopting a Firm policy to align with the 58.3% market standard in Distrito El Nihuil.
- Regularly review your cancellation policy against competitors and market demand shifts in Distrito El Nihuil.
Distrito El Nihuil STR Booking Lead Time Analysis (2026)
Average Booking Lead Time by Month
Booking Lead Time Insights for Distrito El Nihuil
- The overall average booking lead time for vacation rentals in Distrito El Nihuil is 41 days.
- Guests book furthest in advance for stays during January (average 69 days), likely coinciding with peak travel demand or local events.
- The shortest booking windows occur for stays in July (average 15 days), indicating more last-minute travel plans during this time.
- Seasonally, Winter (51 days avg.) sees the longest lead times, while Summer (22 days avg.) has the shortest, reflecting typical travel planning cycles.
Recommendations for Hosts
- Use the overall average lead time (41 days) as a baseline for your pricing and availability strategy in Distrito El Nihuil.
- For January stays, consider implementing length-of-stay discounts or slightly higher rates for bookings made less than 69 days out to capitalize on advance planning.
- Target marketing efforts for the Winter season well in advance (at least 51 days) to capture early planners.
- Monitor your own booking lead times against these Distrito El Nihuil averages to identify opportunities for dynamic pricing adjustments.
Popular & Essential Airbnb Amenities in Distrito El Nihuil (2026)
Amenity Prevalence
Amenity Insights for Distrito El Nihuil
- Essential amenities in Distrito El Nihuil that guests expect include: TV, Free parking on premises, Kitchen. Lacking these (any) could significantly impact bookings.
- Popular amenities like Wifi, Heating, Air conditioning are common but not universal. Offering these can provide a competitive edge.
- A pool is a highly desired but not standard amenity, making it a key feature for attracting guests seeking leisure in Distrito El Nihuil.
- Warning: Wifi is not universally provided but is considered essential globally. Ensure reliable Wifi is offered.
Recommendations for Hosts
- Ensure your listing includes all essential amenities for Distrito El Nihuil: TV, Free parking on premises, Kitchen.
- Consider adding popular differentiators like Wifi or Heating to increase appeal.
- Highlight unique or less common amenities you offer (e.g., hot tub, dedicated workspace, EV charger) in your listing description and photos.
- Regularly check competitor amenities in Distrito El Nihuil to stay competitive.
Distrito El Nihuil Airbnb Guest Demographics & Profile Analysis (2026)
Guest Profile Summary for Distrito El Nihuil
- The typical guest profile for Airbnb in Distrito El Nihuil consists of primarily domestic travelers (70%), often arriving from nearby Buenos Aires, typically belonging to the Post-2000s (Gen Z/Alpha) group (50%), primarily speaking Spanish or English.
- Domestic travelers account for 70.0% of guests.
- Key international markets include Argentina (70%) and United States (10%).
- Top languages spoken are Spanish (45.3%) followed by English (30.2%).
- A significant demographic segment is the Post-2000s (Gen Z/Alpha) group, representing 50% of guests.
Recommendations for Hosts
- Target domestic marketing efforts towards travelers from Buenos Aires and Mendoza.
- Tailor amenities and listing descriptions to appeal to the dominant Post-2000s (Gen Z/Alpha) demographic (e.g., highlight fast WiFi, smart home features, local guides).
- Highlight unique local experiences or amenities relevant to the primary guest profile.
- Consider seasonal promotions aligned with peak travel times for key origin markets.
Nearby Short-Term Rental Market Comparison
How does the Distrito El Nihuil Airbnb market stack up against its neighbors? Compare key performance metrics like average monthly revenue, ADR, and occupancy rates in surrounding areas to understand the broader regional STR landscape.
| Market | Active Properties | Monthly Revenue | Daily Rate | Avg. Occupancy |
|---|---|---|---|---|
| Estancia Atamisque | 22 | $1,425 | $329.34 | 24% |
| Luján de Cuyo | 484 | $934 | $116.39 | 34% |
| Tupungato | 10 | $916 | $172.81 | 27% |
| Distrito Colonia Las Rosas | 10 | $906 | $141.78 | 29% |
| Tunuyán | 55 | $894 | $149.73 | 26% |
| Distrito Perdriel | 47 | $884 | $123.81 | 28% |
| Distrito Cacheuta | 24 | $868 | $90.68 | 39% |
| Los Molles | 18 | $828 | $181.11 | 29% |
| Distrito Villa Bastías | 11 | $811 | $132.46 | 23% |
| Distrito Industrial | 37 | $612 | $83.58 | 30% |