Maipú Airbnb Market Analysis 2026: Short Term Rental Data & Vacation Rental Statistics in Mendoza, Argentina
Is Airbnb profitable in Maipú in 2026? Explore comprehensive Airbnb analytics for Maipú, Mendoza, Argentina to uncover income potential. This 2026 STR market report for Maipú, based on AirROI data from February 2025 to January 2026, reveals key trends in the niche market of 37 active listings.
Whether you're considering an Airbnb investment in Maipú, optimizing your existing vacation rental, or exploring rental arbitrage opportunities, understanding the Maipú Airbnb data is crucial. Leveraging the low regulation environment is key to maximizing your short term rental income potential. Let's dive into the specifics.
Key Maipú Airbnb Performance Metrics Overview
Monthly Airbnb Revenue Variations & Income Potential in Maipú (2026)
Understanding the monthly revenue variations for Airbnb listings in Maipú is key to maximizing your short term rental income potential. Seasonality significantly impacts earnings. Our analysis, based on data from the past 12 months, shows that the peak revenue month for STRs in Maipú is typically November, while August often presents the lowest earnings, highlighting opportunities for strategic pricing adjustments during shoulder and low seasons. Explore the typical Airbnb income in Maipú across different performance tiers:
- Best-in-class properties (Top 10%) achieve $1,327+ monthly, often utilizing dynamic pricing and superior guest experiences.
- Strong performing properties (Top 25%) earn $892 or more, indicating effective management and desirable locations/amenities.
- Typical properties (Median) generate around $510 per month, representing the average market performance.
- Entry-level properties (Bottom 25%) see earnings around $253, often with potential for optimization.
Average Monthly Airbnb Earnings Trend in Maipú
Maipú Airbnb Occupancy Rate Trends (2026)
Maximize your bookings by understanding the Maipú STR occupancy trends. Seasonal demand shifts significantly influence how often properties are booked. Typically, Februarysees the highest demand (peak season occupancy), while August experiences the lowest (low season). Effective strategies, like adjusting minimum stays or offering promotions, can boost occupancy during slower periods. Here's how different property tiers perform in Maipú:
- Best-in-class properties (Top 10%) achieve 75%+ occupancy, indicating high desirability and potentially optimized availability.
- Strong performing properties (Top 25%) maintain 53% or higher occupancy, suggesting good market fit and guest satisfaction.
- Typical properties (Median) have an occupancy rate around 32%.
- Entry-level properties (Bottom 25%) average 17% occupancy, potentially facing higher vacancy.
Average Monthly Occupancy Rate Trend in Maipú
Average Daily Rate (ADR) Airbnb Trends in Maipú (2026)
Effective short term rental pricing strategy in Maipú involves understanding monthly ADR fluctuations. The Average Daily Rate (ADR) for Airbnb in Maipú typically peaks in December and dips lowest during August. Leveraging Airbnb dynamic pricing tools or strategies based on this seasonality can significantly boost revenue. Here's a look at the typical nightly rates achieved:
- Best-in-class properties (Top 10%) command rates of $102+ per night, often due to premium features or locations.
- Strong performing properties (Top 25%) achieve nightly rates of $69 or more.
- Typical properties (Median) charge around $49 per night.
- Entry-level properties (Bottom 25%) earn around $37 per night.
Average Daily Rate (ADR) Trend by Month in Maipú
Get Live Maipú Market Intelligence 👇

Explore Real-time Analytics
Airbnb Seasonality Analysis & Trends in Maipú (2026)
Peak Season (November, February, December)
- Revenue averages $1,180 per month
- Occupancy rates average 42.3%
- Daily rates average $70
Shoulder Season
- Revenue averages $684 per month
- Occupancy maintains around 36.9%
- Daily rates hold near $66
Low Season (June, August, September)
- Revenue drops to average $407 per month
- Occupancy decreases to average 29.7%
- Daily rates adjust to average $64
Seasonality Insights for Maipú
- The Airbnb seasonality in Maipú shows highly seasonal trends requiring careful strategy. While the sections above show seasonal averages, it's also insightful to look at the extremes:
- During the high season, the absolute peak month showcases Maipú's highest earning potential, with monthly revenues capable of climbing to $1,371, occupancy reaching a high of 52.8%, and ADRs peaking at $74.
- Conversely, the slowest single month of the year, typically falling within the low season, marks the market's lowest point. In this month, revenue might dip to $339, occupancy could drop to 25.5%, and ADRs may adjust down to $62.
- Understanding both the seasonal averages and these monthly peaks and troughs in revenue, occupancy, and ADR is crucial for maximizing your Airbnb profit potential in Maipú.
Seasonal Strategies for Maximizing Profit
- Peak Season: Maximize revenue through premium pricing and potentially longer minimum stays. Ensure high availability.
- Low Season: Offer competitive pricing, special promotions (e.g., extended stay discounts), and flexible cancellation policies. Target off-season travelers like remote workers or budget-conscious guests.
- Shoulder Seasons: Implement dynamic pricing that balances peak and low rates. Target weekend travelers or specific events. Offer slightly more flexible terms than peak season.
- Regularly analyze your own performance against these Maipú seasonality benchmarks and adjust your pricing and availability strategy accordingly.
Best Areas for Airbnb Investment in Maipú (2026)
Exploring the top neighborhoods for short-term rentals in Maipú? This section highlights key areas, outlining why they are attractive for hosts and guests, along with notable local attractions. Consider these locations based on your target guest profile and investment strategy.
| Neighborhood / Area | Why Host Here? (Target Guests & Appeal) | Key Attractions & Landmarks |
|---|---|---|
| Maipú Central | The heart of Maipú, known for its proximity to restaurants, vineyards, and local shops. Ideal for tourists wishing to explore the wine country in Mendoza. | Bodega La Rural, Bodega Trapiche, Museo del Vino, Parque General San Martín, Cicleando por Maipú |
| Luján de Cuyo | Neighboring region famous for its wine production and upscale wineries. Attracts visitors looking for luxury stays among scenic vineyards. | Bodega Norton, Bodega Luigi Bosca, Bodega Alamos, Los Chacayas Dam, Andeluna Cellars |
| El Patio de Rame | A charming area known for its local artisan markets and cultural experiences. Great for visitors wanting an authentic local experience. | Plaza de Maipú, Ferias y Mercados, Museo de Maipú, Paseo del Vino, Bodegas boutique |
| Chacra de la Cruz | A peaceful and rustic neighborhood that offers a serene retreat, close to nature and quieter vineyards, perfect for families and relaxation seekers. | Bodega La Maipú, Caminos del Vino, Finca La Anita, Nature trails, Local food circuits |
| Barrio Malbec | A vibrant district known for its Malbec vineyards and lively atmosphere. It's a popular spot for wine lovers and those wanting to experience the local nightlife. | Caminos del Vino, Bodega del Fin del Mundo, Local taverns, Malbec Wine Bar, Parque de la Confraternidad |
| Tupungato | A bit further from Maipú, this area offers stunning mountain views and beautiful landscapes, ideal for nature lovers and adventure seekers. | Cerro Arco, Finca El Lagar, Bodega Salentein, Aventura Tupungato, Parque Provincial Cordón del Plata |
| Bodega Los Toneles | A renowned vineyard area with beautiful winery properties. An excellent choice for wine tourists looking to immerse themselves in the wine culture. | Los Toneles Winery, Agrestis Winery, Wine tastings, Local cuisine, Scenic vineyard tours |
| Cañón del Atuel | A picturesque canyon that attracts nature enthusiasts and adventurous travelers looking for unique landscapes and outdoor activities. | Atuel Canyon, Rafting, Hiking trails, Breathtaking views, Outdoor camping spots |
Understanding Airbnb License Requirements & STR Laws in Maipú (2026)
While Maipú, Mendoza, Argentina currently shows low STR regulations, specific Airbnb license requirements might still exist or change. Always verify the latest short term rental regulations and Airbnb license requirements directly with local government authorities for Maipú to ensure full compliance before hosting.
(Source: AirROI data, 2026, finding no licensed listings among those analyzed)
Top Performing Airbnb Properties in Maipú (2026)
Benchmark your potential! Explore examples of top-performing Airbnb properties in Maipúbased on Trailing Twelve Month (TTM) revenue. Analyze their characteristics, revenue, occupancy rate, and ADR to understand what drives success in this market.
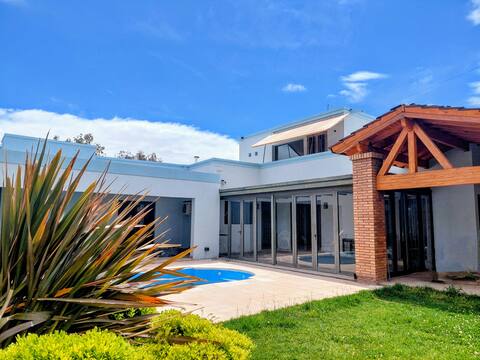
Beautiful house to fully enjoy Mendoza!
Entire Place • 3 bedrooms

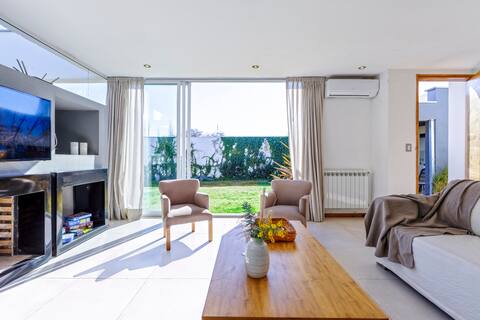
Luxurious and spacious house with a view of the Cordillera!
Entire Place • 5 bedrooms
House with pool and gazebo 5 minutes from Chacras!
Entire Place • 3 bedrooms

Lodge Baquero among Chardonnay vineyards
Entire Place • 1 bedroom

Ozamis Plaza
Entire Place • 1 bedroom

Wine routes: Pool, Bikes, Grill
Entire Place • 1 bedroom
Note: Performance varies based on location, size, amenities, seasonality, and management quality. Data reflects the past 12 months.
Top Performing Airbnb Hosts in Maipú (2026)
Learn from the best! This table showcases top-performing Airbnb hosts in Maipú based on the number of properties managed and estimated total revenue over the past year. Analyze their scale and performance metrics.
| Host Name | Properties | Grossing Revenue | Stay Reviews | Avg Rating |
|---|---|---|---|---|
| Susana | 1 | $29,225 | 20 | 4.90/5.0 |
| Maria Ester | 1 | $22,969 | 72 | 4.94/5.0 |
| Barbara | 2 | $18,819 | 94 | 4.59/5.0 |
| Mercedes | 1 | $15,813 | 118 | 4.73/5.0 |
| Jose Meliton | 1 | $12,530 | 40 | 4.98/5.0 |
| Matías | 2 | $12,468 | 137 | 4.97/5.0 |
| Ana Laura Y Esteban | 2 | $10,279 | 31 | 4.96/5.0 |
| Tomi | 1 | $10,200 | 13 | 4.92/5.0 |
| Ramiro | 1 | $9,231 | 12 | 4.58/5.0 |
| Elcira | 1 | $8,288 | 102 | 4.93/5.0 |
Analyzing the strategies of top hosts, such as their property selection, pricing, and guest communication, can offer valuable lessons for optimizing your own Airbnb operations in Maipú.
Dive Deeper: Advanced Maipú STR Market Data (2026)
Ready to unlock more insights? AirROI provides access to advanced metrics and comprehensive Airbnb data for Maipú. Explore detailed analytics beyond this report to refine your investment strategy, optimize pricing, and maximize your vacation rental profits.
Explore Advanced MetricsMaipú Short-Term Rental Market Composition (2026): Property & Room Types
Room Type Distribution
Property Type Distribution
Market Composition Insights for Maipú
- The Maipú Airbnb market composition is heavily skewed towards Entire Home/Apt listings, which make up 83.8% of the 37 active rentals. This indicates strong guest preference for privacy and space.
- Looking at the property type distribution in Maipú, House properties are the most common (51.4%), reflecting the local real estate landscape.
- Houses represent a significant 51.4% portion, catering likely to families or larger groups.
- The presence of 5.4% Hotel/Boutique listings indicates integration with traditional hospitality.
- Smaller segments like outdoor/unique, others (combined 5.4%) offer potential for unique stay experiences.
Maipú Airbnb Room Capacity Analysis (2026): Bedroom Distribution
Distribution of Listings by Number of Bedrooms
Room Capacity Insights for Maipú
- The dominant room capacity in Maipú is 1 bedroom listings, making up 35.1% of the market. This suggests a strong demand for properties suitable for couples or solo travelers.
- Together, 1 bedroom and 3 bedrooms properties represent 59.4% of the active Airbnb listings in Maipú, indicating a high concentration in these sizes.
- A significant 32.4% of listings offer 3+ bedrooms, catering to larger groups and families seeking more space in Maipú.
Maipú Vacation Rental Guest Capacity Trends (2026)
Distribution of Listings by Guest Capacity
Guest Capacity Insights for Maipú
- The most common guest capacity trend in Maipú vacation rentals is listings accommodating 4 guests (18.9%). This suggests the primary traveler segment is likely small families or groups.
- Properties designed for 4 guests and 8+ guests dominate the Maipú STR market, accounting for 35.1% of listings.
- 29.7% of properties accommodate 6+ guests, serving the market segment for larger families or group travel in Maipú.
- On average, properties in Maipú are equipped to host 4.2 guests.
Maipú Airbnb Booking Patterns (2026): Available vs. Booked Days
Available Days Distribution
Booked Days Distribution
Booking Pattern Insights for Maipú
- The most common availability pattern in Maipú falls within the 271-366 days range, representing 62.2% of listings. This suggests many properties have significant open periods on their calendars.
- Approximately 89.2% of listings show high availability (181+ days open annually), indicating potential for increased bookings or specific owner usage patterns.
- For booked days, the 1-30 days range is most frequent in Maipú (32.4%), reflecting common guest stay durations or potential owner blocking patterns.
- A notable 10.8% of properties secure long booking periods (181+ days booked per year), highlighting successful long-term rental strategies or significant owner usage.
Maipú Airbnb Minimum Stay Requirements Analysis
Distribution of Listings by Minimum Night Requirement
1 Night
16 listings
43.2% of total
2 Nights
11 listings
29.7% of total
3 Nights
2 listings
5.4% of total
30+ Nights
8 listings
21.6% of total
Key Insights
- The most prevalent minimum stay requirement in Maipú is 1 Night, adopted by 43.2% of listings. This highlights the market's preference for shorter, flexible bookings.
- A strong majority (72.9%) of the Maipú Airbnb data shows acceptance of very short stays (1-2 nights), indicating a dynamic, high-turnover market.
- A significant segment (21.6%) caters to monthly stays (30+ nights) in Maipú, pointing to opportunities in the extended-stay market.
Recommendations
- Align with the market by considering a 1 Night minimum stay, as 43.2% of Maipú hosts use this setting.
- Explore offering discounts for stays of 30+ nights to attract the 21.6% of the market seeking extended stays.
- Adjust minimum nights based on seasonality – potentially shorter during low season and longer during peak demand periods in Maipú.
Maipú Airbnb Cancellation Policy Trends Analysis (2026)
Flexible
18 listings
48.6% of total
Moderate
11 listings
29.7% of total
Firm
8 listings
21.6% of total
Cancellation Policy Insights for Maipú
- The prevailing Airbnb cancellation policy trend in Maipú is Flexible, used by 48.6% of listings.
- The market strongly favors guest-friendly terms, with 78.3% of listings offering Flexible or Moderate policies. This suggests guests in Maipú may expect booking flexibility.
Recommendations for Hosts
- Consider adopting a Flexible policy to align with the 48.6% market standard in Maipú.
- Regularly review your cancellation policy against competitors and market demand shifts in Maipú.
Maipú STR Booking Lead Time Analysis (2026)
Average Booking Lead Time by Month
Booking Lead Time Insights for Maipú
- The overall average booking lead time for vacation rentals in Maipú is 28 days.
- Guests book furthest in advance for stays during November (average 54 days), likely coinciding with peak travel demand or local events.
- The shortest booking windows occur for stays in June (average 13 days), indicating more last-minute travel plans during this time.
- Seasonally, Fall (40 days avg.) sees the longest lead times, while Spring (20 days avg.) has the shortest, reflecting typical travel planning cycles.
Recommendations for Hosts
- Use the overall average lead time (28 days) as a baseline for your pricing and availability strategy in Maipú.
- For November stays, consider implementing length-of-stay discounts or slightly higher rates for bookings made less than 54 days out to capitalize on advance planning.
- During June, focus on last-minute booking availability and promotions, as guests book with very short notice (13 days avg.).
- Target marketing efforts for the Fall season well in advance (at least 40 days) to capture early planners.
- Monitor your own booking lead times against these Maipú averages to identify opportunities for dynamic pricing adjustments.
Popular & Essential Airbnb Amenities in Maipú (2026)
Amenity Prevalence
Amenity Insights for Maipú
- Essential amenities in Maipú that guests expect include: Wifi. Lacking these (this) could significantly impact bookings.
- Popular amenities like Free parking on premises, TV, Kitchen are common but not universal. Offering these can provide a competitive edge.
Recommendations for Hosts
- Ensure your listing includes all essential amenities for Maipú: Wifi.
- Consider adding popular differentiators like Free parking on premises or TV to increase appeal.
- Highlight unique or less common amenities you offer (e.g., hot tub, dedicated workspace, EV charger) in your listing description and photos.
- Regularly check competitor amenities in Maipú to stay competitive.
Maipú Airbnb Guest Demographics & Profile Analysis (2026)
Guest Profile Summary for Maipú
- The typical guest profile for Airbnb in Maipú consists of a mix of domestic (53%) and international guests, often arriving from nearby Buenos Aires, typically belonging to the Post-2000s (Gen Z/Alpha) group (50%), primarily speaking English or Spanish.
- Domestic travelers account for 53.3% of guests.
- Key international markets include Argentina (53.3%) and United Kingdom (8.9%).
- Top languages spoken are English (35.6%) followed by Spanish (29.8%).
- A significant demographic segment is the Post-2000s (Gen Z/Alpha) group, representing 50% of guests.
Recommendations for Hosts
- Balance marketing efforts between domestic and international channels based on the guest mix.
- Tailor amenities and listing descriptions to appeal to the dominant Post-2000s (Gen Z/Alpha) demographic (e.g., highlight fast WiFi, smart home features, local guides).
- Highlight unique local experiences or amenities relevant to the primary guest profile.
- Consider seasonal promotions aligned with peak travel times for key origin markets.
Nearby Short-Term Rental Market Comparison
How does the Maipú Airbnb market stack up against its neighbors? Compare key performance metrics like average monthly revenue, ADR, and occupancy rates in surrounding areas to understand the broader regional STR landscape.
| Market | Active Properties | Monthly Revenue | Daily Rate | Avg. Occupancy |
|---|---|---|---|---|
| Distrito Perdriel | 28 | $1,640 | $161.69 | 35% |
| Estancia Atamisque | 11 | $1,496 | $433.35 | 19% |
| Potrerillos | 12 | $1,492 | $152.06 | 33% |
| Distrito Chacras de Coria | 322 | $1,333 | $143.04 | 37% |
| Luján de Cuyo | 399 | $986 | $132.90 | 33% |
| Tunuyán | 48 | $909 | $155.07 | 25% |
| Distrito Cacheuta | 26 | $903 | $92.67 | 33% |
| Distrito Colonia Las Rosas | 12 | $768 | $131.01 | 27% |
| Luján de Cuyo | 18 | $760 | $85.09 | 41% |
| Distrito Industrial | 29 | $740 | $98.54 | 28% |