La Lonja Airbnb Market Analysis 2026: Short Term Rental Data & Vacation Rental Statistics in Provincia de Buenos Aires, Argentina
Is Airbnb profitable in La Lonja in 2026? Explore comprehensive Airbnb analytics for La Lonja, Provincia de Buenos Aires, Argentina to uncover income potential. This 2026 STR market report for La Lonja, based on AirROI data from February 2025 to January 2026, reveals key trends in the niche market of 31 active listings.
Whether you're considering an Airbnb investment in La Lonja, optimizing your existing vacation rental, or exploring rental arbitrage opportunities, understanding the La Lonja Airbnb data is crucial. Leveraging the low regulation environment is key to maximizing your short term rental income potential. Let's dive into the specifics.
Key La Lonja Airbnb Performance Metrics Overview
Monthly Airbnb Revenue Variations & Income Potential in La Lonja (2026)
Understanding the monthly revenue variations for Airbnb listings in La Lonja is key to maximizing your short term rental income potential. Seasonality significantly impacts earnings. Our analysis, based on data from the past 12 months, shows that the peak revenue month for STRs in La Lonja is typically December, while May often presents the lowest earnings, highlighting opportunities for strategic pricing adjustments during shoulder and low seasons. Explore the typical Airbnb income in La Lonja across different performance tiers:
- Best-in-class properties (Top 10%) achieve $1,434+ monthly, often utilizing dynamic pricing and superior guest experiences.
- Strong performing properties (Top 25%) earn $1,024 or more, indicating effective management and desirable locations/amenities.
- Typical properties (Median) generate around $606 per month, representing the average market performance.
- Entry-level properties (Bottom 25%) see earnings around $322, often with potential for optimization.
Average Monthly Airbnb Earnings Trend in La Lonja
La Lonja Airbnb Occupancy Rate Trends (2026)
Maximize your bookings by understanding the La Lonja STR occupancy trends. Seasonal demand shifts significantly influence how often properties are booked. Typically, Decembersees the highest demand (peak season occupancy), while May experiences the lowest (low season). Effective strategies, like adjusting minimum stays or offering promotions, can boost occupancy during slower periods. Here's how different property tiers perform in La Lonja:
- Best-in-class properties (Top 10%) achieve 75%+ occupancy, indicating high desirability and potentially optimized availability.
- Strong performing properties (Top 25%) maintain 52% or higher occupancy, suggesting good market fit and guest satisfaction.
- Typical properties (Median) have an occupancy rate around 30%.
- Entry-level properties (Bottom 25%) average 15% occupancy, potentially facing higher vacancy.
Average Monthly Occupancy Rate Trend in La Lonja
Average Daily Rate (ADR) Airbnb Trends in La Lonja (2026)
Effective short term rental pricing strategy in La Lonja involves understanding monthly ADR fluctuations. The Average Daily Rate (ADR) for Airbnb in La Lonja typically peaks in December and dips lowest during April. Leveraging Airbnb dynamic pricing tools or strategies based on this seasonality can significantly boost revenue. Here's a look at the typical nightly rates achieved:
- Best-in-class properties (Top 10%) command rates of $164+ per night, often due to premium features or locations.
- Strong performing properties (Top 25%) achieve nightly rates of $85 or more.
- Typical properties (Median) charge around $57 per night.
- Entry-level properties (Bottom 25%) earn around $46 per night.
Average Daily Rate (ADR) Trend by Month in La Lonja
Get Live La Lonja Market Intelligence 👇

Explore Real-time Analytics
Airbnb Seasonality Analysis & Trends in La Lonja (2026)
Peak Season (December, November, April)
- Revenue averages $1,213 per month
- Occupancy rates average 42.7%
- Daily rates average $95
Shoulder Season
- Revenue averages $865 per month
- Occupancy maintains around 36.7%
- Daily rates hold near $99
Low Season (May, July, August)
- Revenue drops to average $504 per month
- Occupancy decreases to average 23.8%
- Daily rates adjust to average $87
Seasonality Insights for La Lonja
- The Airbnb seasonality in La Lonja shows highly seasonal trends requiring careful strategy. While the sections above show seasonal averages, it's also insightful to look at the extremes:
- During the high season, the absolute peak month showcases La Lonja's highest earning potential, with monthly revenues capable of climbing to $1,314, occupancy reaching a high of 48.8%, and ADRs peaking at $107.
- Conversely, the slowest single month of the year, typically falling within the low season, marks the market's lowest point. In this month, revenue might dip to $402, occupancy could drop to 18.6%, and ADRs may adjust down to $80.
- Understanding both the seasonal averages and these monthly peaks and troughs in revenue, occupancy, and ADR is crucial for maximizing your Airbnb profit potential in La Lonja.
Seasonal Strategies for Maximizing Profit
- Peak Season: Maximize revenue through premium pricing and potentially longer minimum stays. Ensure high availability.
- Low Season: Offer competitive pricing, special promotions (e.g., extended stay discounts), and flexible cancellation policies. Target off-season travelers like remote workers or budget-conscious guests.
- Shoulder Seasons: Implement dynamic pricing that balances peak and low rates. Target weekend travelers or specific events. Offer slightly more flexible terms than peak season.
- Regularly analyze your own performance against these La Lonja seasonality benchmarks and adjust your pricing and availability strategy accordingly.
Best Areas for Airbnb Investment in La Lonja (2026)
Exploring the top neighborhoods for short-term rentals in La Lonja? This section highlights key areas, outlining why they are attractive for hosts and guests, along with notable local attractions. Consider these locations based on your target guest profile and investment strategy.
| Neighborhood / Area | Why Host Here? (Target Guests & Appeal) | Key Attractions & Landmarks |
|---|---|---|
| San Isidro | Historical neighborhood known for its beautiful architecture and rich cultural heritage. Popular with families and tourists seeking a vibrant community feel with parks and river views. | San Isidro Cathedral, Plaza Mitre, Museo Pueyrredón, Bahía de Nordelta, Tres Picos Park |
| Luján | Known for the majestic Basilica of Luján, it attracts pilgrims and tourists alike. A serene location with rural charm, ideal for those looking to escape the city. | Basilica of Luján, Luján River, Parque San Martín, Museo de los Transportes, Rural festivals |
| Mar del Plata | A famous coastal city that draws beachgoers and holiday visitors year-round. Offers a mix of nightlife, beach activities, and cultural events making it a tourist hotspot. | Playa Varese, Torreón del Monje, Mar del Plata Aquarium, Casa sobre el Arroyo, Museo MAR |
| Tigre | A picturesque town located on the Paraná Delta, ideal for those looking for a water-based getaway with outdoor activities and scenic views. | Parque de la Costa, Tigre Delta, Museo de Arte Tigre, Puerto de Frutos, Isla Martín García |
| Buenos Aires City Centre | The bustling heart of the city filled with culture, dining, and nightlife. Attracts both tourists and business travelers looking for convenience. | Plaza de Mayo, Teatro Colón, Obelisco, Metropolitan Cathedral, Palermo |
| Colón | A charming town known for its thermal baths, making it a perfect retreat for relaxation and wellness tourism. | Termas de Colón, Parque Quiros, Museo Historico Regional, Plaza Washington |
| Pinamar | Sought after coastal destination known for its sandy beaches and upscale resorts. Ideal for summer rentals and family vacations. | Pinamar Beach, Avenida del Libertador, Biosfera de Pinamar, Centro Comercial |
| Escobar | A peaceful town with green areas and proximity to nature reserves, appealing for those wanting a quieter stay close to Buenos Aires. | Temaikén Biopark, Reserva Natural Otamendi, Parque de la Tercera Edad, Bioparque |
Understanding Airbnb License Requirements & STR Laws in La Lonja (2026)
While La Lonja, Provincia de Buenos Aires, Argentina currently shows low STR regulations, specific Airbnb license requirements might still exist or change. Always verify the latest short term rental regulations and Airbnb license requirements directly with local government authorities for La Lonja to ensure full compliance before hosting.
(Source: AirROI data, 2026, based on 3% licensed listings)
Top Performing Airbnb Properties in La Lonja (2026)
Benchmark your potential! Explore examples of top-performing Airbnb properties in La Lonjabased on Trailing Twelve Month (TTM) revenue. Analyze their characteristics, revenue, occupancy rate, and ADR to understand what drives success in this market.
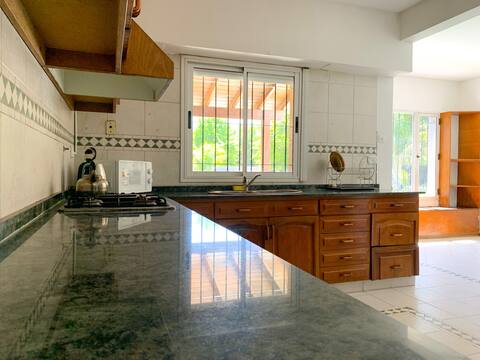
Quinta Mansión Azul in Pilar
Entire Place • 6 bedrooms
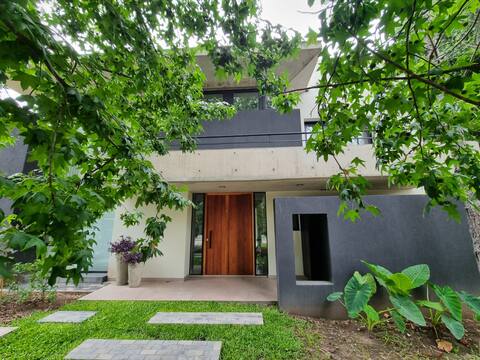
Casa Búho
Entire Place • 3 bedrooms
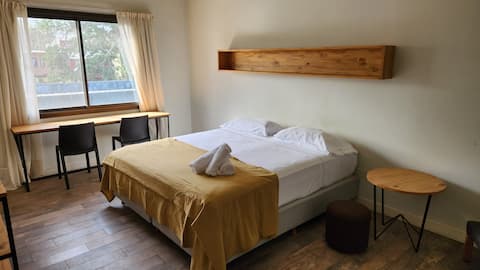
Araucarias 2 - IAE Hosp/Austral Univ
Entire Place • 1 bedroom
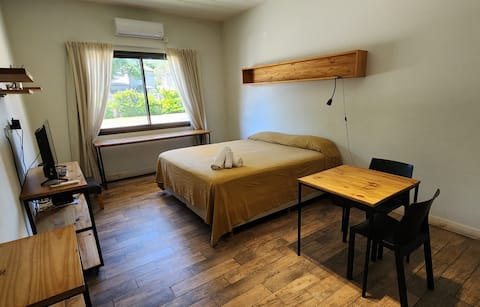
Araucarias 1- IAE, Hosp / Univ Austral
Entire Place • 1 bedroom

Araucarias 4 - IAE/Austral
Entire Place • 1 bedroom

Apartment @ Boulevard del Sol
Entire Place • 1 bedroom
Note: Performance varies based on location, size, amenities, seasonality, and management quality. Data reflects the past 12 months.
Top Performing Airbnb Hosts in La Lonja (2026)
Learn from the best! This table showcases top-performing Airbnb hosts in La Lonja based on the number of properties managed and estimated total revenue over the past year. Analyze their scale and performance metrics.
| Host Name | Properties | Grossing Revenue | Stay Reviews | Avg Rating |
|---|---|---|---|---|
| Andres | 8 | $57,942 | 152 | 4.82/5.0 |
| Laura | 1 | $35,900 | 1 | Not Rated |
| Maria Del Pilar | 1 | $23,121 | 2 | Not Rated |
| Belen | 5 | $19,885 | 145 | 4.82/5.0 |
| Tomas | 1 | $8,799 | 6 | 4.33/5.0 |
| Gabriela | 1 | $8,694 | 1 | Not Rated |
| Maria | 1 | $8,091 | 23 | 4.87/5.0 |
| Lautaro | 1 | $7,374 | 10 | 5.00/5.0 |
| Cynthia | 2 | $6,150 | 25 | 4.83/5.0 |
| Fernanda | 1 | $5,690 | 9 | 5.00/5.0 |
Analyzing the strategies of top hosts, such as their property selection, pricing, and guest communication, can offer valuable lessons for optimizing your own Airbnb operations in La Lonja.
Dive Deeper: Advanced La Lonja STR Market Data (2026)
Ready to unlock more insights? AirROI provides access to advanced metrics and comprehensive Airbnb data for La Lonja. Explore detailed analytics beyond this report to refine your investment strategy, optimize pricing, and maximize your vacation rental profits.
Explore Advanced MetricsLa Lonja Short-Term Rental Market Composition (2026): Property & Room Types
Room Type Distribution
Property Type Distribution
Market Composition Insights for La Lonja
- The La Lonja Airbnb market composition is heavily skewed towards Entire Home/Apt listings, which make up 100% of the 31 active rentals. This indicates strong guest preference for privacy and space.
- Looking at the property type distribution in La Lonja, Apartment/Condo properties are the most common (67.7%), reflecting the local real estate landscape.
- Houses represent a significant 25.8% portion, catering likely to families or larger groups.
- Smaller segments like others, hotel/boutique (combined 6.4%) offer potential for unique stay experiences.
La Lonja Airbnb Room Capacity Analysis (2026): Bedroom Distribution
Distribution of Listings by Number of Bedrooms
Room Capacity Insights for La Lonja
- The dominant room capacity in La Lonja is 1 bedroom listings, making up 61.3% of the market. This suggests a strong demand for properties suitable for couples or solo travelers.
- Together, 1 bedroom and 2 bedrooms properties represent 74.2% of the active Airbnb listings in La Lonja, indicating a high concentration in these sizes.
- With over half the market (61.3%) consisting of studios or 1-bedroom units, La Lonja is particularly well-suited for individuals or couples.
La Lonja Vacation Rental Guest Capacity Trends (2026)
Distribution of Listings by Guest Capacity
Guest Capacity Insights for La Lonja
- The most common guest capacity trend in La Lonja vacation rentals is listings accommodating 2 guests (32.3%). This suggests the primary traveler segment is likely couples or solo travelers.
- Properties designed for 2 guests and 3 guests dominate the La Lonja STR market, accounting for 51.7% of listings.
- 29.0% of properties accommodate 6+ guests, serving the market segment for larger families or group travel in La Lonja.
- On average, properties in La Lonja are equipped to host 3.9 guests.
La Lonja Airbnb Booking Patterns (2026): Available vs. Booked Days
Available Days Distribution
Booked Days Distribution
Booking Pattern Insights for La Lonja
- The most common availability pattern in La Lonja falls within the 271-366 days range, representing 58.1% of listings. This suggests many properties have significant open periods on their calendars.
- Approximately 87.1% of listings show high availability (181+ days open annually), indicating potential for increased bookings or specific owner usage patterns.
- For booked days, the 31-90 days range is most frequent in La Lonja (38.7%), reflecting common guest stay durations or potential owner blocking patterns.
- A notable 12.9% of properties secure long booking periods (181+ days booked per year), highlighting successful long-term rental strategies or significant owner usage.
La Lonja Airbnb Minimum Stay Requirements Analysis
Distribution of Listings by Minimum Night Requirement
1 Night
12 listings
38.7% of total
2 Nights
5 listings
16.1% of total
3 Nights
3 listings
9.7% of total
7-29 Nights
3 listings
9.7% of total
30+ Nights
8 listings
25.8% of total
Key Insights
- The most prevalent minimum stay requirement in La Lonja is 1 Night, adopted by 38.7% of listings. This highlights the market's preference for shorter, flexible bookings.
- A significant segment (25.8%) caters to monthly stays (30+ nights) in La Lonja, pointing to opportunities in the extended-stay market.
Recommendations
- Align with the market by considering a 1 Night minimum stay, as 38.7% of La Lonja hosts use this setting.
- Explore offering discounts for stays of 30+ nights to attract the 25.8% of the market seeking extended stays.
- Adjust minimum nights based on seasonality – potentially shorter during low season and longer during peak demand periods in La Lonja.
La Lonja Airbnb Cancellation Policy Trends Analysis (2026)
Limited
11 listings
35.5% of total
Flexible
9 listings
29% of total
Moderate
2 listings
6.5% of total
Firm
6 listings
19.4% of total
Strict
3 listings
9.7% of total
Cancellation Policy Insights for La Lonja
- The prevailing Airbnb cancellation policy trend in La Lonja is Limited, used by 35.5% of listings.
- There's a relatively balanced mix between guest-friendly (35.5%) and stricter (29.1%) policies, offering choices for different guest needs.
- Strict cancellation policies are quite rare (9.7%), potentially making listings with this policy less competitive unless justified by high demand or property type.
Recommendations for Hosts
- Consider adopting a Limited policy to align with the 35.5% market standard in La Lonja.
- Using a Strict policy might deter some guests, as only 9.7% of listings use it. Evaluate if potential revenue protection outweighs possible lower booking rates.
- Regularly review your cancellation policy against competitors and market demand shifts in La Lonja.
La Lonja STR Booking Lead Time Analysis (2026)
Average Booking Lead Time by Month
Booking Lead Time Insights for La Lonja
- The overall average booking lead time for vacation rentals in La Lonja is 20 days.
- Guests book furthest in advance for stays during April (average 42 days), likely coinciding with peak travel demand or local events.
- The shortest booking windows occur for stays in June (average 11 days), indicating more last-minute travel plans during this time.
- Seasonally, Spring (30 days avg.) sees the longest lead times, while Summer (12 days avg.) has the shortest, reflecting typical travel planning cycles.
Recommendations for Hosts
- Use the overall average lead time (20 days) as a baseline for your pricing and availability strategy in La Lonja.
- For April stays, consider implementing length-of-stay discounts or slightly higher rates for bookings made less than 42 days out to capitalize on advance planning.
- During June, focus on last-minute booking availability and promotions, as guests book with very short notice (11 days avg.).
- Target marketing efforts for the Spring season well in advance (at least 30 days) to capture early planners.
- Monitor your own booking lead times against these La Lonja averages to identify opportunities for dynamic pricing adjustments.
Popular & Essential Airbnb Amenities in La Lonja (2026)
Amenity Prevalence
Amenity Insights for La Lonja
- Essential amenities in La Lonja that guests expect include: Wifi, TV. Lacking these (any) could significantly impact bookings.
- Popular amenities like Air conditioning, Pool, Free parking on premises are common but not universal. Offering these can provide a competitive edge.
- A pool is a highly desired but not standard amenity, making it a key feature for attracting guests seeking leisure in La Lonja.
Recommendations for Hosts
- Ensure your listing includes all essential amenities for La Lonja: Wifi, TV.
- Consider adding popular differentiators like Air conditioning or Pool to increase appeal.
- Highlight unique or less common amenities you offer (e.g., hot tub, dedicated workspace, EV charger) in your listing description and photos.
- Regularly check competitor amenities in La Lonja to stay competitive.
La Lonja Airbnb Guest Demographics & Profile Analysis (2026)
Guest Profile Summary for La Lonja
- The typical guest profile for Airbnb in La Lonja consists of primarily domestic travelers (72%), often arriving from nearby Buenos Aires, typically belonging to the Post-2000s (Gen Z/Alpha) group (50%), primarily speaking Spanish or English.
- Domestic travelers account for 71.8% of guests.
- Key international markets include Argentina (71.8%) and Uruguay (8.2%).
- Top languages spoken are Spanish (50%) followed by English (36.4%).
- A significant demographic segment is the Post-2000s (Gen Z/Alpha) group, representing 50% of guests.
Recommendations for Hosts
- Target domestic marketing efforts towards travelers from Buenos Aires and Rosario.
- Tailor amenities and listing descriptions to appeal to the dominant Post-2000s (Gen Z/Alpha) demographic (e.g., highlight fast WiFi, smart home features, local guides).
- Highlight unique local experiences or amenities relevant to the primary guest profile.
- Consider seasonal promotions aligned with peak travel times for key origin markets.
Nearby Short-Term Rental Market Comparison
How does the La Lonja Airbnb market stack up against its neighbors? Compare key performance metrics like average monthly revenue, ADR, and occupancy rates in surrounding areas to understand the broader regional STR landscape.
| Market | Active Properties | Monthly Revenue | Daily Rate | Avg. Occupancy |
|---|---|---|---|---|
| Colonia Esterella | 13 | $1,620 | $328.28 | 23% |
| Open Door | 12 | $1,533 | $211.34 | 27% |
| El Cazador | 25 | $1,285 | $174.20 | 33% |
| Luján | 49 | $1,278 | $152.81 | 36% |
| Don Torcuato | 14 | $1,272 | $205.31 | 35% |
| Lobos | 49 | $1,268 | $253.18 | 28% |
| General Pacheco | 13 | $1,250 | $196.50 | 35% |
| Carmelo | 40 | $1,230 | $172.77 | 27% |
| Manzanares | 18 | $1,227 | $216.77 | 30% |
| Exaltación de la Cruz | 32 | $1,124 | $181.17 | 32% |