El Bolsón Airbnb Market Analysis 2026: Short Term Rental Data & Vacation Rental Statistics in Río Negro Province, Argentina
Is Airbnb profitable in El Bolsón in 2026? Explore comprehensive Airbnb analytics for El Bolsón, Río Negro Province, Argentina to uncover income potential. This 2026 STR market report for El Bolsón, based on AirROI data from February 2025 to January 2026, reveals key trends in the niche market of 171 active listings.
Whether you're considering an Airbnb investment in El Bolsón, optimizing your existing vacation rental, or exploring rental arbitrage opportunities, understanding the El Bolsón Airbnb data is crucial. Leveraging the low regulation environment is key to maximizing your short term rental income potential. Let's dive into the specifics.
Key El Bolsón Airbnb Performance Metrics Overview
Monthly Airbnb Revenue Variations & Income Potential in El Bolsón (2026)
Understanding the monthly revenue variations for Airbnb listings in El Bolsón is key to maximizing your short term rental income potential. Seasonality significantly impacts earnings. Our analysis, based on data from the past 12 months, shows that the peak revenue month for STRs in El Bolsón is typically February, while June often presents the lowest earnings, highlighting opportunities for strategic pricing adjustments during shoulder and low seasons. Explore the typical Airbnb income in El Bolsón across different performance tiers:
- Best-in-class properties (Top 10%) achieve $1,213+ monthly, often utilizing dynamic pricing and superior guest experiences.
- Strong performing properties (Top 25%) earn $794 or more, indicating effective management and desirable locations/amenities.
- Typical properties (Median) generate around $417 per month, representing the average market performance.
- Entry-level properties (Bottom 25%) see earnings around $180, often with potential for optimization.
Average Monthly Airbnb Earnings Trend in El Bolsón
El Bolsón Airbnb Occupancy Rate Trends (2026)
Maximize your bookings by understanding the El Bolsón STR occupancy trends. Seasonal demand shifts significantly influence how often properties are booked. Typically, Februarysees the highest demand (peak season occupancy), while June experiences the lowest (low season). Effective strategies, like adjusting minimum stays or offering promotions, can boost occupancy during slower periods. Here's how different property tiers perform in El Bolsón:
- Best-in-class properties (Top 10%) achieve 62%+ occupancy, indicating high desirability and potentially optimized availability.
- Strong performing properties (Top 25%) maintain 44% or higher occupancy, suggesting good market fit and guest satisfaction.
- Typical properties (Median) have an occupancy rate around 23%.
- Entry-level properties (Bottom 25%) average 11% occupancy, potentially facing higher vacancy.
Average Monthly Occupancy Rate Trend in El Bolsón
Average Daily Rate (ADR) Airbnb Trends in El Bolsón (2026)
Effective short term rental pricing strategy in El Bolsón involves understanding monthly ADR fluctuations. The Average Daily Rate (ADR) for Airbnb in El Bolsón typically peaks in February and dips lowest during November. Leveraging Airbnb dynamic pricing tools or strategies based on this seasonality can significantly boost revenue. Here's a look at the typical nightly rates achieved:
- Best-in-class properties (Top 10%) command rates of $98+ per night, often due to premium features or locations.
- Strong performing properties (Top 25%) achieve nightly rates of $75 or more.
- Typical properties (Median) charge around $57 per night.
- Entry-level properties (Bottom 25%) earn around $42 per night.
Average Daily Rate (ADR) Trend by Month in El Bolsón
Get Live El Bolsón Market Intelligence 👇

Explore Real-time Analytics
Airbnb Seasonality Analysis & Trends in El Bolsón (2026)
Peak Season (February, January, July)
- Revenue averages $776 per month
- Occupancy rates average 36.0%
- Daily rates average $69
Shoulder Season
- Revenue averages $534 per month
- Occupancy maintains around 29.0%
- Daily rates hold near $62
Low Season (April, May, June)
- Revenue drops to average $380 per month
- Occupancy decreases to average 21.7%
- Daily rates adjust to average $63
Seasonality Insights for El Bolsón
- The Airbnb seasonality in El Bolsón shows highly seasonal trends requiring careful strategy. While the sections above show seasonal averages, it's also insightful to look at the extremes:
- During the high season, the absolute peak month showcases El Bolsón's highest earning potential, with monthly revenues capable of climbing to $858, occupancy reaching a high of 41.5%, and ADRs peaking at $73.
- Conversely, the slowest single month of the year, typically falling within the low season, marks the market's lowest point. In this month, revenue might dip to $318, occupancy could drop to 17.4%, and ADRs may adjust down to $59.
- Understanding both the seasonal averages and these monthly peaks and troughs in revenue, occupancy, and ADR is crucial for maximizing your Airbnb profit potential in El Bolsón.
Seasonal Strategies for Maximizing Profit
- Peak Season: Maximize revenue through premium pricing and potentially longer minimum stays. Ensure high availability.
- Low Season: Offer competitive pricing, special promotions (e.g., extended stay discounts), and flexible cancellation policies. Target off-season travelers like remote workers or budget-conscious guests.
- Shoulder Seasons: Implement dynamic pricing that balances peak and low rates. Target weekend travelers or specific events. Offer slightly more flexible terms than peak season.
- Regularly analyze your own performance against these El Bolsón seasonality benchmarks and adjust your pricing and availability strategy accordingly.
Best Areas for Airbnb Investment in El Bolsón (2026)
Exploring the top neighborhoods for short-term rentals in El Bolsón? This section highlights key areas, outlining why they are attractive for hosts and guests, along with notable local attractions. Consider these locations based on your target guest profile and investment strategy.
| Neighborhood / Area | Why Host Here? (Target Guests & Appeal) | Key Attractions & Landmarks |
|---|---|---|
| Centro de El Bolsón | The bustling heart of El Bolsón with shops, cafes, and a vibrant local market. Ideal for guests wanting easy access to amenities and town life. | El Bolsón Artisan Market, Central Plaza, Local breweries, Cafes and restaurants, Art galleries |
| Cerro de Piltriquitrón | A popular location for hiking and nature lovers, known for stunning views and access to trails. Perfect for outdoor enthusiasts looking to explore the area. | Cerro Piltriquitrón, Hiking trails, Mirador del Cerro, Mountain climbing, Nature photography spots |
| Lago Puelo | A tranquil area with a beautiful lake surrounded by mountains, perfect for relaxation and water activities. Attracts visitors seeking peace and nature. | Lago Puelo National Park, Water sports, Beach area, Scenic views, Picnic spots |
| El Foyel | Located just outside of El Bolsón, this quaint village offers a serene environment and is ideal for those looking to escape the hustle and bustle. | Local farms, Natural landscapes, Hiking trails, Quiet retreats, Scenic views |
| Las Golondrinas | A picturesque valley known for its natural beauty and outdoor adventures, attracting nature lovers and sports enthusiasts. | Cascada Río Azul, Horseback riding, Biking routes, Scenic landscapes, Glamping opportunities |
| Chubut River | A scenic area along the Chubut River, popular for fishing and rafting, appealing to adventure seekers and nature lovers. | Fishing spots, Rafting experiences, Picnic areas, Nature trails, Wildlife viewing |
| Villa Los Coihues | A small village with a cozy atmosphere, great for families and travelers looking for a peaceful getaway amidst nature. | Nature trails, Family-friendly parks, Cafes, Local artisans, Quiet residential areas |
| Berger's House | This unique accommodation offers a blend of comfort and nature with its stunning views and proximity to El Bolsón’s attractions, ideal for both short and long stays. | Unique architecture, Panoramic views, Close to nature, Cultural experiences, Local cuisine |
Understanding Airbnb License Requirements & STR Laws in El Bolsón (2026)
While El Bolsón, Río Negro Province, Argentina currently shows low STR regulations, specific Airbnb license requirements might still exist or change. Always verify the latest short term rental regulations and Airbnb license requirements directly with local government authorities for El Bolsón to ensure full compliance before hosting.
(Source: AirROI data, 2026, finding no licensed listings among those analyzed)
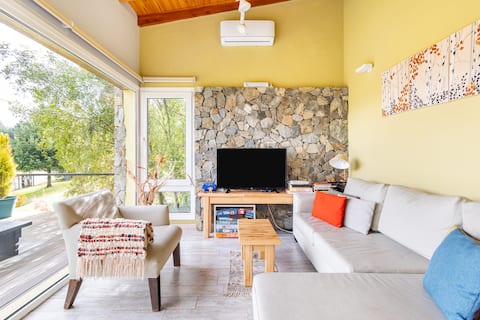
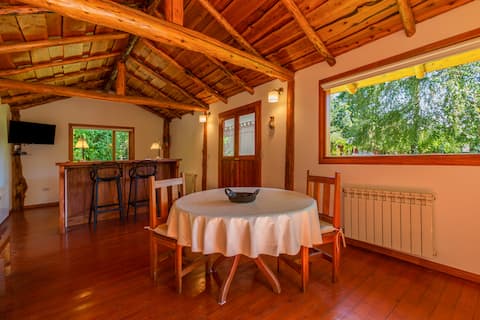
Top Performing Airbnb Properties in El Bolsón (2026)
Benchmark your potential! Explore examples of top-performing Airbnb properties in El Bolsónbased on Trailing Twelve Month (TTM) revenue. Analyze their characteristics, revenue, occupancy rate, and ADR to understand what drives success in this market.
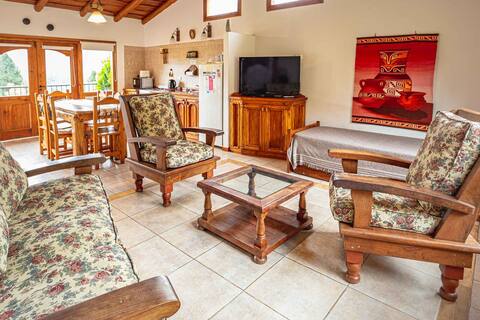
Meli cabin deck with a view of the Cordillera
Entire Place • 2 bedrooms

Los Retoños 1, centro com garagem
Entire Place • 2 bedrooms
"La Escondida" Mountain House
Entire Place • 2 bedrooms
Cabaña Pepa panoramic view
Entire Place • 1 bedroom

The Vineyards of Piltri
Entire Place • 1 bedroom

Container home in El Bolson - Cabin #2
Entire Place • 1 bedroom
Note: Performance varies based on location, size, amenities, seasonality, and management quality. Data reflects the past 12 months.
Top Performing Airbnb Hosts in El Bolsón (2026)
Learn from the best! This table showcases top-performing Airbnb hosts in El Bolsón based on the number of properties managed and estimated total revenue over the past year. Analyze their scale and performance metrics.
| Host Name | Properties | Grossing Revenue | Stay Reviews | Avg Rating |
|---|---|---|---|---|
| Sukal | 5 | $59,491 | 166 | 4.96/5.0 |
| Alejandro | 5 | $50,400 | 537 | 4.63/5.0 |
| Josefina Y Guillermo | 3 | $23,559 | 39 | 4.93/5.0 |
| Cabañas Sublime Bolson | 3 | $22,651 | 33 | 4.89/5.0 |
| Javier | 2 | $21,601 | 58 | 4.97/5.0 |
| Elo | 2 | $20,533 | 39 | 4.97/5.0 |
| Mariela | 2 | $14,929 | 11 | 4.93/5.0 |
| Alejandro | 1 | $14,325 | 72 | 5.00/5.0 |
| Benjamin | 1 | $14,247 | 105 | 4.97/5.0 |
| Mariela | 6 | $12,870 | 139 | 4.91/5.0 |
Analyzing the strategies of top hosts, such as their property selection, pricing, and guest communication, can offer valuable lessons for optimizing your own Airbnb operations in El Bolsón.
Dive Deeper: Advanced El Bolsón STR Market Data (2026)
Ready to unlock more insights? AirROI provides access to advanced metrics and comprehensive Airbnb data for El Bolsón. Explore detailed analytics beyond this report to refine your investment strategy, optimize pricing, and maximize your vacation rental profits.
Explore Advanced MetricsEl Bolsón Short-Term Rental Market Composition (2026): Property & Room Types
Room Type Distribution
Property Type Distribution
Market Composition Insights for El Bolsón
- The El Bolsón Airbnb market composition is heavily skewed towards Entire Home/Apt listings, which make up 84.2% of the 171 active rentals. This indicates strong guest preference for privacy and space.
- Looking at the property type distribution in El Bolsón, Apartment/Condo properties are the most common (31.6%), reflecting the local real estate landscape.
- Houses represent a significant 28.7% portion, catering likely to families or larger groups.
- The presence of 10.5% Hotel/Boutique listings indicates integration with traditional hospitality.
- Smaller segments like unique stays, others (combined 4.1%) offer potential for unique stay experiences.
El Bolsón Airbnb Room Capacity Analysis (2026): Bedroom Distribution
Distribution of Listings by Number of Bedrooms
Room Capacity Insights for El Bolsón
- The dominant room capacity in El Bolsón is 1 bedroom listings, making up 52% of the market. This suggests a strong demand for properties suitable for couples or solo travelers.
- Together, 1 bedroom and 2 bedrooms properties represent 80.1% of the active Airbnb listings in El Bolsón, indicating a high concentration in these sizes.
- With over half the market (52%) consisting of studios or 1-bedroom units, El Bolsón is particularly well-suited for individuals or couples.
- Listings with 3+ bedrooms (3.6%) represent a smaller niche, potentially indicating an underserved market for larger group accommodations in El Bolsón.
El Bolsón Vacation Rental Guest Capacity Trends (2026)
Distribution of Listings by Guest Capacity
Guest Capacity Insights for El Bolsón
- The most common guest capacity trend in El Bolsón vacation rentals is listings accommodating 4 guests (31%). This suggests the primary traveler segment is likely small families or groups.
- Properties designed for 4 guests and 2 guests dominate the El Bolsón STR market, accounting for 54.4% of listings.
- 11.1% of properties accommodate 6+ guests, serving the market segment for larger families or group travel in El Bolsón.
- On average, properties in El Bolsón are equipped to host 3.4 guests.
El Bolsón Airbnb Booking Patterns (2026): Available vs. Booked Days
Available Days Distribution
Booked Days Distribution
Booking Pattern Insights for El Bolsón
- The most common availability pattern in El Bolsón falls within the 271-366 days range, representing 82.5% of listings. This suggests many properties have significant open periods on their calendars.
- Approximately 94.2% of listings show high availability (181+ days open annually), indicating potential for increased bookings or specific owner usage patterns.
- For booked days, the 1-30 days range is most frequent in El Bolsón (42.1%), reflecting common guest stay durations or potential owner blocking patterns.
- A notable 5.9% of properties secure long booking periods (181+ days booked per year), highlighting successful long-term rental strategies or significant owner usage.
El Bolsón Airbnb Minimum Stay Requirements Analysis
Distribution of Listings by Minimum Night Requirement
1 Night
64 listings
37.4% of total
2 Nights
43 listings
25.1% of total
3 Nights
14 listings
8.2% of total
4-6 Nights
4 listings
2.3% of total
7-29 Nights
2 listings
1.2% of total
30+ Nights
44 listings
25.7% of total
Key Insights
- The most prevalent minimum stay requirement in El Bolsón is 1 Night, adopted by 37.4% of listings. This highlights the market's preference for shorter, flexible bookings.
- A strong majority (62.5%) of the El Bolsón Airbnb data shows acceptance of very short stays (1-2 nights), indicating a dynamic, high-turnover market.
- A significant segment (25.7%) caters to monthly stays (30+ nights) in El Bolsón, pointing to opportunities in the extended-stay market.
Recommendations
- Align with the market by considering a 1 Night minimum stay, as 37.4% of El Bolsón hosts use this setting.
- Explore offering discounts for stays of 30+ nights to attract the 25.7% of the market seeking extended stays.
- Adjust minimum nights based on seasonality – potentially shorter during low season and longer during peak demand periods in El Bolsón.
El Bolsón Airbnb Cancellation Policy Trends Analysis (2026)
Limited
4 listings
2.3% of total
Flexible
60 listings
35.1% of total
Moderate
47 listings
27.5% of total
Firm
50 listings
29.2% of total
Strict
10 listings
5.8% of total
Cancellation Policy Insights for El Bolsón
- The prevailing Airbnb cancellation policy trend in El Bolsón is Flexible, used by 35.1% of listings.
- There's a relatively balanced mix between guest-friendly (62.6%) and stricter (35.0%) policies, offering choices for different guest needs.
- Strict cancellation policies are quite rare (5.8%), potentially making listings with this policy less competitive unless justified by high demand or property type.
Recommendations for Hosts
- Consider adopting a Flexible policy to align with the 35.1% market standard in El Bolsón.
- Using a Strict policy might deter some guests, as only 5.8% of listings use it. Evaluate if potential revenue protection outweighs possible lower booking rates.
- Regularly review your cancellation policy against competitors and market demand shifts in El Bolsón.
El Bolsón STR Booking Lead Time Analysis (2026)
Average Booking Lead Time by Month
Booking Lead Time Insights for El Bolsón
- The overall average booking lead time for vacation rentals in El Bolsón is 38 days.
- Guests book furthest in advance for stays during January (average 53 days), likely coinciding with peak travel demand or local events.
- The shortest booking windows occur for stays in June (average 19 days), indicating more last-minute travel plans during this time.
- Seasonally, Winter (43 days avg.) sees the longest lead times, while Spring (28 days avg.) has the shortest, reflecting typical travel planning cycles.
Recommendations for Hosts
- Use the overall average lead time (38 days) as a baseline for your pricing and availability strategy in El Bolsón.
- For January stays, consider implementing length-of-stay discounts or slightly higher rates for bookings made less than 53 days out to capitalize on advance planning.
- Target marketing efforts for the Winter season well in advance (at least 43 days) to capture early planners.
- Monitor your own booking lead times against these El Bolsón averages to identify opportunities for dynamic pricing adjustments.
Popular & Essential Airbnb Amenities in El Bolsón (2026)
Amenity Prevalence
Amenity Insights for El Bolsón
- Essential amenities in El Bolsón that guests expect include: Wifi. Lacking these (this) could significantly impact bookings.
- Popular amenities like Kitchen, Heating, Free parking on premises are common but not universal. Offering these can provide a competitive edge.
Recommendations for Hosts
- Ensure your listing includes all essential amenities for El Bolsón: Wifi.
- Consider adding popular differentiators like Kitchen or Heating to increase appeal.
- Highlight unique or less common amenities you offer (e.g., hot tub, dedicated workspace, EV charger) in your listing description and photos.
- Regularly check competitor amenities in El Bolsón to stay competitive.
El Bolsón Airbnb Guest Demographics & Profile Analysis (2026)
Guest Profile Summary for El Bolsón
- The typical guest profile for Airbnb in El Bolsón consists of a mix of domestic (42%) and international guests, with top international origins including Brazil, typically belonging to the Post-2000s (Gen Z/Alpha) group (50%), primarily speaking Spanish or English.
- Domestic travelers account for 41.9% of guests.
- Key international markets include Argentina (41.9%) and Brazil (9.7%).
- Top languages spoken are Spanish (37%) followed by English (36%).
- A significant demographic segment is the Post-2000s (Gen Z/Alpha) group, representing 50% of guests.
Recommendations for Hosts
- Balance marketing efforts between domestic and international channels based on the guest mix.
- Tailor amenities and listing descriptions to appeal to the dominant Post-2000s (Gen Z/Alpha) demographic (e.g., highlight fast WiFi, smart home features, local guides).
- Highlight unique local experiences or amenities relevant to the primary guest profile.
- Consider seasonal promotions aligned with peak travel times for key origin markets.
Nearby Short-Term Rental Market Comparison
How does the El Bolsón Airbnb market stack up against its neighbors? Compare key performance metrics like average monthly revenue, ADR, and occupancy rates in surrounding areas to understand the broader regional STR landscape.
| Market | Active Properties | Monthly Revenue | Daily Rate | Avg. Occupancy |
|---|---|---|---|---|
| El Trébol | 11 | $1,292 | $220.51 | 37% |
| Lácar Department | 11 | $1,091 | $136.66 | 31% |
| Villa La Angostura | 137 | $1,011 | $151.75 | 35% |
| Municipio de Villa La Angostura | 397 | $992 | $155.66 | 33% |
| Municipio de San Martín de los Andes | 54 | $988 | $210.30 | 31% |
| San Carlos de Bariloche | 4,149 | $985 | $123.62 | 41% |
| Villa Catedral | 38 | $984 | $168.75 | 37% |
| Municipio de San Carlos de Bariloche | 86 | $937 | $144.57 | 35% |
| San Martín de los Andes | 917 | $755 | $115.11 | 35% |
| Puerto Varas | 1,250 | $660 | $102.65 | 38% |