Municipio de El Bolsón Airbnb Market Analysis 2026: Short Term Rental Data & Vacation Rental Statistics in Río Negro Province, Argentina
Is Airbnb profitable in Municipio de El Bolsón in 2026? Explore comprehensive Airbnb analytics for Municipio de El Bolsón, Río Negro Province, Argentina to uncover income potential. This 2026 STR market report for Municipio de El Bolsón, based on AirROI data from February 2025 to January 2026, reveals key trends in the niche market of 65 active listings.
Whether you're considering an Airbnb investment in Municipio de El Bolsón, optimizing your existing vacation rental, or exploring rental arbitrage opportunities, understanding the Municipio de El Bolsón Airbnb data is crucial. Leveraging the low regulation environment is key to maximizing your short term rental income potential. Let's dive into the specifics.
Key Municipio de El Bolsón Airbnb Performance Metrics Overview
Monthly Airbnb Revenue Variations & Income Potential in Municipio de El Bolsón (2026)
Understanding the monthly revenue variations for Airbnb listings in Municipio de El Bolsón is key to maximizing your short term rental income potential. Seasonality significantly impacts earnings. Our analysis, based on data from the past 12 months, shows that the peak revenue month for STRs in Municipio de El Bolsón is typically July, while May often presents the lowest earnings, highlighting opportunities for strategic pricing adjustments during shoulder and low seasons. Explore the typical Airbnb income in Municipio de El Bolsón across different performance tiers:
- Best-in-class properties (Top 10%) achieve $1,442+ monthly, often utilizing dynamic pricing and superior guest experiences.
- Strong performing properties (Top 25%) earn $837 or more, indicating effective management and desirable locations/amenities.
- Typical properties (Median) generate around $391 per month, representing the average market performance.
- Entry-level properties (Bottom 25%) see earnings around $204, often with potential for optimization.
Average Monthly Airbnb Earnings Trend in Municipio de El Bolsón
Municipio de El Bolsón Airbnb Occupancy Rate Trends (2026)
Maximize your bookings by understanding the Municipio de El Bolsón STR occupancy trends. Seasonal demand shifts significantly influence how often properties are booked. Typically, Februarysees the highest demand (peak season occupancy), while June experiences the lowest (low season). Effective strategies, like adjusting minimum stays or offering promotions, can boost occupancy during slower periods. Here's how different property tiers perform in Municipio de El Bolsón:
- Best-in-class properties (Top 10%) achieve 51%+ occupancy, indicating high desirability and potentially optimized availability.
- Strong performing properties (Top 25%) maintain 35% or higher occupancy, suggesting good market fit and guest satisfaction.
- Typical properties (Median) have an occupancy rate around 20%.
- Entry-level properties (Bottom 25%) average 9% occupancy, potentially facing higher vacancy.
Average Monthly Occupancy Rate Trend in Municipio de El Bolsón
Average Daily Rate (ADR) Airbnb Trends in Municipio de El Bolsón (2026)
Effective short term rental pricing strategy in Municipio de El Bolsón involves understanding monthly ADR fluctuations. The Average Daily Rate (ADR) for Airbnb in Municipio de El Bolsón typically peaks in February and dips lowest during November. Leveraging Airbnb dynamic pricing tools or strategies based on this seasonality can significantly boost revenue. Here's a look at the typical nightly rates achieved:
- Best-in-class properties (Top 10%) command rates of $160+ per night, often due to premium features or locations.
- Strong performing properties (Top 25%) achieve nightly rates of $95 or more.
- Typical properties (Median) charge around $67 per night.
- Entry-level properties (Bottom 25%) earn around $49 per night.
Average Daily Rate (ADR) Trend by Month in Municipio de El Bolsón
Get Live Municipio de El Bolsón Market Intelligence 👇
Explore Real-time Analytics
Airbnb Seasonality Analysis & Trends in Municipio de El Bolsón (2026)
Peak Season (July, February, January)
- Revenue averages $1,117 per month
- Occupancy rates average 35.0%
- Daily rates average $87
Shoulder Season
- Revenue averages $684 per month
- Occupancy maintains around 22.7%
- Daily rates hold near $83
Low Season (May, June, October)
- Revenue drops to average $501 per month
- Occupancy decreases to average 17.9%
- Daily rates adjust to average $82
Seasonality Insights for Municipio de El Bolsón
- The Airbnb seasonality in Municipio de El Bolsón shows highly seasonal trends requiring careful strategy. While the sections above show seasonal averages, it's also insightful to look at the extremes:
- During the high season, the absolute peak month showcases Municipio de El Bolsón's highest earning potential, with monthly revenues capable of climbing to $1,290, occupancy reaching a high of 40.8%, and ADRs peaking at $88.
- Conversely, the slowest single month of the year, typically falling within the low season, marks the market's lowest point. In this month, revenue might dip to $456, occupancy could drop to 15.3%, and ADRs may adjust down to $80.
- Understanding both the seasonal averages and these monthly peaks and troughs in revenue, occupancy, and ADR is crucial for maximizing your Airbnb profit potential in Municipio de El Bolsón.
Seasonal Strategies for Maximizing Profit
- Peak Season: Maximize revenue through premium pricing and potentially longer minimum stays. Ensure high availability.
- Low Season: Offer competitive pricing, special promotions (e.g., extended stay discounts), and flexible cancellation policies. Target off-season travelers like remote workers or budget-conscious guests.
- Shoulder Seasons: Implement dynamic pricing that balances peak and low rates. Target weekend travelers or specific events. Offer slightly more flexible terms than peak season.
- Regularly analyze your own performance against these Municipio de El Bolsón seasonality benchmarks and adjust your pricing and availability strategy accordingly.
Best Areas for Airbnb Investment in Municipio de El Bolsón (2026)
Exploring the top neighborhoods for short-term rentals in Municipio de El Bolsón? This section highlights key areas, outlining why they are attractive for hosts and guests, along with notable local attractions. Consider these locations based on your target guest profile and investment strategy.
| Neighborhood / Area | Why Host Here? (Target Guests & Appeal) | Key Attractions & Landmarks |
|---|---|---|
| El Bolsón City Center | The vibrant heart of El Bolsón, attractive to tourists for its local crafts, markets, and proximity to amenities, making it a prime spot for visitors. | El Bolsón Artisan Market, Cerro Piltriquitrón, Cascada Escondida, Local breweries and cafes, El Bolsón Park |
| Cerro Perito Moreno | A popular spot for outdoor activities, especially skiing and hiking, appealing to adventurous travelers seeking nature and sports during winter and summer. | Cerro Perito Moreno Ski Resort, Hiking trails, Paragliding spots, Stunning mountain vistas |
| Cerro Negro | Known for its scenic beauty and hiking opportunities, this area attracts nature lovers and adventure seekers looking for a peaceful retreat. | Hiking paths, Panoramic views, Natural landscapes, Ideal for camping |
| Río Azul | A beautiful natural area with access to the river, perfect for those looking for tranquility and outdoor activities such as canoeing and fishing. | Río Azul, Camping sites, Fishing spots, Scenic picnic areas |
| Puelo Lake | A stunning lake surrounded by mountains, perfect for water sports and relaxing vacations, a top choice among families and nature enthusiasts. | Lake Puelo Provincial Park, Kayaking and paddleboarding, Wildlife watching, Nature trails |
| Los Laguitos | A serene area with a series of lakes that offers a peaceful atmosphere, attracting visitors seeking relaxation and natural beauty. | Laguna El Juncal, Laguna Los Alerces, Fishing and swimming spots, Picnic areas |
| Chubut River Valley | Known for its incredible scenery and outdoor activities, a wonderful place for tourists interested in rafting and hiking, making it a dynamic host location. | Rafting on Chubut River, Scenic viewpoints, Biking trails |
| La playita | A charming area for beach lovers and families, with river access for water activities, making it ideal for summer getaways. | Beach area, Barbecuing spots, Relaxing by the river, Family-friendly activities |
Understanding Airbnb License Requirements & STR Laws in Municipio de El Bolsón (2026)
While Municipio de El Bolsón, Río Negro Province, Argentina currently shows low STR regulations, specific Airbnb license requirements might still exist or change. Always verify the latest short term rental regulations and Airbnb license requirements directly with local government authorities for Municipio de El Bolsón to ensure full compliance before hosting.
(Source: AirROI data, 2026, based on 2% licensed listings)
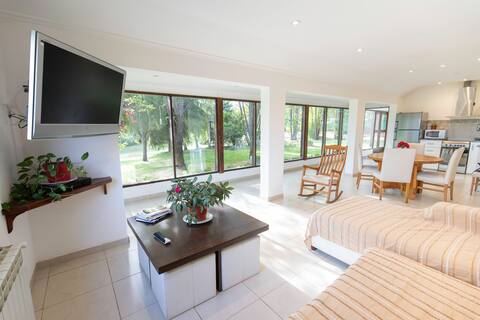
Top Performing Airbnb Properties in Municipio de El Bolsón (2026)
Benchmark your potential! Explore examples of top-performing Airbnb properties in Municipio de El Bolsónbased on Trailing Twelve Month (TTM) revenue. Analyze their characteristics, revenue, occupancy rate, and ADR to understand what drives success in this market.

Modern house in raspberry field
Entire Place • 4 bedrooms

El Remanso, a viewpoint in the mountains
Entire Place • 2 bedrooms
Casa "Las Chacras". Totalmente equipada.
Entire Place • 3 bedrooms

Full hostel in El Bolsón
Entire Place • 5 bedrooms

Sunset Home. Mountain Views, Great Location
Entire Place • 2 bedrooms

Snowflakes 3, center
Entire Place • 2 bedrooms
Note: Performance varies based on location, size, amenities, seasonality, and management quality. Data reflects the past 12 months.
Top Performing Airbnb Hosts in Municipio de El Bolsón (2026)
Learn from the best! This table showcases top-performing Airbnb hosts in Municipio de El Bolsón based on the number of properties managed and estimated total revenue over the past year. Analyze their scale and performance metrics.
| Host Name | Properties | Grossing Revenue | Stay Reviews | Avg Rating |
|---|---|---|---|---|
| Ignacio | 1 | $70,768 | 4 | 5.00/5.0 |
| Sabrina | 6 | $32,241 | 55 | 4.83/5.0 |
| El Remanso | 1 | $19,523 | 55 | 4.93/5.0 |
| Catalina | 5 | $18,195 | 102 | 4.97/5.0 |
| Javier | 2 | $14,797 | 7 | 5.00/5.0 |
| María Paz | 1 | $14,661 | 46 | 4.93/5.0 |
| Hector Alejandro | 3 | $11,702 | 64 | 4.99/5.0 |
| Sunset Agency | 1 | $11,411 | 31 | 4.97/5.0 |
| Mariana | 3 | $11,041 | 10 | 5.00/5.0 |
| Silvia | 2 | $10,430 | 15 | 4.92/5.0 |
Analyzing the strategies of top hosts, such as their property selection, pricing, and guest communication, can offer valuable lessons for optimizing your own Airbnb operations in Municipio de El Bolsón.
Dive Deeper: Advanced Municipio de El Bolsón STR Market Data (2026)
Ready to unlock more insights? AirROI provides access to advanced metrics and comprehensive Airbnb data for Municipio de El Bolsón. Explore detailed analytics beyond this report to refine your investment strategy, optimize pricing, and maximize your vacation rental profits.
Explore Advanced MetricsMunicipio de El Bolsón Short-Term Rental Market Composition (2026): Property & Room Types
Room Type Distribution
Property Type Distribution
Market Composition Insights for Municipio de El Bolsón
- The Municipio de El Bolsón Airbnb market composition is heavily skewed towards Entire Home/Apt listings, which make up 84.6% of the 65 active rentals. This indicates strong guest preference for privacy and space.
- Looking at the property type distribution in Municipio de El Bolsón, Apartment/Condo properties are the most common (33.8%), reflecting the local real estate landscape.
- Houses represent a significant 29.2% portion, catering likely to families or larger groups.
- The presence of 6.2% Hotel/Boutique listings indicates integration with traditional hospitality.
Municipio de El Bolsón Airbnb Room Capacity Analysis (2026): Bedroom Distribution
Distribution of Listings by Number of Bedrooms
Room Capacity Insights for Municipio de El Bolsón
- The dominant room capacity in Municipio de El Bolsón is 1 bedroom listings, making up 38.5% of the market. This suggests a strong demand for properties suitable for couples or solo travelers.
- Together, 1 bedroom and 2 bedrooms properties represent 75.4% of the active Airbnb listings in Municipio de El Bolsón, indicating a high concentration in these sizes.
Municipio de El Bolsón Vacation Rental Guest Capacity Trends (2026)
Distribution of Listings by Guest Capacity
Guest Capacity Insights for Municipio de El Bolsón
- The most common guest capacity trend in Municipio de El Bolsón vacation rentals is listings accommodating 4 guests (32.3%). This suggests the primary traveler segment is likely small families or groups.
- Properties designed for 4 guests and 2 guests dominate the Municipio de El Bolsón STR market, accounting for 47.7% of listings.
- 16.9% of properties accommodate 6+ guests, serving the market segment for larger families or group travel in Municipio de El Bolsón.
- On average, properties in Municipio de El Bolsón are equipped to host 3.6 guests.
Municipio de El Bolsón Airbnb Booking Patterns (2026): Available vs. Booked Days
Available Days Distribution
Booked Days Distribution
Booking Pattern Insights for Municipio de El Bolsón
- The most common availability pattern in Municipio de El Bolsón falls within the 271-366 days range, representing 84.6% of listings. This suggests many properties have significant open periods on their calendars.
- Approximately 100.0% of listings show high availability (181+ days open annually), indicating potential for increased bookings or specific owner usage patterns.
- For booked days, the 31-90 days range is most frequent in Municipio de El Bolsón (41.5%), reflecting common guest stay durations or potential owner blocking patterns.
Municipio de El Bolsón Airbnb Minimum Stay Requirements Analysis
Distribution of Listings by Minimum Night Requirement
1 Night
19 listings
29.2% of total
2 Nights
15 listings
23.1% of total
3 Nights
5 listings
7.7% of total
30+ Nights
26 listings
40% of total
Key Insights
- The most prevalent minimum stay requirement in Municipio de El Bolsón is 30+ Nights, adopted by 40% of listings. This highlights the market's preference for longer commitments.
- A significant segment (40%) caters to monthly stays (30+ nights) in Municipio de El Bolsón, pointing to opportunities in the extended-stay market.
Recommendations
- Align with the market by considering a 30+ Nights minimum stay, as 40% of Municipio de El Bolsón hosts use this setting.
- If feasible, allowing 1-night stays, especially midweek or during low season, could capture last-minute bookings, as only 29.2% currently do.
- Explore offering discounts for stays of 30+ nights to attract the 40% of the market seeking extended stays.
- Adjust minimum nights based on seasonality – potentially shorter during low season and longer during peak demand periods in Municipio de El Bolsón.
Municipio de El Bolsón Airbnb Cancellation Policy Trends Analysis (2026)
Limited
1 listings
1.5% of total
Flexible
28 listings
43.1% of total
Moderate
9 listings
13.8% of total
Firm
26 listings
40% of total
Strict
1 listings
1.5% of total
Cancellation Policy Insights for Municipio de El Bolsón
- The prevailing Airbnb cancellation policy trend in Municipio de El Bolsón is Flexible, used by 43.1% of listings.
- There's a relatively balanced mix between guest-friendly (56.9%) and stricter (41.5%) policies, offering choices for different guest needs.
- Strict cancellation policies are quite rare (1.5%), potentially making listings with this policy less competitive unless justified by high demand or property type.
Recommendations for Hosts
- Consider adopting a Flexible policy to align with the 43.1% market standard in Municipio de El Bolsón.
- Using a Strict policy might deter some guests, as only 1.5% of listings use it. Evaluate if potential revenue protection outweighs possible lower booking rates.
- Regularly review your cancellation policy against competitors and market demand shifts in Municipio de El Bolsón.
Municipio de El Bolsón STR Booking Lead Time Analysis (2026)
Average Booking Lead Time by Month
Booking Lead Time Insights for Municipio de El Bolsón
- The overall average booking lead time for vacation rentals in Municipio de El Bolsón is 31 days.
- Guests book furthest in advance for stays during January (average 48 days), likely coinciding with peak travel demand or local events.
- The shortest booking windows occur for stays in May (average 18 days), indicating more last-minute travel plans during this time.
- Seasonally, Winter (38 days avg.) sees the longest lead times, while Spring (22 days avg.) has the shortest, reflecting typical travel planning cycles.
Recommendations for Hosts
- Use the overall average lead time (31 days) as a baseline for your pricing and availability strategy in Municipio de El Bolsón.
- For January stays, consider implementing length-of-stay discounts or slightly higher rates for bookings made less than 48 days out to capitalize on advance planning.
- Target marketing efforts for the Winter season well in advance (at least 38 days) to capture early planners.
- Monitor your own booking lead times against these Municipio de El Bolsón averages to identify opportunities for dynamic pricing adjustments.
Popular & Essential Airbnb Amenities in Municipio de El Bolsón (2026)
Amenity Prevalence
Amenity Insights for Municipio de El Bolsón
- Essential amenities in Municipio de El Bolsón that guests expect include: Wifi. Lacking these (this) could significantly impact bookings.
- Popular amenities like Kitchen, Fire extinguisher, Free parking on premises are common but not universal. Offering these can provide a competitive edge.
Recommendations for Hosts
- Ensure your listing includes all essential amenities for Municipio de El Bolsón: Wifi.
- Consider adding popular differentiators like Kitchen or Fire extinguisher to increase appeal.
- Highlight unique or less common amenities you offer (e.g., hot tub, dedicated workspace, EV charger) in your listing description and photos.
- Regularly check competitor amenities in Municipio de El Bolsón to stay competitive.
Municipio de El Bolsón Airbnb Guest Demographics & Profile Analysis (2026)
Guest Profile Summary for Municipio de El Bolsón
- The typical guest profile for Airbnb in Municipio de El Bolsón consists of a mix of domestic (46%) and international guests, with top international origins including United States, typically belonging to the Post-2000s (Gen Z/Alpha) group (50%), primarily speaking English or Spanish.
- Domestic travelers account for 46.2% of guests.
- Key international markets include Argentina (46.2%) and United States (13.7%).
- Top languages spoken are English (38.7%) followed by Spanish (38.7%).
- A significant demographic segment is the Post-2000s (Gen Z/Alpha) group, representing 50% of guests.
Recommendations for Hosts
- Balance marketing efforts between domestic and international channels based on the guest mix.
- Tailor amenities and listing descriptions to appeal to the dominant Post-2000s (Gen Z/Alpha) demographic (e.g., highlight fast WiFi, smart home features, local guides).
- Highlight unique local experiences or amenities relevant to the primary guest profile.
- Consider seasonal promotions aligned with peak travel times for key origin markets.
Nearby Short-Term Rental Market Comparison
How does the Municipio de El Bolsón Airbnb market stack up against its neighbors? Compare key performance metrics like average monthly revenue, ADR, and occupancy rates in surrounding areas to understand the broader regional STR landscape.
| Market | Active Properties | Monthly Revenue | Daily Rate | Avg. Occupancy |
|---|---|---|---|---|
| El Trébol | 11 | $1,292 | $220.51 | 37% |
| Lácar Department | 11 | $1,091 | $136.66 | 31% |
| Villa La Angostura | 137 | $1,011 | $151.75 | 35% |
| Municipio de Villa La Angostura | 397 | $992 | $155.66 | 33% |
| Municipio de San Martín de los Andes | 54 | $988 | $210.30 | 31% |
| San Carlos de Bariloche | 4,149 | $985 | $123.62 | 41% |
| Villa Catedral | 38 | $984 | $168.75 | 37% |
| Municipio de San Carlos de Bariloche | 86 | $937 | $144.57 | 35% |
| San Martín de los Andes | 917 | $755 | $115.11 | 35% |
| Puerto Varas | 1,250 | $660 | $102.65 | 38% |