San Miguel de Tucumán Airbnb Market Analysis 2026: Short Term Rental Data & Vacation Rental Statistics in Tucumán, Argentina
Is Airbnb profitable in San Miguel de Tucumán in 2026? Explore comprehensive Airbnb analytics for San Miguel de Tucumán, Tucumán, Argentina to uncover income potential. This 2026 STR market report for San Miguel de Tucumán, based on AirROI data from February 2025 to January 2026, reveals key trends in the market of 301 active listings.
Whether you're considering an Airbnb investment in San Miguel de Tucumán, optimizing your existing vacation rental, or exploring rental arbitrage opportunities, understanding the San Miguel de Tucumán Airbnb data is crucial. Leveraging the low regulation environment is key to maximizing your short term rental income potential. Let's dive into the specifics.
Key San Miguel de Tucumán Airbnb Performance Metrics Overview
Monthly Airbnb Revenue Variations & Income Potential in San Miguel de Tucumán (2026)
Understanding the monthly revenue variations for Airbnb listings in San Miguel de Tucumán is key to maximizing your short term rental income potential. Seasonality significantly impacts earnings. Our analysis, based on data from the past 12 months, shows that the peak revenue month for STRs in San Miguel de Tucumán is typically July, while May often presents the lowest earnings, highlighting opportunities for strategic pricing adjustments during shoulder and low seasons. Explore the typical Airbnb income in San Miguel de Tucumán across different performance tiers:
- Best-in-class properties (Top 10%) achieve $856+ monthly, often utilizing dynamic pricing and superior guest experiences.
- Strong performing properties (Top 25%) earn $595 or more, indicating effective management and desirable locations/amenities.
- Typical properties (Median) generate around $333 per month, representing the average market performance.
- Entry-level properties (Bottom 25%) see earnings around $156, often with potential for optimization.
Average Monthly Airbnb Earnings Trend in San Miguel de Tucumán
San Miguel de Tucumán Airbnb Occupancy Rate Trends (2026)
Maximize your bookings by understanding the San Miguel de Tucumán STR occupancy trends. Seasonal demand shifts significantly influence how often properties are booked. Typically, Julysees the highest demand (peak season occupancy), while January experiences the lowest (low season). Effective strategies, like adjusting minimum stays or offering promotions, can boost occupancy during slower periods. Here's how different property tiers perform in San Miguel de Tucumán:
- Best-in-class properties (Top 10%) achieve 78%+ occupancy, indicating high desirability and potentially optimized availability.
- Strong performing properties (Top 25%) maintain 55% or higher occupancy, suggesting good market fit and guest satisfaction.
- Typical properties (Median) have an occupancy rate around 29%.
- Entry-level properties (Bottom 25%) average 13% occupancy, potentially facing higher vacancy.
Average Monthly Occupancy Rate Trend in San Miguel de Tucumán
Average Daily Rate (ADR) Airbnb Trends in San Miguel de Tucumán (2026)
Effective short term rental pricing strategy in San Miguel de Tucumán involves understanding monthly ADR fluctuations. The Average Daily Rate (ADR) for Airbnb in San Miguel de Tucumán typically peaks in January and dips lowest during March. Leveraging Airbnb dynamic pricing tools or strategies based on this seasonality can significantly boost revenue. Here's a look at the typical nightly rates achieved:
- Best-in-class properties (Top 10%) command rates of $60+ per night, often due to premium features or locations.
- Strong performing properties (Top 25%) achieve nightly rates of $43 or more.
- Typical properties (Median) charge around $34 per night.
- Entry-level properties (Bottom 25%) earn around $27 per night.
Average Daily Rate (ADR) Trend by Month in San Miguel de Tucumán
Get Live San Miguel de Tucumán Market Intelligence 👇

Explore Real-time Analytics
Airbnb Seasonality Analysis & Trends in San Miguel de Tucumán (2026)
Peak Season (July, December, October)
- Revenue averages $509 per month
- Occupancy rates average 39.4%
- Daily rates average $48
Shoulder Season
- Revenue averages $433 per month
- Occupancy maintains around 35.7%
- Daily rates hold near $47
Low Season (February, May, June)
- Revenue drops to average $352 per month
- Occupancy decreases to average 33.0%
- Daily rates adjust to average $37
Seasonality Insights for San Miguel de Tucumán
- The Airbnb seasonality in San Miguel de Tucumán shows moderate seasonality with distinct peak and low periods. While the sections above show seasonal averages, it's also insightful to look at the extremes:
- During the high season, the absolute peak month showcases San Miguel de Tucumán's highest earning potential, with monthly revenues capable of climbing to $521, occupancy reaching a high of 42.7%, and ADRs peaking at $74.
- Conversely, the slowest single month of the year, typically falling within the low season, marks the market's lowest point. In this month, revenue might dip to $333, occupancy could drop to 28.2%, and ADRs may adjust down to $36.
- Understanding both the seasonal averages and these monthly peaks and troughs in revenue, occupancy, and ADR is crucial for maximizing your Airbnb profit potential in San Miguel de Tucumán.
Seasonal Strategies for Maximizing Profit
- Peak Season: Maximize revenue through premium pricing and potentially longer minimum stays. Ensure high availability.
- Low Season: Offer competitive pricing, special promotions (e.g., extended stay discounts), and flexible cancellation policies. Target off-season travelers like remote workers or budget-conscious guests.
- Shoulder Seasons: Implement dynamic pricing that balances peak and low rates. Target weekend travelers or specific events. Offer slightly more flexible terms than peak season.
- Regularly analyze your own performance against these San Miguel de Tucumán seasonality benchmarks and adjust your pricing and availability strategy accordingly.
Best Areas for Airbnb Investment in San Miguel de Tucumán (2026)
Exploring the top neighborhoods for short-term rentals in San Miguel de Tucumán? This section highlights key areas, outlining why they are attractive for hosts and guests, along with notable local attractions. Consider these locations based on your target guest profile and investment strategy.
| Neighborhood / Area | Why Host Here? (Target Guests & Appeal) | Key Attractions & Landmarks |
|---|---|---|
| Nuevos Horizontes | A rapidly developing neighborhood known for its modern amenities and proximity to shopping centers. It's appealing to families and young professionals alike, offering a good balance of urban life and residential comfort. | Catedral de Tucumán, Parque 9 de Julio, Museo de la Industria Azucarera, Shopping del Solar, Plaza Independencia |
| Centro | The heart of San Miguel de Tucumán, this area is bustling with activity, shops, and restaurants. It attracts tourists who want to be in the midst of cultural landmarks and nightlife. | Casa Histórica de la Independencia, Plaza Sarmiento, Teatro San Martín, Museo Casa Timoteo Navarro, Mercado del Norte |
| Villa 9 de Julio | Known for its residential appeal, this area has parks and green spaces, making it popular with families and those looking for a quieter ambiance without going far from the city. | Parque Avellaneda, Complejo Cultural Alberto Rouges, Centro de Salud Huerta Grande |
| Finca El Cadillal | A picturesque area known for its natural beauty and outdoor activities. This site is perfect for tourists looking for nature retreats and water sports. | Embalse El Cadillal, Parque Nacional Quebrada del Condorito, Recreational areas and beaches |
| San Pablo | An emerging area gaining attention for its affordable housing and friendly community. It's attracting young families and investors looking for future developments. | Local markets, Community parks, Access to schools and essential services |
| Yerba Buena | An upscale suburb of San Miguel de Tucumán, known for its fantastic views, safety, and quality of life. This area is perfect for affluent tourists and expatriates. | Parque Yungas, Cerro San Javier, Shopping Avenida |
| La Banda del Río Salí | A nearby city offering a mix of urban and rural experiences. It’s conversant with visitors looking for a different perspective and local charm. | Cerro de la Cruz, Historic sites, Food markets |
| El Siambón | Famous for its scenic views and hiking trails, it's a great getaway destination for tourists from the city looking for outdoor adventures and nature. | Hiking trails, Natural parks, Local wildlife |
Understanding Airbnb License Requirements & STR Laws in San Miguel de Tucumán (2026)
While San Miguel de Tucumán, Tucumán, Argentina currently shows low STR regulations, specific Airbnb license requirements might still exist or change. Always verify the latest short term rental regulations and Airbnb license requirements directly with local government authorities for San Miguel de Tucumán to ensure full compliance before hosting.
(Source: AirROI data, 2026, based on 0% licensed listings)
Top Performing Airbnb Properties in San Miguel de Tucumán (2026)
Benchmark your potential! Explore examples of top-performing Airbnb properties in San Miguel de Tucumánbased on Trailing Twelve Month (TTM) revenue. Analyze their characteristics, revenue, occupancy rate, and ADR to understand what drives success in this market.
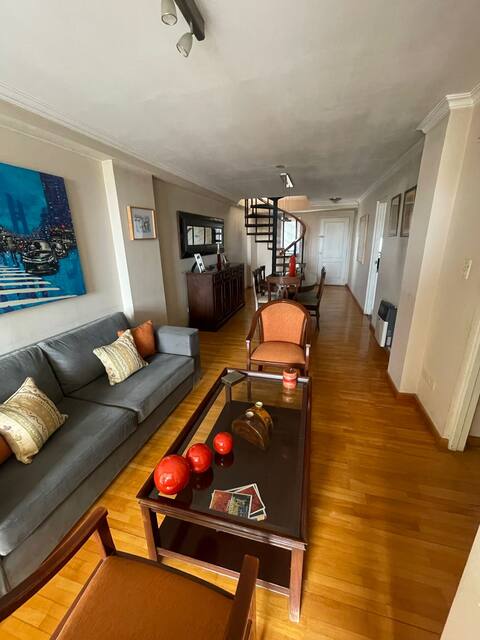
Beautiful penthouse with a garage
Entire Place • 3 bedrooms

Downtown apartment Tucumán
Entire Place • 3 bedrooms
Apartment Rioja
Entire Place • N/A

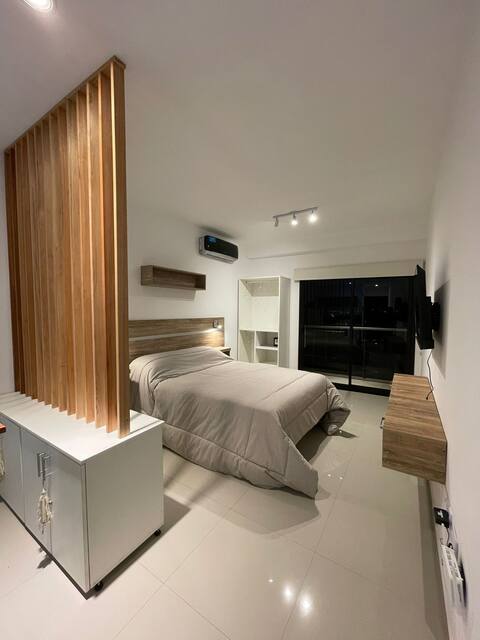
Fantastic central, modern and bright apartment.
Entire Place • 1 bedroom

Brand new premium apartment
Entire Place • 1 bedroom

Santa Fe STAR - Car garage
Entire Place • 1 bedroom
Note: Performance varies based on location, size, amenities, seasonality, and management quality. Data reflects the past 12 months.
Top Performing Airbnb Hosts in San Miguel de Tucumán (2026)
Learn from the best! This table showcases top-performing Airbnb hosts in San Miguel de Tucumán based on the number of properties managed and estimated total revenue over the past year. Analyze their scale and performance metrics.
| Host Name | Properties | Grossing Revenue | Stay Reviews | Avg Rating |
|---|---|---|---|---|
| Maria Betsabe | 16 | $96,903 | 106 | 4.57/5.0 |
| Pia | 9 | $43,255 | 189 | 4.96/5.0 |
| Gabriel | 4 | $36,400 | 101 | 4.96/5.0 |
| Paula | 11 | $32,521 | 110 | 4.78/5.0 |
| Martin | 7 | $30,057 | 271 | 4.86/5.0 |
| Temporalis | 7 | $27,755 | 149 | 4.61/5.0 |
| Sofia | 5 | $25,479 | 50 | 4.70/5.0 |
| Coke | 3 | $25,076 | 51 | 4.82/5.0 |
| Enrique | 1 | $17,951 | 20 | 4.90/5.0 |
| Rosana | 1 | $15,207 | 38 | 5.00/5.0 |
Analyzing the strategies of top hosts, such as their property selection, pricing, and guest communication, can offer valuable lessons for optimizing your own Airbnb operations in San Miguel de Tucumán.
Dive Deeper: Advanced San Miguel de Tucumán STR Market Data (2026)
Ready to unlock more insights? AirROI provides access to advanced metrics and comprehensive Airbnb data for San Miguel de Tucumán. Explore detailed analytics beyond this report to refine your investment strategy, optimize pricing, and maximize your vacation rental profits.
Explore Advanced MetricsSan Miguel de Tucumán Short-Term Rental Market Composition (2026): Property & Room Types
Room Type Distribution
Property Type Distribution
Market Composition Insights for San Miguel de Tucumán
- The San Miguel de Tucumán Airbnb market composition is heavily skewed towards Entire Home/Apt listings, which make up 90.7% of the 301 active rentals. This indicates strong guest preference for privacy and space.
- Looking at the property type distribution in San Miguel de Tucumán, Apartment/Condo properties are the most common (88.4%), reflecting the local real estate landscape.
- The presence of 6% Hotel/Boutique listings indicates integration with traditional hospitality.
San Miguel de Tucumán Airbnb Room Capacity Analysis (2026): Bedroom Distribution
Distribution of Listings by Number of Bedrooms
Room Capacity Insights for San Miguel de Tucumán
- The dominant room capacity in San Miguel de Tucumán is 1 bedroom listings, making up 66.1% of the market. This suggests a strong demand for properties suitable for couples or solo travelers.
- Together, 1 bedroom and 2 bedrooms properties represent 79.7% of the active Airbnb listings in San Miguel de Tucumán, indicating a high concentration in these sizes.
- With over half the market (66.1%) consisting of studios or 1-bedroom units, San Miguel de Tucumán is particularly well-suited for individuals or couples.
- Listings with 3+ bedrooms (5.0%) represent a smaller niche, potentially indicating an underserved market for larger group accommodations in San Miguel de Tucumán.
San Miguel de Tucumán Vacation Rental Guest Capacity Trends (2026)
Distribution of Listings by Guest Capacity
Guest Capacity Insights for San Miguel de Tucumán
- The most common guest capacity trend in San Miguel de Tucumán vacation rentals is listings accommodating 2 guests (44.2%). This suggests the primary traveler segment is likely couples or solo travelers.
- Properties designed for 2 guests and 4 guests dominate the San Miguel de Tucumán STR market, accounting for 67.8% of listings.
- A significant 44.2% of listings cater specifically to 1-2 guests, highlighting strong demand from couples and solo travelers in San Miguel de Tucumán.
- Listings for large groups (6+ guests) are relatively rare (4.6%), potentially indicating an opportunity for hosts targeting this segment in San Miguel de Tucumán.
- On average, properties in San Miguel de Tucumán are equipped to host 2.9 guests.
San Miguel de Tucumán Airbnb Booking Patterns (2026): Available vs. Booked Days
Available Days Distribution
Booked Days Distribution
Booking Pattern Insights for San Miguel de Tucumán
- The most common availability pattern in San Miguel de Tucumán falls within the 271-366 days range, representing 66.1% of listings. This suggests many properties have significant open periods on their calendars.
- Approximately 86.7% of listings show high availability (181+ days open annually), indicating potential for increased bookings or specific owner usage patterns.
- For booked days, the 31-90 days range is most frequent in San Miguel de Tucumán (32.9%), reflecting common guest stay durations or potential owner blocking patterns.
- A notable 14.6% of properties secure long booking periods (181+ days booked per year), highlighting successful long-term rental strategies or significant owner usage.
San Miguel de Tucumán Airbnb Minimum Stay Requirements Analysis
Distribution of Listings by Minimum Night Requirement
1 Night
96 listings
31.9% of total
2 Nights
103 listings
34.2% of total
3 Nights
19 listings
6.3% of total
4-6 Nights
5 listings
1.7% of total
7-29 Nights
1 listings
0.3% of total
30+ Nights
77 listings
25.6% of total
Key Insights
- The most prevalent minimum stay requirement in San Miguel de Tucumán is 2 Nights, adopted by 34.2% of listings. This highlights the market's preference for shorter, flexible bookings.
- A strong majority (66.1%) of the San Miguel de Tucumán Airbnb data shows acceptance of very short stays (1-2 nights), indicating a dynamic, high-turnover market.
- A significant segment (25.6%) caters to monthly stays (30+ nights) in San Miguel de Tucumán, pointing to opportunities in the extended-stay market.
Recommendations
- Align with the market by considering a 2 Nights minimum stay, as 34.2% of San Miguel de Tucumán hosts use this setting.
- Explore offering discounts for stays of 30+ nights to attract the 25.6% of the market seeking extended stays.
- Adjust minimum nights based on seasonality – potentially shorter during low season and longer during peak demand periods in San Miguel de Tucumán.
San Miguel de Tucumán Airbnb Cancellation Policy Trends Analysis (2026)
Limited
3 listings
1% of total
Flexible
161 listings
53.8% of total
Moderate
94 listings
31.4% of total
Firm
34 listings
11.4% of total
Strict
7 listings
2.3% of total
Cancellation Policy Insights for San Miguel de Tucumán
- The prevailing Airbnb cancellation policy trend in San Miguel de Tucumán is Flexible, used by 53.8% of listings.
- The market strongly favors guest-friendly terms, with 85.2% of listings offering Flexible or Moderate policies. This suggests guests in San Miguel de Tucumán may expect booking flexibility.
- Strict cancellation policies are quite rare (2.3%), potentially making listings with this policy less competitive unless justified by high demand or property type.
Recommendations for Hosts
- Consider adopting a Flexible policy to align with the 53.8% market standard in San Miguel de Tucumán.
- Given the high prevalence of Flexible policies (53.8%), offering this can enhance booking appeal, especially during shoulder seasons.
- Using a Strict policy might deter some guests, as only 2.3% of listings use it. Evaluate if potential revenue protection outweighs possible lower booking rates.
- Regularly review your cancellation policy against competitors and market demand shifts in San Miguel de Tucumán.
San Miguel de Tucumán STR Booking Lead Time Analysis (2026)
Average Booking Lead Time by Month
Booking Lead Time Insights for San Miguel de Tucumán
- The overall average booking lead time for vacation rentals in San Miguel de Tucumán is 20 days.
- Guests book furthest in advance for stays during August (average 27 days), likely coinciding with peak travel demand or local events.
- The shortest booking windows occur for stays in June (average 13 days), indicating more last-minute travel plans during this time.
- Seasonally, Summer (20 days avg.) sees the longest lead times, while Winter (17 days avg.) has the shortest, reflecting typical travel planning cycles.
Recommendations for Hosts
- Use the overall average lead time (20 days) as a baseline for your pricing and availability strategy in San Miguel de Tucumán.
- Target marketing efforts for the Summer season well in advance (at least 20 days) to capture early planners.
- Monitor your own booking lead times against these San Miguel de Tucumán averages to identify opportunities for dynamic pricing adjustments.
Popular & Essential Airbnb Amenities in San Miguel de Tucumán (2026)
Amenity Prevalence
Amenity Insights for San Miguel de Tucumán
- Essential amenities in San Miguel de Tucumán that guests expect include: Wifi, Air conditioning. Lacking these (any) could significantly impact bookings.
- Popular amenities like TV, Kitchen, Heating are common but not universal. Offering these can provide a competitive edge.
Recommendations for Hosts
- Ensure your listing includes all essential amenities for San Miguel de Tucumán: Wifi, Air conditioning.
- Prioritize adding missing essentials: Wifi, Air conditioning.
- Consider adding popular differentiators like TV or Kitchen to increase appeal.
- Highlight unique or less common amenities you offer (e.g., hot tub, dedicated workspace, EV charger) in your listing description and photos.
- Regularly check competitor amenities in San Miguel de Tucumán to stay competitive.
San Miguel de Tucumán Airbnb Guest Demographics & Profile Analysis (2026)
Guest Profile Summary for San Miguel de Tucumán
- The typical guest profile for Airbnb in San Miguel de Tucumán consists of primarily domestic travelers (67%), often arriving from nearby Buenos Aires, typically belonging to the Post-2000s (Gen Z/Alpha) group (50%), primarily speaking Spanish or English.
- Domestic travelers account for 66.8% of guests.
- Key international markets include Argentina (66.8%) and United States (6.6%).
- Top languages spoken are Spanish (42.8%) followed by English (35.2%).
- A significant demographic segment is the Post-2000s (Gen Z/Alpha) group, representing 50% of guests.
Recommendations for Hosts
- Target domestic marketing efforts towards travelers from Buenos Aires and San Miguel de Tucumán.
- Tailor amenities and listing descriptions to appeal to the dominant Post-2000s (Gen Z/Alpha) demographic (e.g., highlight fast WiFi, smart home features, local guides).
- Highlight unique local experiences or amenities relevant to the primary guest profile.
- Consider seasonal promotions aligned with peak travel times for key origin markets.
Nearby Short-Term Rental Market Comparison
How does the San Miguel de Tucumán Airbnb market stack up against its neighbors? Compare key performance metrics like average monthly revenue, ADR, and occupancy rates in surrounding areas to understand the broader regional STR landscape.
| Market | Active Properties | Monthly Revenue | Daily Rate | Avg. Occupancy |
|---|---|---|---|---|
| Cafayate | 137 | $780 | $99.87 | 28% |
| Cachi | 26 | $595 | $81.99 | 26% |
| Municipio de Raco | 10 | $533 | $100.95 | 22% |
| Yerba Buena | 77 | $469 | $81.80 | 30% |
| Departamento Tafí del Valle | 100 | $412 | $103.59 | 21% |
| Municipio de La Banda | 12 | $295 | $99.64 | 14% |
| Santiago del Estero | 138 | $291 | $70.09 | 23% |
| Termas de Río Hondo | 19 | $220 | $103.48 | 18% |
| Tafí del Valle | 11 | $159 | $71.31 | 17% |
| La Banda | 11 | $140 | $95.03 | 13% |