Vanadzor Airbnb Market Analysis 2026: Short Term Rental Data & Vacation Rental Statistics in Lori Province, Armenia
Is Airbnb profitable in Vanadzor in 2026? Explore comprehensive Airbnb analytics for Vanadzor, Lori Province, Armenia to uncover income potential. This 2026 STR market report for Vanadzor, based on AirROI data from May 2024 to April 2025, reveals key trends in the niche market of 31 active listings.
Whether you're considering an Airbnb investment in Vanadzor, optimizing your existing vacation rental, or exploring rental arbitrage opportunities, understanding the Vanadzor Airbnb data is crucial. Leveraging the low regulation environment is key to maximizing your short term rental income potential. Let's dive into the specifics.
Key Vanadzor Airbnb Performance Metrics Overview
Monthly Airbnb Revenue Variations & Income Potential in Vanadzor (2026)
Understanding the monthly revenue variations for Airbnb listings in Vanadzor is key to maximizing your short term rental income potential. Seasonality significantly impacts earnings. Our analysis, based on data from the past 12 months, shows that the peak revenue month for STRs in Vanadzor is typically May, while March often presents the lowest earnings, highlighting opportunities for strategic pricing adjustments during shoulder and low seasons. Explore the typical Airbnb income in Vanadzor across different performance tiers:
- Best-in-class properties (Top 10%) achieve $2,042+ monthly, often utilizing dynamic pricing and superior guest experiences.
- Strong performing properties (Top 25%) earn $908 or more, indicating effective management and desirable locations/amenities.
- Typical properties (Median) generate around $436 per month, representing the average market performance.
- Entry-level properties (Bottom 25%) see earnings around $239, often with potential for optimization.
Average Monthly Airbnb Earnings Trend in Vanadzor
Vanadzor Airbnb Occupancy Rate Trends (2026)
Maximize your bookings by understanding the Vanadzor STR occupancy trends. Seasonal demand shifts significantly influence how often properties are booked. Typically, Octobersees the highest demand (peak season occupancy), while March experiences the lowest (low season). Effective strategies, like adjusting minimum stays or offering promotions, can boost occupancy during slower periods. Here's how different property tiers perform in Vanadzor:
- Best-in-class properties (Top 10%) achieve 51%+ occupancy, indicating high desirability and potentially optimized availability.
- Strong performing properties (Top 25%) maintain 40% or higher occupancy, suggesting good market fit and guest satisfaction.
- Typical properties (Median) have an occupancy rate around 20%.
- Entry-level properties (Bottom 25%) average 11% occupancy, potentially facing higher vacancy.
Average Monthly Occupancy Rate Trend in Vanadzor
Average Daily Rate (ADR) Airbnb Trends in Vanadzor (2026)
Effective short term rental pricing strategy in Vanadzor involves understanding monthly ADR fluctuations. The Average Daily Rate (ADR) for Airbnb in Vanadzor typically peaks in December and dips lowest during May. Leveraging Airbnb dynamic pricing tools or strategies based on this seasonality can significantly boost revenue. Here's a look at the typical nightly rates achieved:
- Best-in-class properties (Top 10%) command rates of $112+ per night, often due to premium features or locations.
- Strong performing properties (Top 25%) achieve nightly rates of $71 or more.
- Typical properties (Median) charge around $40 per night.
- Entry-level properties (Bottom 25%) earn around $25 per night.
Average Daily Rate (ADR) Trend by Month in Vanadzor
Get Live Vanadzor Market Intelligence 👇

Explore Real-time Analytics
Airbnb Seasonality Analysis & Trends in Vanadzor (2025)
Peak Season (May, June, November)
- Revenue averages $1,547 per month
- Occupancy rates average 28.2%
- Daily rates average $54
Shoulder Season
- Revenue averages $586 per month
- Occupancy maintains around 30.0%
- Daily rates hold near $57
Low Season (February, March, December)
- Revenue drops to average $173 per month
- Occupancy decreases to average 18.1%
- Daily rates adjust to average $62
Seasonality Insights for Vanadzor
- The Airbnb seasonality in Vanadzor shows highly seasonal trends requiring careful strategy. While the sections above show seasonal averages, it's also insightful to look at the extremes:
- During the high season, the absolute peak month showcases Vanadzor's highest earning potential, with monthly revenues capable of climbing to $1,908, occupancy reaching a high of 47.7%, and ADRs peaking at $63.
- Conversely, the slowest single month of the year, typically falling within the low season, marks the market's lowest point. In this month, revenue might dip to $132, occupancy could drop to 13.8%, and ADRs may adjust down to $54.
- Understanding both the seasonal averages and these monthly peaks and troughs in revenue, occupancy, and ADR is crucial for maximizing your Airbnb profit potential in Vanadzor.
Seasonal Strategies for Maximizing Profit
- Peak Season: Maximize revenue through premium pricing and potentially longer minimum stays. Ensure high availability.
- Low Season: Offer competitive pricing, special promotions (e.g., extended stay discounts), and flexible cancellation policies. Target off-season travelers like remote workers or budget-conscious guests.
- Shoulder Seasons: Implement dynamic pricing that balances peak and low rates. Target weekend travelers or specific events. Offer slightly more flexible terms than peak season.
- Regularly analyze your own performance against these Vanadzor seasonality benchmarks and adjust your pricing and availability strategy accordingly.
Best Areas for Airbnb Investment in Vanadzor (2026)
Exploring the top neighborhoods for short-term rentals in Vanadzor? This section highlights key areas, outlining why they are attractive for hosts and guests, along with notable local attractions. Consider these locations based on your target guest profile and investment strategy.
| Neighborhood / Area | Why Host Here? (Target Guests & Appeal) | Key Attractions & Landmarks |
|---|---|---|
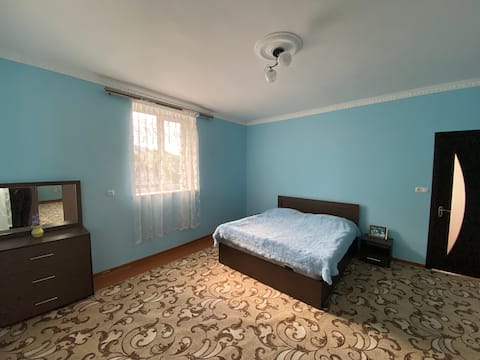
| Central Vanadzor | The heart of Vanadzor, close to city amenities, parks, and cultural sites. Ideal for guests who want to explore the local food, shopping, and entertainment scenes. | Vanadzor Park, Lori-Pambak Geological Museum, Vanadzor Art Museum, Local cafes and restaurants, Shopping districts |
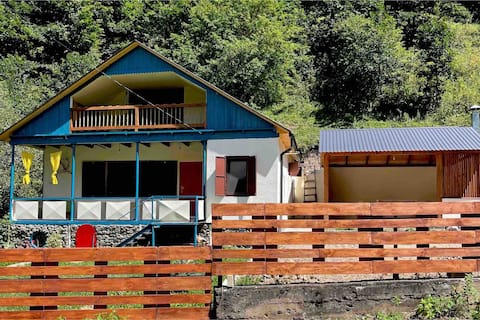
| Dzoraget River Area | Scenic area along the Dzoraget River, known for its natural beauty and hiking opportunities. Attracts nature lovers and those looking for a peaceful getaway with outdoor activities. | Dzoraget River, Hiking trails, Picturesque landscapes, Camping spots, Bird watching |
| Kirovakan Neighborhood | A historic neighborhood with Soviet-era architecture, providing a glimpse into the architectural history of Armenia. Close to schools, parks, and local markets. | Kirovakan Park, Historical buildings, Local markets, Cafes, Art spaces |
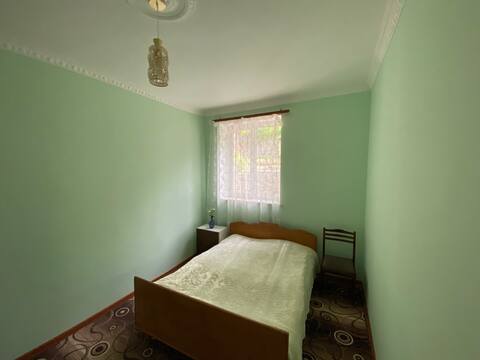
| Tseghakron | Village located just outside of Vanadzor, known for its beautiful countryside and tranquil environment. Perfect for travelers seeking a rural escape with local hospitality. | Countryside views, Traditional Armenian houses, Local farms, Peaceful environment, Cultural experiences |
| Vahagnadzor | A nearby village that offers an authentic Armenian experience, ideal for guests looking to immerse themselves in local culture and traditions. | Local churches, Wine tasting, Village festivals, Traditional cuisine, Scenic views |
| Artsakh Village | A small, charming village close to Vanadzor, known for its agricultural landscape and local craftsmanship. Great for travelers interested in rural tourism. | Agricultural activities, Craft workshops, Cultural heritage sites, Local festivals, Countryside exploration |
| Vanadzor Botanical Garden | An area surrounding the Botanical Garden that features a diverse range of plant species and peaceful walking paths, appealing to nature enthusiasts and families. | Botanical variety, Walking paths, Picnic areas, Educational tours, Nature observation |
| Tsaghkadzor Resort | A bit further but a well-known resort area for skiing and outdoor activities. Attracts tourists year-round for both winter sports and summer hiking. | Skiing in winter, Hiking in summer, Resort amenities, Cable cars, Beautiful mountain scenery |
Understanding Airbnb License Requirements & STR Laws in Vanadzor (2026)
While Vanadzor, Lori Province, Armenia currently shows low STR regulations, specific Airbnb license requirements might still exist or change. Always verify the latest short term rental regulations and Airbnb license requirements directly with local government authorities for Vanadzor to ensure full compliance before hosting.
(Source: AirROI data, 2026, finding no licensed listings among those analyzed)
Top Performing Airbnb Properties in Vanadzor (2026)
Benchmark your potential! Explore examples of top-performing Airbnb properties in Vanadzorbased on Trailing Twelve Month (TTM) revenue. Analyze their characteristics, revenue, occupancy rate, and ADR to understand what drives success in this market.

The Nest
Entire Place • 2 bedrooms

Van Resort VIP with fireplace
Entire Place • 2 bedrooms
Большой дом с прекрасным видом
Private Room • 4 bedrooms
Virev guest house
Entire Place • 1 bedroom
Две комнаты в доме с видом на горы
Private Room • 2 bedrooms
Двухместная комната в доме с видом на горы
Private Room • 1 bedroom
Note: Performance varies based on location, size, amenities, seasonality, and management quality. Data reflects the past 12 months.
Top Performing Airbnb Hosts in Vanadzor (2026)
Learn from the best! This table showcases top-performing Airbnb hosts in Vanadzor based on the number of properties managed and estimated total revenue over the past year. Analyze their scale and performance metrics.
| Host Name | Properties | Grossing Revenue | Stay Reviews | Avg Rating |
|---|---|---|---|---|
| Host #464695704 | 7 | $44,051 | 0 | 0.00/5.0 |
| Host #276363460 | 3 | $24,187 | 1 | 0.00/5.0 |
| Yana | 2 | $18,637 | 7 | 2.50/5.0 |
| Host #488299004 | 1 | $7,618 | 0 | 0.00/5.0 |
| Host #492116796 | 2 | $7,537 | 0 | 0.00/5.0 |
| Host #165112991 | 3 | $6,380 | 0 | 0.00/5.0 |
| Host #468139308 | 1 | $6,216 | 0 | 0.00/5.0 |
| Artsvi | 2 | $5,961 | 15 | 2.46/5.0 |
| Арутюн | 2 | $5,535 | 17 | 2.50/5.0 |
| Artur | 2 | $4,716 | 5 | 2.50/5.0 |
Analyzing the strategies of top hosts, such as their property selection, pricing, and guest communication, can offer valuable lessons for optimizing your own Airbnb operations in Vanadzor.
Dive Deeper: Advanced Vanadzor STR Market Data (2026)
Ready to unlock more insights? AirROI provides access to advanced metrics and comprehensive Airbnb data for Vanadzor. Explore detailed analytics beyond this report to refine your investment strategy, optimize pricing, and maximize your vacation rental profits.
Explore Advanced MetricsVanadzor Short-Term Rental Market Composition (2026): Property & Room Types
Room Type Distribution
Property Type Distribution
Market Composition Insights for Vanadzor
- The Vanadzor Airbnb market composition is heavily skewed towards Entire Home/Apt listings, which make up 54.8% of the 31 active rentals. This indicates strong guest preference for privacy and space.
- However, a notable 45.2% share for Private Rooms suggests opportunities for budget-conscious travelers or hosts renting out spare rooms.
- Looking at the property type distribution in Vanadzor, House properties are the most common (41.9%), reflecting the local real estate landscape.
- Houses represent a significant 41.9% portion, catering likely to families or larger groups.
- The presence of 19.4% Hotel/Boutique listings indicates integration with traditional hospitality.
Vanadzor Airbnb Room Capacity Analysis (2026): Bedroom Distribution
Distribution of Listings by Number of Bedrooms
Room Capacity Insights for Vanadzor
- The dominant room capacity in Vanadzor is 1 bedroom listings, making up 45.2% of the market. This suggests a strong demand for properties suitable for couples or solo travelers.
- Together, 1 bedroom and 2 bedrooms properties represent 83.9% of the active Airbnb listings in Vanadzor, indicating a high concentration in these sizes.
- Listings with 3+ bedrooms (9.7%) represent a smaller niche, potentially indicating an underserved market for larger group accommodations in Vanadzor.
Vanadzor Vacation Rental Guest Capacity Trends (2026)
Distribution of Listings by Guest Capacity
Guest Capacity Insights for Vanadzor
- The most common guest capacity trend in Vanadzor vacation rentals is listings accommodating 2 guests (29%). This suggests the primary traveler segment is likely couples or solo travelers.
- Properties designed for 2 guests and 4 guests dominate the Vanadzor STR market, accounting for 54.8% of listings.
- 22.6% of properties accommodate 6+ guests, serving the market segment for larger families or group travel in Vanadzor.
- On average, properties in Vanadzor are equipped to host 3.8 guests.
Vanadzor Airbnb Booking Patterns (2026): Available vs. Booked Days
Available Days Distribution
Booked Days Distribution
Booking Pattern Insights for Vanadzor
- The most common availability pattern in Vanadzor falls within the 271-366 days range, representing 90.3% of listings. This suggests many properties have significant open periods on their calendars.
- Approximately 100.0% of listings show high availability (181+ days open annually), indicating potential for increased bookings or specific owner usage patterns.
- For booked days, the 31-90 days range is most frequent in Vanadzor (83.9%), reflecting common guest stay durations or potential owner blocking patterns.
Vanadzor Airbnb Minimum Stay Requirements Analysis
Distribution of Listings by Minimum Night Requirement
1 Night
25 listings
86.2% of total
2 Nights
1 listings
3.4% of total
4-6 Nights
1 listings
3.4% of total
30+ Nights
2 listings
6.9% of total
Key Insights
- The most prevalent minimum stay requirement in Vanadzor is 1 Night, adopted by 86.2% of listings. This highlights the market's preference for shorter, flexible bookings.
- A strong majority (89.6%) of the Vanadzor Airbnb data shows acceptance of very short stays (1-2 nights), indicating a dynamic, high-turnover market.
Recommendations
- Align with the market by considering a 1 Night minimum stay, as 86.2% of Vanadzor hosts use this setting.
- Explore offering discounts for stays of 30+ nights to attract the 6.9% of the market seeking extended stays.
- Adjust minimum nights based on seasonality – potentially shorter during low season and longer during peak demand periods in Vanadzor.
Vanadzor Airbnb Cancellation Policy Trends Analysis (2026)
Flexible
6 listings
100% of total
Cancellation Policy Insights for Vanadzor
- The prevailing Airbnb cancellation policy trend in Vanadzor is Flexible, used by 100% of listings.
- The market strongly favors guest-friendly terms, with 100.0% of listings offering Flexible or Moderate policies. This suggests guests in Vanadzor may expect booking flexibility.
Recommendations for Hosts
- Consider adopting a Flexible policy to align with the 100% market standard in Vanadzor.
- Given the high prevalence of Flexible policies (100%), offering this can enhance booking appeal, especially during shoulder seasons.
- Regularly review your cancellation policy against competitors and market demand shifts in Vanadzor.
Vanadzor STR Booking Lead Time Analysis (2026)
Average Booking Lead Time by Month
Booking Lead Time Insights for Vanadzor
- The overall average booking lead time for vacation rentals in Vanadzor is 22 days.
- Guests book furthest in advance for stays during December (average 39 days), likely coinciding with peak travel demand or local events.
- The shortest booking windows occur for stays in June (average 3 days), indicating more last-minute travel plans during this time.
- Seasonally, Winter (26 days avg.) sees the longest lead times, while Summer (10 days avg.) has the shortest, reflecting typical travel planning cycles.
Recommendations for Hosts
- Use the overall average lead time (22 days) as a baseline for your pricing and availability strategy in Vanadzor.
- For December stays, consider implementing length-of-stay discounts or slightly higher rates for bookings made less than 39 days out to capitalize on advance planning.
- During June, focus on last-minute booking availability and promotions, as guests book with very short notice (3 days avg.).
- Target marketing efforts for the Winter season well in advance (at least 26 days) to capture early planners.
- Monitor your own booking lead times against these Vanadzor averages to identify opportunities for dynamic pricing adjustments.
Popular & Essential Airbnb Amenities in Vanadzor (2026)
Amenity Prevalence
Amenity Insights for Vanadzor
- Essential amenities in Vanadzor that guests expect include: Heating, Wifi, Hot water, Washer, Kitchen, Essentials, TV. Lacking these (any) could significantly impact bookings.
- Popular amenities like Free parking on premises, Carbon monoxide alarm, Smoke alarm are common but not universal. Offering these can provide a competitive edge.
Recommendations for Hosts
- Ensure your listing includes all essential amenities for Vanadzor: Heating, Wifi, Hot water, Washer, Kitchen, Essentials, TV.
- Prioritize adding missing essentials: Washer, Kitchen, Essentials, TV.
- Consider adding popular differentiators like Free parking on premises or Carbon monoxide alarm to increase appeal.
- Highlight unique or less common amenities you offer (e.g., hot tub, dedicated workspace, EV charger) in your listing description and photos.
- Regularly check competitor amenities in Vanadzor to stay competitive.
Vanadzor Airbnb Guest Demographics & Profile Analysis (2026)
Guest Profile Summary for Vanadzor
- The typical guest profile for Airbnb in Vanadzor consists of predominantly international visitors (78%), with top international origins including Netherlands, typically belonging to the Post-2000s (Gen Z/Alpha) group (50%), primarily speaking English or German.
- Domestic travelers account for 22.2% of guests.
- Key international markets include Armenia (22.2%) and Netherlands (11.1%).
- Top languages spoken are English (35.1%) followed by German (13.5%).
- A significant demographic segment is the Post-2000s (Gen Z/Alpha) group, representing 50% of guests.
Recommendations for Hosts
- Focus marketing internationally, particularly towards travelers from Netherlands.
- Tailor amenities and listing descriptions to appeal to the dominant Post-2000s (Gen Z/Alpha) demographic (e.g., highlight fast WiFi, smart home features, local guides).
- Highlight unique local experiences or amenities relevant to the primary guest profile.
- Consider seasonal promotions aligned with peak travel times for key origin markets.
Nearby Short-Term Rental Market Comparison
How does the Vanadzor Airbnb market stack up against its neighbors? Compare key performance metrics like average monthly revenue, ADR, and occupancy rates in surrounding areas to understand the broader regional STR landscape.