Bondi Airbnb Market Analysis 2026: Short Term Rental Data & Vacation Rental Statistics in New South Wales, Australia
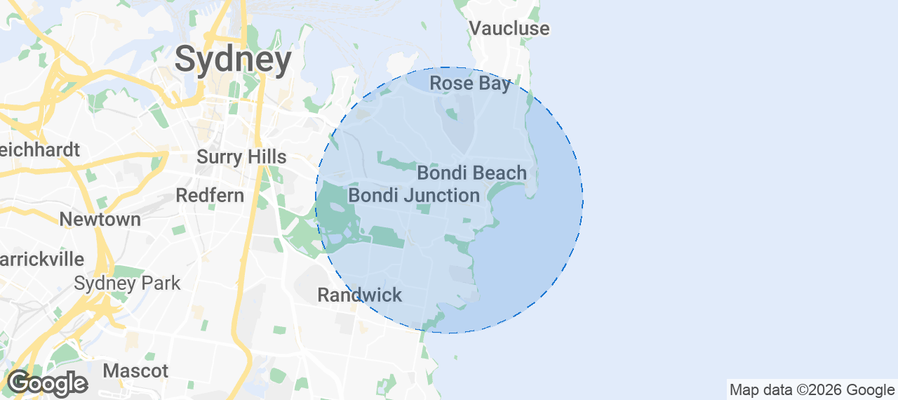
Is Airbnb profitable in Bondi in 2026? Explore comprehensive Airbnb analytics for Bondi, New South Wales, Australia to uncover income potential. This 2026 STR market report for Bondi, based on AirROI data from February 2025 to January 2026, reveals key trends in the niche market of 18 active listings.
Whether you're considering an Airbnb investment in Bondi, optimizing your existing vacation rental, or exploring rental arbitrage opportunities, understanding the Bondi Airbnb data is crucial. Navigating the high regulation landscape is key to maximizing your short term rental income potential. Let's dive into the specifics.
Key Bondi Airbnb Performance Metrics Overview
Monthly Airbnb Revenue Variations & Income Potential in Bondi (2026)
Understanding the monthly revenue variations for Airbnb listings in Bondi is key to maximizing your short term rental income potential. Seasonality significantly impacts earnings. Our analysis, based on data from the past 12 months, shows that the peak revenue month for STRs in Bondi is typically December, while May often presents the lowest earnings, highlighting opportunities for strategic pricing adjustments during shoulder and low seasons. Explore the typical Airbnb income in Bondi across different performance tiers:
- Best-in-class properties (Top 10%) achieve $6,892+ monthly, often utilizing dynamic pricing and superior guest experiences.
- Strong performing properties (Top 25%) earn $5,593 or more, indicating effective management and desirable locations/amenities.
- Typical properties (Median) generate around $3,408 per month, representing the average market performance.
- Entry-level properties (Bottom 25%) see earnings around $2,166, often with potential for optimization.
Average Monthly Airbnb Earnings Trend in Bondi
Bondi Airbnb Occupancy Rate Trends (2026)
Maximize your bookings by understanding the Bondi STR occupancy trends. Seasonal demand shifts significantly influence how often properties are booked. Typically, Novembersees the highest demand (peak season occupancy), while May experiences the lowest (low season). Effective strategies, like adjusting minimum stays or offering promotions, can boost occupancy during slower periods. Here's how different property tiers perform in Bondi:
- Best-in-class properties (Top 10%) achieve 77%+ occupancy, indicating high desirability and potentially optimized availability.
- Strong performing properties (Top 25%) maintain 69% or higher occupancy, suggesting good market fit and guest satisfaction.
- Typical properties (Median) have an occupancy rate around 51%.
- Entry-level properties (Bottom 25%) average 30% occupancy, potentially facing higher vacancy.
Average Monthly Occupancy Rate Trend in Bondi
Average Daily Rate (ADR) Airbnb Trends in Bondi (2026)
Effective short term rental pricing strategy in Bondi involves understanding monthly ADR fluctuations. The Average Daily Rate (ADR) for Airbnb in Bondi typically peaks in December and dips lowest during August. Leveraging Airbnb dynamic pricing tools or strategies based on this seasonality can significantly boost revenue. Here's a look at the typical nightly rates achieved:
- Best-in-class properties (Top 10%) command rates of $405+ per night, often due to premium features or locations.
- Strong performing properties (Top 25%) achieve nightly rates of $288 or more.
- Typical properties (Median) charge around $212 per night.
- Entry-level properties (Bottom 25%) earn around $161 per night.
Average Daily Rate (ADR) Trend by Month in Bondi
Get Live Bondi Market Intelligence 👇
Explore Real-time Analytics
Airbnb Seasonality Analysis & Trends in Bondi (2026)
Peak Season (December, January, November)
- Revenue averages $5,784 per month
- Occupancy rates average 59.3%
- Daily rates average $332
Shoulder Season
- Revenue averages $2,997 per month
- Occupancy maintains around 44.9%
- Daily rates hold near $223
Low Season (February, March, April)
- Revenue drops to average $0 per month
- Occupancy decreases to average 0.0%
- Daily rates adjust to average $206
Seasonality Insights for Bondi
- The Airbnb seasonality in Bondi shows highly seasonal trends requiring careful strategy. While the sections above show seasonal averages, it's also insightful to look at the extremes:
- During the high season, the absolute peak month showcases Bondi's highest earning potential, with monthly revenues capable of climbing to $6,042, occupancy reaching a high of 61.4%, and ADRs peaking at $345.
- Conversely, the slowest single month of the year, typically falling within the low season, marks the market's lowest point. In this month, revenue might dip to $0, occupancy could drop to 0.0%, and ADRs may adjust down to $193.
- Understanding both the seasonal averages and these monthly peaks and troughs in revenue, occupancy, and ADR is crucial for maximizing your Airbnb profit potential in Bondi.
Seasonal Strategies for Maximizing Profit
- Peak Season: Maximize revenue through premium pricing and potentially longer minimum stays. Ensure high availability.
- Low Season: Offer competitive pricing, special promotions (e.g., extended stay discounts), and flexible cancellation policies. Target off-season travelers like remote workers or budget-conscious guests.
- Shoulder Seasons: Implement dynamic pricing that balances peak and low rates. Target weekend travelers or specific events. Offer slightly more flexible terms than peak season.
- Regularly analyze your own performance against these Bondi seasonality benchmarks and adjust your pricing and availability strategy accordingly.
Best Areas for Airbnb Investment in Bondi (2026)
Exploring the top neighborhoods for short-term rentals in Bondi? This section highlights key areas, outlining why they are attractive for hosts and guests, along with notable local attractions. Consider these locations based on your target guest profile and investment strategy.
| Neighborhood / Area | Why Host Here? (Target Guests & Appeal) | Key Attractions & Landmarks |
|---|---|---|
| Bondi Beach | World-famous beach renowned for its golden sand, surf culture, and vibrant atmosphere. Attracts tourists year-round looking to experience the Australian beach lifestyle. | Bondi to Coogee Coastal Walk, Bondi Icebergs Club, Bondi Markets, Bondi Beach Pavilion, Tamarama Beach |
| North Bondi | Quieter than Bondi Beach, yet still close to great surf and cafes, perfect for families and travelers looking for a more relaxed beach experience. | North Bondi Surf Life Saving Club, Biddigal Reserve, North Bondi Park, Bondi Road eateries, Bistro Bondi |
| Bondi Junction | A major commercial and transport hub providing access to Bondi's attractions while having its own shopping and dining options. Great for business and leisure travelers alike. | Westfield Bondi Junction, Bondi Junction Train Station, The Bondi Hotel, Oxford Street shops, Bondi Junction Farmers Market |
| South Bondi | Offers a more laid-back atmosphere with access to both beach and parks, ideal for those looking for local experiences in a nicer neighborhood. | South Bondi Beach, Mackenzies Bay, Bondi Surf Bathers' Life Saving Club, Local cafes, Bondi Golf Club |
| Ben Buckler | Known for its stunning views of the ocean and unique access to the quieter beaches and coastal walks. Attracts visitors looking for picturesque scenery away from the crowds. | Ben Buckler Point, Bondi Seaside Market, Coastal walks, Tamarama Marine Park |
| Bronte | Located just south of Bondi, Bronte is famous for its beautiful natural park and beach, attracting families and surfers alike. Ideal for those seeking a mix of leisure and lifestyle. | Bronte Park, Bronte Beach, Bronte Gully, Walking trails, Restaurants and cafes |
| Clovelly | Just a short drive from Bondi, Clovelly features a beautiful beach and a natural swimming pool, ideal for families and those who enjoy calm waters. | Clovelly Beach, Clovelly Hotel, Coastal walk to Bondi, Natural swimming pool, Picnic spots |
| Rose Bay | Offering stunning harbor views and proximity to Bondi, Rose Bay has a scenic waterfront and is ideal for those wanting a blend of beach and boating lifestyles. | Rose Bay Beach, Ferrys to Sydney Harbour Islands, Rose Bay promenade, Local cafes, Recreational sailing |
Understanding Airbnb License Requirements & STR Laws in Bondi (2026)
Yes, Bondi, New South Wales, Australia enforces high STR regulations. Obtaining a license and ensuring compliance is almost certainly required according to current 2026 STR laws. Always verify the latest short term rental regulations and Airbnb license requirements directly with local government authorities for Bondi to ensure full compliance before hosting.
(Source: AirROI data, 2026, based on 100% licensed listings)
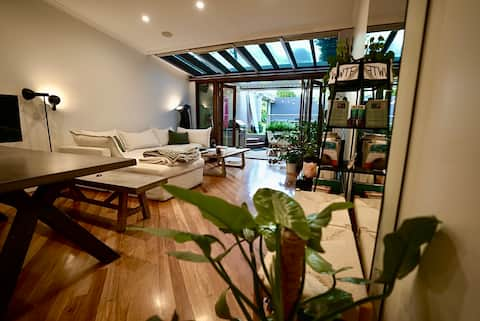
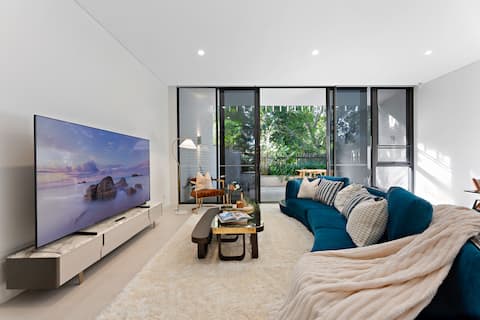
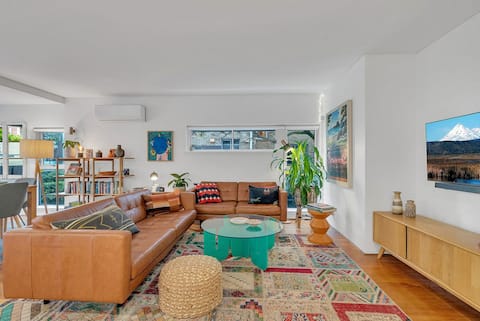
Top Performing Airbnb Properties in Bondi (2026)
Benchmark your potential! Explore examples of top-performing Airbnb properties in Bondibased on Trailing Twelve Month (TTM) revenue. Analyze their characteristics, revenue, occupancy rate, and ADR to understand what drives success in this market.
Luxury Beach Retreat w/ Hot Tub
Entire Place • 2 bedrooms
Sunny 3BR North Bondi Escape, 19min Walk to Beach
Entire Place • 3 bedrooms
Bondi Salt
Entire Place • 2 bedrooms
Cozy 2Br - Big Views w Balcony
Entire Place • 2 bedrooms
Bright & Spacious 2 BDR w/ Pool Parking Balcony AC
Entire Place • 2 bedrooms

Sunshine Terrace, Bondi Beach ISYD
Entire Place • 3 bedrooms
Note: Performance varies based on location, size, amenities, seasonality, and management quality. Data reflects the past 12 months.
Top Performing Airbnb Hosts in Bondi (2026)
Learn from the best! This table showcases top-performing Airbnb hosts in Bondi based on the number of properties managed and estimated total revenue over the past year. Analyze their scale and performance metrics.
| Host Name | Properties | Grossing Revenue | Stay Reviews | Avg Rating |
|---|---|---|---|---|
| L'Abode Accommodation Speciali | 3 | $92,302 | 14 | 4.50/5.0 |
| Meidy | 2 | $62,872 | 30 | 4.93/5.0 |
| Jared | 1 | $59,529 | 15 | 5.00/5.0 |
| Richard | 1 | $58,895 | 22 | 4.82/5.0 |
| Rick | 2 | $52,782 | 19 | 4.78/5.0 |
| Sky | 1 | $27,975 | 18 | 4.44/5.0 |
| Greg | 1 | $25,071 | 18 | 4.89/5.0 |
| Serra | 1 | $23,777 | 3 | 5.00/5.0 |
| Raquel | 1 | $22,910 | 5 | 4.80/5.0 |
| Rachel | 2 | $19,809 | 31 | 3.98/5.0 |
Analyzing the strategies of top hosts, such as their property selection, pricing, and guest communication, can offer valuable lessons for optimizing your own Airbnb operations in Bondi.
Dive Deeper: Advanced Bondi STR Market Data (2026)
Ready to unlock more insights? AirROI provides access to advanced metrics and comprehensive Airbnb data for Bondi. Explore detailed analytics beyond this report to refine your investment strategy, optimize pricing, and maximize your vacation rental profits.
Explore Advanced MetricsBondi Short-Term Rental Market Composition (2026): Property & Room Types
Room Type Distribution
Property Type Distribution
Market Composition Insights for Bondi
- The Bondi Airbnb market composition is heavily skewed towards Entire Home/Apt listings, which make up 100% of the 18 active rentals. This indicates strong guest preference for privacy and space.
- Looking at the property type distribution in Bondi, Apartment/Condo properties are the most common (88.9%), reflecting the local real estate landscape.
Bondi Airbnb Room Capacity Analysis (2026): Bedroom Distribution
Distribution of Listings by Number of Bedrooms
Room Capacity Insights for Bondi
- The dominant room capacity in Bondi is 1 bedroom listings, making up 33.3% of the market. This suggests a strong demand for properties suitable for couples or solo travelers.
- Together, 1 bedroom and 2 bedrooms properties represent 61.1% of the active Airbnb listings in Bondi, indicating a high concentration in these sizes.
- A significant 27.8% of listings offer 3+ bedrooms, catering to larger groups and families seeking more space in Bondi.
Bondi Vacation Rental Guest Capacity Trends (2026)
Distribution of Listings by Guest Capacity
Guest Capacity Insights for Bondi
- The most common guest capacity trend in Bondi vacation rentals is listings accommodating 2 guests (27.8%). This suggests the primary traveler segment is likely couples or solo travelers.
- Properties designed for 2 guests and 4 guests dominate the Bondi STR market, accounting for 55.6% of listings.
- 27.8% of properties accommodate 6+ guests, serving the market segment for larger families or group travel in Bondi.
- On average, properties in Bondi are equipped to host 4.2 guests.
Bondi Airbnb Booking Patterns (2026): Available vs. Booked Days
Available Days Distribution
Booked Days Distribution
Booking Pattern Insights for Bondi
- The most common availability pattern in Bondi falls within the 271-366 days range, representing 55.6% of listings. This suggests many properties have significant open periods on their calendars.
- Approximately 88.9% of listings show high availability (181+ days open annually), indicating potential for increased bookings or specific owner usage patterns.
- For booked days, the 31-90 days range is most frequent in Bondi (50%), reflecting common guest stay durations or potential owner blocking patterns.
- A notable 11.1% of properties secure long booking periods (181+ days booked per year), highlighting successful long-term rental strategies or significant owner usage.
Bondi Airbnb Minimum Stay Requirements Analysis
Distribution of Listings by Minimum Night Requirement
2 Nights
3 listings
16.7% of total
3 Nights
2 listings
11.1% of total
7-29 Nights
4 listings
22.2% of total
30+ Nights
9 listings
50% of total
Key Insights
- The most prevalent minimum stay requirement in Bondi is 30+ Nights, adopted by 50% of listings. This highlights the market's preference for longer commitments.
- Very short stays (1-2 nights) are less common (16.7%), suggesting hosts prefer slightly longer bookings to optimize turnover.
- A significant segment (50%) caters to monthly stays (30+ nights) in Bondi, pointing to opportunities in the extended-stay market.
Recommendations
- Align with the market by considering a 30+ Nights minimum stay, as 50% of Bondi hosts use this setting.
- Explore offering discounts for stays of 30+ nights to attract the 50% of the market seeking extended stays.
- Adjust minimum nights based on seasonality – potentially shorter during low season and longer during peak demand periods in Bondi.
Bondi Airbnb Cancellation Policy Trends Analysis (2026)
Super Strict 60 Days
1 listings
5.6% of total
Super Strict 30 Days
3 listings
16.7% of total
Flexible
1 listings
5.6% of total
Moderate
3 listings
16.7% of total
Firm
6 listings
33.3% of total
Strict
4 listings
22.2% of total
Cancellation Policy Insights for Bondi
- The prevailing Airbnb cancellation policy trend in Bondi is Firm, used by 33.3% of listings.
- A majority (55.5%) of hosts in Bondi utilize Firm or Strict policies, indicating a market where hosts prioritize booking security.
Recommendations for Hosts
- Consider adopting a Firm policy to align with the 33.3% market standard in Bondi.
- Regularly review your cancellation policy against competitors and market demand shifts in Bondi.
Bondi STR Booking Lead Time Analysis (2026)
Average Booking Lead Time by Month
Booking Lead Time Insights for Bondi
- The overall average booking lead time for vacation rentals in Bondi is 40 days.
- Guests book furthest in advance for stays during October (average 58 days), likely coinciding with peak travel demand or local events.
- The shortest booking windows occur for stays in April (average 0 days), indicating more last-minute travel plans during this time.
- Seasonally, Fall (46 days avg.) sees the longest lead times, while Spring (0 days avg.) has the shortest, reflecting typical travel planning cycles.
Recommendations for Hosts
- Use the overall average lead time (40 days) as a baseline for your pricing and availability strategy in Bondi.
- For October stays, consider implementing length-of-stay discounts or slightly higher rates for bookings made less than 58 days out to capitalize on advance planning.
- During April, focus on last-minute booking availability and promotions, as guests book with very short notice (0 days avg.).
- Target marketing efforts for the Fall season well in advance (at least 46 days) to capture early planners.
- Monitor your own booking lead times against these Bondi averages to identify opportunities for dynamic pricing adjustments.
Popular & Essential Airbnb Amenities in Bondi (2026)
Amenity Prevalence
Amenity Insights for Bondi
- Essential amenities in Bondi that guests expect include: Kitchen, Hot water, Wifi. Lacking these (any) could significantly impact bookings.
- Popular amenities like Bed linens, Dishes and silverware, Refrigerator are common but not universal. Offering these can provide a competitive edge.
Recommendations for Hosts
- Ensure your listing includes all essential amenities for Bondi: Kitchen, Hot water, Wifi.
- Consider adding popular differentiators like Bed linens or Dishes and silverware to increase appeal.
- Highlight unique or less common amenities you offer (e.g., hot tub, dedicated workspace, EV charger) in your listing description and photos.
- Regularly check competitor amenities in Bondi to stay competitive.
Bondi Airbnb Guest Demographics & Profile Analysis (2026)
Guest Profile Summary for Bondi
- The typical guest profile for Airbnb in Bondi consists of a mix of domestic (52%) and international guests, often arriving from nearby Melbourne, typically belonging to the Post-2000s (Gen Z/Alpha) group (50%), primarily speaking English or Spanish.
- Domestic travelers account for 51.6% of guests.
- Key international markets include Australia (51.6%) and United Kingdom (15.4%).
- Top languages spoken are English (67.3%) followed by Spanish (7.7%).
- A significant demographic segment is the Post-2000s (Gen Z/Alpha) group, representing 50% of guests.
Recommendations for Hosts
- Balance marketing efforts between domestic and international channels based on the guest mix.
- Tailor amenities and listing descriptions to appeal to the dominant Post-2000s (Gen Z/Alpha) demographic (e.g., highlight fast WiFi, smart home features, local guides).
- Highlight unique local experiences or amenities relevant to the primary guest profile.
- Consider seasonal promotions aligned with peak travel times for key origin markets.
Nearby Short-Term Rental Market Comparison
How does the Bondi Airbnb market stack up against its neighbors? Compare key performance metrics like average monthly revenue, ADR, and occupancy rates in surrounding areas to understand the broader regional STR landscape.
| Market | Active Properties | Monthly Revenue | Daily Rate | Avg. Occupancy |
|---|---|---|---|---|
| Berry | 118 | $5,709 | $559.76 | 40% |
| Dawes Point | 10 | $5,632 | $415.45 | 62% |
| Millers Point | 16 | $5,345 | $388.13 | 62% |
| Burrawang | 12 | $5,242 | $557.61 | 38% |
| Penrose | 13 | $5,227 | $681.36 | 40% |
| Nulkaba | 41 | $4,609 | $574.24 | 31% |
| Exeter | 34 | $4,551 | $515.98 | 41% |
| Jaspers Brush | 15 | $4,452 | $445.36 | 34% |
| The Council of the Municipality of Kiama | 109 | $4,372 | $437.99 | 42% |
| Robertson | 46 | $4,320 | $396.04 | 39% |