City of Lake Macquarie Airbnb Market Analysis 2026: Short Term Rental Data & Vacation Rental Statistics in New South Wales, Australia
Is Airbnb profitable in City of Lake Macquarie in 2026? Explore comprehensive Airbnb analytics for City of Lake Macquarie, New South Wales, Australia to uncover income potential. This 2026 STR market report for City of Lake Macquarie, based on AirROI data from February 2025 to January 2026, reveals key trends in the niche market of 57 active listings.
Whether you're considering an Airbnb investment in City of Lake Macquarie, optimizing your existing vacation rental, or exploring rental arbitrage opportunities, understanding the City of Lake Macquarie Airbnb data is crucial. Navigating the high regulation landscape is key to maximizing your short term rental income potential. Let's dive into the specifics.
Key City of Lake Macquarie Airbnb Performance Metrics Overview
Monthly Airbnb Revenue Variations & Income Potential in City of Lake Macquarie (2026)
Understanding the monthly revenue variations for Airbnb listings in City of Lake Macquarie is key to maximizing your short term rental income potential. Seasonality significantly impacts earnings. Our analysis, based on data from the past 12 months, shows that the peak revenue month for STRs in City of Lake Macquarie is typically April, while August often presents the lowest earnings, highlighting opportunities for strategic pricing adjustments during shoulder and low seasons. Explore the typical Airbnb income in City of Lake Macquarie across different performance tiers:
- Best-in-class properties (Top 10%) achieve $7,134+ monthly, often utilizing dynamic pricing and superior guest experiences.
- Strong performing properties (Top 25%) earn $4,342 or more, indicating effective management and desirable locations/amenities.
- Typical properties (Median) generate around $2,757 per month, representing the average market performance.
- Entry-level properties (Bottom 25%) see earnings around $1,450, often with potential for optimization.
Average Monthly Airbnb Earnings Trend in City of Lake Macquarie
City of Lake Macquarie Airbnb Occupancy Rate Trends (2026)
Maximize your bookings by understanding the City of Lake Macquarie STR occupancy trends. Seasonal demand shifts significantly influence how often properties are booked. Typically, Aprilsees the highest demand (peak season occupancy), while August experiences the lowest (low season). Effective strategies, like adjusting minimum stays or offering promotions, can boost occupancy during slower periods. Here's how different property tiers perform in City of Lake Macquarie:
- Best-in-class properties (Top 10%) achieve 64%+ occupancy, indicating high desirability and potentially optimized availability.
- Strong performing properties (Top 25%) maintain 44% or higher occupancy, suggesting good market fit and guest satisfaction.
- Typical properties (Median) have an occupancy rate around 27%.
- Entry-level properties (Bottom 25%) average 15% occupancy, potentially facing higher vacancy.
Average Monthly Occupancy Rate Trend in City of Lake Macquarie
Average Daily Rate (ADR) Airbnb Trends in City of Lake Macquarie (2026)
Effective short term rental pricing strategy in City of Lake Macquarie involves understanding monthly ADR fluctuations. The Average Daily Rate (ADR) for Airbnb in City of Lake Macquarie typically peaks in December and dips lowest during August. Leveraging Airbnb dynamic pricing tools or strategies based on this seasonality can significantly boost revenue. Here's a look at the typical nightly rates achieved:
- Best-in-class properties (Top 10%) command rates of $577+ per night, often due to premium features or locations.
- Strong performing properties (Top 25%) achieve nightly rates of $464 or more.
- Typical properties (Median) charge around $353 per night.
- Entry-level properties (Bottom 25%) earn around $290 per night.
Average Daily Rate (ADR) Trend by Month in City of Lake Macquarie
Get Live City of Lake Macquarie Market Intelligence 👇
Explore Real-time Analytics
Airbnb Seasonality Analysis & Trends in City of Lake Macquarie (2026)
Peak Season (April, January, December)
- Revenue averages $4,641 per month
- Occupancy rates average 35.7%
- Daily rates average $445
Shoulder Season
- Revenue averages $3,369 per month
- Occupancy maintains around 32.2%
- Daily rates hold near $384
Low Season (May, June, August)
- Revenue drops to average $2,538 per month
- Occupancy decreases to average 25.7%
- Daily rates adjust to average $369
Seasonality Insights for City of Lake Macquarie
- The Airbnb seasonality in City of Lake Macquarie shows highly seasonal trends requiring careful strategy. While the sections above show seasonal averages, it's also insightful to look at the extremes:
- During the high season, the absolute peak month showcases City of Lake Macquarie's highest earning potential, with monthly revenues capable of climbing to $5,290, occupancy reaching a high of 38.7%, and ADRs peaking at $456.
- Conversely, the slowest single month of the year, typically falling within the low season, marks the market's lowest point. In this month, revenue might dip to $2,261, occupancy could drop to 23.9%, and ADRs may adjust down to $359.
- Understanding both the seasonal averages and these monthly peaks and troughs in revenue, occupancy, and ADR is crucial for maximizing your Airbnb profit potential in City of Lake Macquarie.
Seasonal Strategies for Maximizing Profit
- Peak Season: Maximize revenue through premium pricing and potentially longer minimum stays. Ensure high availability.
- Low Season: Offer competitive pricing, special promotions (e.g., extended stay discounts), and flexible cancellation policies. Target off-season travelers like remote workers or budget-conscious guests.
- Shoulder Seasons: Implement dynamic pricing that balances peak and low rates. Target weekend travelers or specific events. Offer slightly more flexible terms than peak season.
- Regularly analyze your own performance against these City of Lake Macquarie seasonality benchmarks and adjust your pricing and availability strategy accordingly.
Best Areas for Airbnb Investment in City of Lake Macquarie (2026)
Exploring the top neighborhoods for short-term rentals in City of Lake Macquarie? This section highlights key areas, outlining why they are attractive for hosts and guests, along with notable local attractions. Consider these locations based on your target guest profile and investment strategy.
| Neighborhood / Area | Why Host Here? (Target Guests & Appeal) | Key Attractions & Landmarks |
|---|---|---|
| Catherine Hill Bay | A picturesque coastal village known for its beautiful beaches and heritage-listed coal mine ruins. It attracts visitors looking for a serene beach getaway and offers stunning views and water activities. | Catherine Hill Bay Beach, The Old Catherine Hill Bay Pub, Shingle Splitters Point, Whale Watching Tours, Historic Coal Loader |
| Spear Point | A stunning natural area with hiking trails and views over the ocean, great for outdoor enthusiasts. Ideal for guests who want to explore nature and enjoy a tranquil environment. | Spear Point Lookout, Hiking Trails, Fishing Spots, Scenic Coastal Walks, Surf Beaches |
| Toronto | A charming town located by the waterfront of Lake Macquarie. It appeals to families and travelers looking for a relaxing lakeside experience with cafes and local shops. | Toronto Foreshore, Vikings Park, Toronto Town Centre, Lake Macquarie Scenic Drives, Cafes and Restaurants |
| Morrisset | Close to Lake Macquarie and Hunter Valley, providing a gateway for wine tours and outdoor activities, attracting visitors interested in both nature and local wine experiences. | Morisset Park, Lake Macquarie, Hunter Valley vineyards, Nature Reserves, Cycling Paths |
| Charlestown | As one of the major commercial hubs of the area, Charlestown attracts shoppers and families, making it a good location for Airbnb targeting both leisure and business travelers. | Charlestown Square, Local Parks, Movie Theatres, Proximity to Newcastle, Shopping and Dining |
| Booragul | A beautiful suburb located right on the lake, perfect for tourists looking to engage with water sports and local parks, and it offers a picturesque setting for relaxation. | Booragul Foreshore, National Parks, Water Sports Activities, Fishing Spots, Picnic Areas |
| Warners Bay | Known for its vibrant dining scene along the lakeside and walking paths, it is great for both locals and visitors looking for leisure activities and community events. | Warners Bay Esplanade, Dining and Cafes, Waterfront Activities, Bike Paths, Fitness Areas |
| Belmont | A popular beach suburb that offers lovely beaches and local attractions, perfect for families and groups looking for a traditional beach holiday experience. | Belmont Beach, Lake Macquarie Yacht Club, Local Markets, Belmont Wetlands State Park, Surfing and Swimming Spots |
Understanding Airbnb License Requirements & STR Laws in City of Lake Macquarie (2026)
Yes, City of Lake Macquarie, New South Wales, Australia enforces high STR regulations. Obtaining a license and ensuring compliance is almost certainly required according to current 2026 STR laws. Always verify the latest short term rental regulations and Airbnb license requirements directly with local government authorities for City of Lake Macquarie to ensure full compliance before hosting.
(Source: AirROI data, 2026, based on 86% licensed listings)
Top Performing Airbnb Properties in City of Lake Macquarie (2026)
Benchmark your potential! Explore examples of top-performing Airbnb properties in City of Lake Macquariebased on Trailing Twelve Month (TTM) revenue. Analyze their characteristics, revenue, occupancy rate, and ADR to understand what drives success in this market.
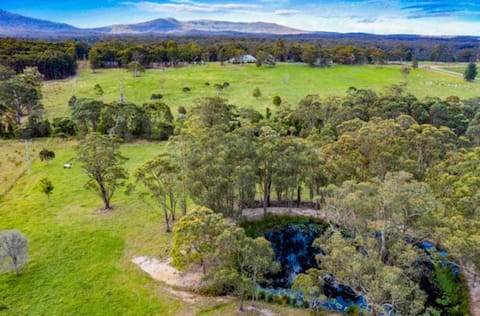
Cooranbong Rural Farm Creekside
Entire Place • 11 bedrooms

Shoreline Luxe—Refined Beachside Elegance with Spa
Entire Place • 5 bedrooms
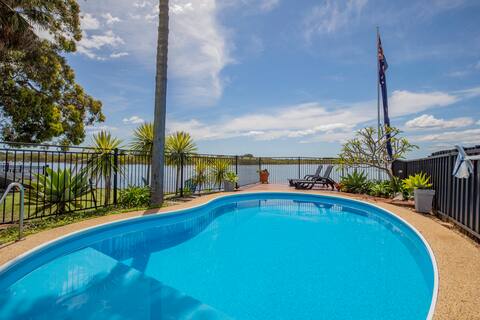
Ludford Lakefront & Beachside Retreat for Groups
Entire Place • 5 bedrooms
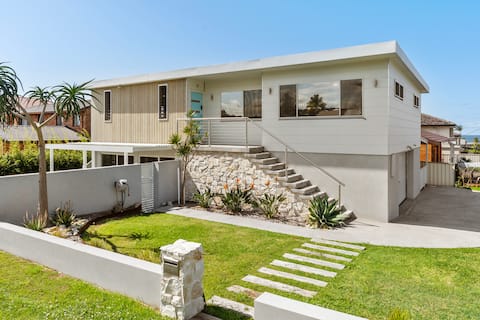
Pacific Breeze
Entire Place • 5 bedrooms

Oceanfront Villa: 6BR Beach Home - Waterfront
Entire Place • 6 bedrooms

Aurora Grove—A Familly Retreat at Caves Beach
Entire Place • 3 bedrooms
Note: Performance varies based on location, size, amenities, seasonality, and management quality. Data reflects the past 12 months.
Top Performing Airbnb Hosts in City of Lake Macquarie (2026)
Learn from the best! This table showcases top-performing Airbnb hosts in City of Lake Macquarie based on the number of properties managed and estimated total revenue over the past year. Analyze their scale and performance metrics.
| Host Name | Properties | Grossing Revenue | Stay Reviews | Avg Rating |
|---|---|---|---|---|
| Weekenda Holidays | 24 | $614,839 | 66 | 4.62/5.0 |
| Lisa | 3 | $272,131 | 115 | 4.79/5.0 |
| Charlotte | 2 | $124,693 | 3 | Not Rated |
| Lakeshores Accommodation | 4 | $102,651 | 18 | 4.62/5.0 |
| Jeff | 1 | $78,709 | 45 | 4.82/5.0 |
| James | 1 | $69,048 | 17 | 5.00/5.0 |
| AirKeeper | 2 | $67,784 | 28 | 4.26/5.0 |
| Christie | 1 | $52,804 | 5 | 5.00/5.0 |
| Yang | 1 | $43,298 | 32 | 4.94/5.0 |
| Edward | 1 | $42,971 | 22 | 5.00/5.0 |
Analyzing the strategies of top hosts, such as their property selection, pricing, and guest communication, can offer valuable lessons for optimizing your own Airbnb operations in City of Lake Macquarie.
Dive Deeper: Advanced City of Lake Macquarie STR Market Data (2026)
Ready to unlock more insights? AirROI provides access to advanced metrics and comprehensive Airbnb data for City of Lake Macquarie. Explore detailed analytics beyond this report to refine your investment strategy, optimize pricing, and maximize your vacation rental profits.
Explore Advanced MetricsCity of Lake Macquarie Short-Term Rental Market Composition (2026): Property & Room Types
Room Type Distribution
Property Type Distribution
Market Composition Insights for City of Lake Macquarie
- The City of Lake Macquarie Airbnb market composition is heavily skewed towards Entire Home/Apt listings, which make up 98.2% of the 57 active rentals. This indicates strong guest preference for privacy and space.
- Looking at the property type distribution in City of Lake Macquarie, House properties are the most common (87.7%), reflecting the local real estate landscape.
- Houses represent a significant 87.7% portion, catering likely to families or larger groups.
- Smaller segments like others (combined 1.8%) offer potential for unique stay experiences.
City of Lake Macquarie Airbnb Room Capacity Analysis (2026): Bedroom Distribution
Distribution of Listings by Number of Bedrooms
Room Capacity Insights for City of Lake Macquarie
- The dominant room capacity in City of Lake Macquarie is 2 bedrooms listings, making up 42.1% of the market. This suggests a strong demand for properties suitable for couples or solo travelers.
- Together, 2 bedrooms and 3 bedrooms properties represent 61.4% of the active Airbnb listings in City of Lake Macquarie, indicating a high concentration in these sizes.
- A significant 49.1% of listings offer 3+ bedrooms, catering to larger groups and families seeking more space in City of Lake Macquarie.
City of Lake Macquarie Vacation Rental Guest Capacity Trends (2026)
Distribution of Listings by Guest Capacity
Guest Capacity Insights for City of Lake Macquarie
- The most common guest capacity trend in City of Lake Macquarie vacation rentals is listings accommodating 8+ guests (45.6%). This suggests the primary traveler segment is likely larger groups.
- Properties designed for 8+ guests and 6 guests dominate the City of Lake Macquarie STR market, accounting for 68.4% of listings.
- 71.9% of properties accommodate 6+ guests, serving the market segment for larger families or group travel in City of Lake Macquarie.
- On average, properties in City of Lake Macquarie are equipped to host 6.3 guests.
City of Lake Macquarie Airbnb Booking Patterns (2026): Available vs. Booked Days
Available Days Distribution
Booked Days Distribution
Booking Pattern Insights for City of Lake Macquarie
- The most common availability pattern in City of Lake Macquarie falls within the 271-366 days range, representing 63.2% of listings. This suggests many properties have significant open periods on their calendars.
- Approximately 93.0% of listings show high availability (181+ days open annually), indicating potential for increased bookings or specific owner usage patterns.
- For booked days, the 31-90 days range is most frequent in City of Lake Macquarie (47.4%), reflecting common guest stay durations or potential owner blocking patterns.
- A notable 7.0% of properties secure long booking periods (181+ days booked per year), highlighting successful long-term rental strategies or significant owner usage.
City of Lake Macquarie Airbnb Minimum Stay Requirements Analysis
Distribution of Listings by Minimum Night Requirement
1 Night
1 listings
1.8% of total
2 Nights
34 listings
59.6% of total
4-6 Nights
1 listings
1.8% of total
7-29 Nights
2 listings
3.5% of total
30+ Nights
19 listings
33.3% of total
Key Insights
- The most prevalent minimum stay requirement in City of Lake Macquarie is 2 Nights, adopted by 59.6% of listings. This highlights the market's preference for shorter, flexible bookings.
- A strong majority (61.4%) of the City of Lake Macquarie Airbnb data shows acceptance of very short stays (1-2 nights), indicating a dynamic, high-turnover market.
- A significant segment (33.3%) caters to monthly stays (30+ nights) in City of Lake Macquarie, pointing to opportunities in the extended-stay market.
Recommendations
- Align with the market by considering a 2 Nights minimum stay, as 59.6% of City of Lake Macquarie hosts use this setting.
- If feasible, allowing 1-night stays, especially midweek or during low season, could capture last-minute bookings, as only 1.8% currently do.
- A 2-night minimum appears standard (59.6%). Consider this for weekends or peak periods.
- Explore offering discounts for stays of 30+ nights to attract the 33.3% of the market seeking extended stays.
- Adjust minimum nights based on seasonality – potentially shorter during low season and longer during peak demand periods in City of Lake Macquarie.
City of Lake Macquarie Airbnb Cancellation Policy Trends Analysis (2026)
Super Strict 30 Days
26 listings
45.6% of total
Flexible
6 listings
10.5% of total
Moderate
12 listings
21.1% of total
Firm
13 listings
22.8% of total
Cancellation Policy Insights for City of Lake Macquarie
- The prevailing Airbnb cancellation policy trend in City of Lake Macquarie is Super Strict 30 Days, used by 45.6% of listings.
- There's a relatively balanced mix between guest-friendly (31.6%) and stricter (22.8%) policies, offering choices for different guest needs.
Recommendations for Hosts
- Consider adopting a Super Strict 30 Days policy to align with the 45.6% market standard in City of Lake Macquarie.
- Regularly review your cancellation policy against competitors and market demand shifts in City of Lake Macquarie.
City of Lake Macquarie STR Booking Lead Time Analysis (2026)
Average Booking Lead Time by Month
Booking Lead Time Insights for City of Lake Macquarie
- The overall average booking lead time for vacation rentals in City of Lake Macquarie is 40 days.
- Guests book furthest in advance for stays during December (average 84 days), likely coinciding with peak travel demand or local events.
- The shortest booking windows occur for stays in July (average 15 days), indicating more last-minute travel plans during this time.
- Seasonally, Fall (62 days avg.) sees the longest lead times, while Summer (18 days avg.) has the shortest, reflecting typical travel planning cycles.
Recommendations for Hosts
- Use the overall average lead time (40 days) as a baseline for your pricing and availability strategy in City of Lake Macquarie.
- For December stays, consider implementing length-of-stay discounts or slightly higher rates for bookings made less than 84 days out to capitalize on advance planning.
- Target marketing efforts for the Fall season well in advance (at least 62 days) to capture early planners.
- Monitor your own booking lead times against these City of Lake Macquarie averages to identify opportunities for dynamic pricing adjustments.
Popular & Essential Airbnb Amenities in City of Lake Macquarie (2026)
Amenity Prevalence
Amenity Insights for City of Lake Macquarie
- Essential amenities in City of Lake Macquarie that guests expect include: Smoke alarm, Kitchen, Wifi, TV, Washer. Lacking these (any) could significantly impact bookings.
- Popular amenities like Air conditioning, Hot water kettle, Refrigerator are common but not universal. Offering these can provide a competitive edge.
Recommendations for Hosts
- Ensure your listing includes all essential amenities for City of Lake Macquarie: Smoke alarm, Kitchen, Wifi, TV, Washer.
- Prioritize adding missing essentials: Smoke alarm, Kitchen, Wifi, TV, Washer.
- Consider adding popular differentiators like Air conditioning or Hot water kettle to increase appeal.
- Highlight unique or less common amenities you offer (e.g., hot tub, dedicated workspace, EV charger) in your listing description and photos.
- Regularly check competitor amenities in City of Lake Macquarie to stay competitive.
City of Lake Macquarie Airbnb Guest Demographics & Profile Analysis (2026)
Guest Profile Summary for City of Lake Macquarie
- The typical guest profile for Airbnb in City of Lake Macquarie consists of primarily domestic travelers (94%), often arriving from nearby Sydney, typically belonging to the Post-2000s (Gen Z/Alpha) group (50%), primarily speaking English or Chinese.
- Domestic travelers account for 93.8% of guests.
- Key international markets include Australia (93.8%) and United Kingdom (1.9%).
- Top languages spoken are English (68.1%) followed by Chinese (5.3%).
- A significant demographic segment is the Post-2000s (Gen Z/Alpha) group, representing 50% of guests.
Recommendations for Hosts
- Target domestic marketing efforts towards travelers from Sydney and New South Wales.
- Tailor amenities and listing descriptions to appeal to the dominant Post-2000s (Gen Z/Alpha) demographic (e.g., highlight fast WiFi, smart home features, local guides).
- Highlight unique local experiences or amenities relevant to the primary guest profile.
- Consider seasonal promotions aligned with peak travel times for key origin markets.
Nearby Short-Term Rental Market Comparison
How does the City of Lake Macquarie Airbnb market stack up against its neighbors? Compare key performance metrics like average monthly revenue, ADR, and occupancy rates in surrounding areas to understand the broader regional STR landscape.
| Market | Active Properties | Monthly Revenue | Daily Rate | Avg. Occupancy |
|---|---|---|---|---|
| Berry | 118 | $5,709 | $559.76 | 40% |
| Dawes Point | 10 | $5,632 | $415.45 | 62% |
| Millers Point | 16 | $5,345 | $388.13 | 62% |
| Burrawang | 12 | $5,242 | $557.61 | 38% |
| Penrose | 13 | $5,227 | $681.36 | 40% |
| Nulkaba | 41 | $4,609 | $574.24 | 31% |
| Exeter | 34 | $4,551 | $515.98 | 41% |
| Jaspers Brush | 15 | $4,452 | $445.36 | 34% |
| The Council of the Municipality of Kiama | 109 | $4,372 | $437.99 | 42% |
| Robertson | 46 | $4,320 | $396.04 | 39% |